
7.1: Light and Atomic Structure
- Page ID
- 428729

- Explain the basic behavior of waves, including traveling waves and standing waves
- Describe the wave nature of light
- Use appropriate equations to calculate related light-wave properties such as period, frequency, wavelength, and energy
- Distinguish between line and continuous emission spectra
- Describe the particle nature of light
- Describe the Bohr model of the hydrogen atom
- Use the Rydberg equation to calculate energies of light emitted or absorbed by hydrogen atoms
Light and Electromagnetic Energy
The nature of light has been a subject of inquiry since antiquity. In the seventeenth century, Isaac Newton performed experiments with lenses and prisms and was able to demonstrate that white light consists of the individual colors of the rainbow combined together. Newton explained his optics findings in terms of a "corpuscular" view of light, in which light was composed of streams of extremely tiny particles traveling at high speeds according to Newton's laws of motion. Others in the seventeenth century, such as Christiaan Huygens, had shown that optical phenomena such as reflection and refraction could be equally well explained in terms of light as waves traveling at high speed through a medium called "luminiferous aether" that was thought to permeate all space. Early in the nineteenth century, Thomas Young demonstrated that light passing through narrow, closely spaced slits produced interference patterns that could not be explained in terms of Newtonian particles but could be easily explained in terms of waves. Later in the nineteenth century, after James Clerk Maxwell developed his theory of electromagnetic radiation and showed that light was the visible part of a vast spectrum of electromagnetic waves, the particle view of light became thoroughly discredited. By the end of the nineteenth century, scientists viewed the physical universe as roughly comprising two separate domains: matter composed of particles moving according to Newton's laws of motion, and electromagnetic radiation consisting of waves governed by Maxwell's equations. Today, these domains are referred to as classical mechanics and classical electrodynamics (or classical electromagnetism). Although there were a few physical phenomena that could not be explained within this framework, scientists at that time were so confident of the overall soundness of this framework that they viewed these aberrations as puzzling paradoxes that would ultimately be resolved somehow within this framework. As we shall see, these paradoxes led to a contemporary framework that intimately connects particles and waves at a fundamental level called wave-particle duality, which has superseded the classical view.
Visible light and other forms of electromagnetic radiation play important roles in chemistry, since they can be used to infer the energies of electrons within atoms and molecules. Much of modern technology is based on electromagnetic radiation. For example, radio waves from a mobile phone, X-rays used by dentists, the energy used to cook food in your microwave, the radiant heat from red-hot objects, and the light from your television screen are forms of electromagnetic radiation that all exhibit wavelike behavior.
Waves
A wave is an oscillation or periodic movement that can transport energy from one point in space to another. Common examples of waves are all around us. Shaking the end of a rope transfers energy from your hand to the other end of the rope, dropping a pebble into a pond causes waves to ripple outward along the water's surface, and the expansion of air that accompanies a lightning strike generates sound waves (thunder) that can travel outward for several miles. In each of these cases, kinetic energy is transferred through matter (the rope, water, or air) while the matter remains essentially in place. An insightful example of a wave occurs in sports stadiums when fans in a narrow region of seats rise simultaneously and stand with their arms raised up for a few seconds before sitting down again while the fans in neighboring sections likewise stand up and sit down in sequence. While this wave can quickly encircle a large stadium in a few seconds, none of the fans actually travel with the wave-they all stay in or above their seats.
Waves need not be restricted to travel through matter. As Maxwell showed, electromagnetic waves consist of an electric field oscillating in step with a perpendicular magnetic field, both of which are perpendicular to the direction of travel. These waves can travel through a vacuum at a constant speed of 2.998 × 10⁸ m/s, the speed of light (denoted by c).
All waves, including forms of electromagnetic radiation, are characterized by, a wavelength (denoted by λ, the lowercase Greek letter lambda), a frequency (denoted by \(\nu\), the lowercase Greek letter nu), and an amplitude. As can be seen in Figure \(\PageIndex{1}\), the wavelength is the distance between two consecutive peaks or troughs in a wave (measured in meters in the SI system). Electromagnetic waves have wavelengths that fall within an enormous range-wavelengths of kilometers (103 m) to picometers (10−12 m) have been observed. The frequency is the number of wave cycles that pass a specified point in space in a specified amount of time (in the SI system, this is measured in seconds). A cycle corresponds to one complete wavelength. The unit for frequency, expressed as cycles per second [s−1], is the hertz (Hz). Common multiples of this unit are megahertz, (1 MHz = 1 × 10⁶ Hz) and gigahertz (1 GHz = 1 × 10⁹ Hz). The amplitude corresponds to the magnitude of the wave's displacement and so, in Figure, this corresponds to one-half the height between the peaks and troughs. The amplitude is related to the intensity of the wave, which for sound is the loudness.

The product of a wave's wavelength (λ) and its frequency ( \(\nu\) ), λ \(\nu\) , is the speed of the wave. Thus, for electromagnetic radiation in a vacuum:
\[c=\mathrm{2.998×10^8\,ms^{−1}}=λ \nu \]
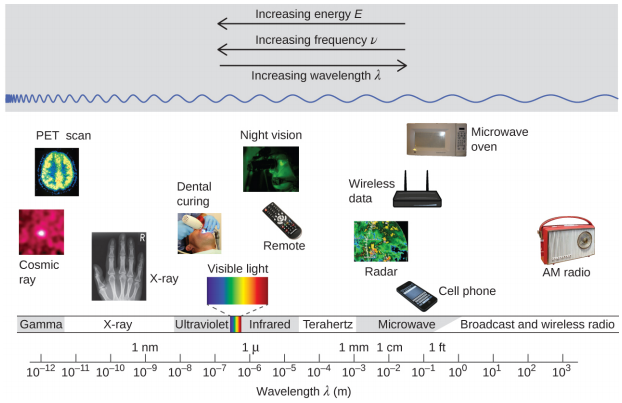
Wavelength and frequency are inversely proportional: As the wavelength increases, the frequency decreases. The inverse proportionality is illustrated in Figure \(\PageIndex{2}\). This figure also shows the electromagnetic spectrum, the range of all types of electromagnetic radiation. Each of the various colors of visible light has specific frequencies and wavelengths associated with them, and you can see that visible light makes up only a small portion of the electromagnetic spectrum. Because the technologies developed to work in various parts of the electromagnetic spectrum are different, for reasons of convenience and historical legacies, different units are typically used for different parts of the spectrum. For example, radio waves are usually specified as frequencies (typically in units of MHz), while the visible region is usually specified in wavelengths (typically in units of nm or angstroms).
A sodium streetlight gives off yellow light that has a wavelength of 589 nm (1 nm = 1 × 10⁻⁹ m). What is the frequency of this light?
Solution
We can rearrange the Equation \(\PageIndex{1}\) to solve for the frequency:
\[ \nu=\dfrac{c}{λ} \nonumber\]
Since c is expressed in meters per second, we must also convert 589 nm to meters.
\[ \nu=\mathrm{\left(\dfrac{2.998×10^8\:\cancel{m}s^{−1}}{589\cancel{nm}}\right)\left(\dfrac{1×10^9\cancel{nm}}{1\cancel{m}}\right)=5.09×10^{14}\,s^{−1}} \nonumber\]
One of the frequencies used to transmit and receive cellular telephone signals in the United States is 850 MHz. What is the wavelength in meters of these radio waves?
- Answer
-
0.353 m = 35.3 cm
One particularly characteristic phenomenon of waves results when two or more waves come into contact: They interfere with each other. Figure \(\PageIndex{3}\) shows the interference patterns that arise when light passes through narrow slits closely spaced about a wavelength apart. The fringe patterns produced depend on the wavelength, with the fringes being more closely spaced for shorter wavelength light passing through a given set of slits. When the light passes through the two slits, each slit effectively acts as a new source, resulting in two closely spaced waves coming into contact at the detector (the camera in this case). The dark regions in Figure \(\PageIndex{3}\) correspond to regions where the peaks for the wave from one slit happen to coincide with the troughs for the wave from the other slit (destructive interference), while the brightest regions correspond to the regions where the peaks for the two waves (or their two troughs) happen to coincide (constructive interference). Likewise, when two stones are tossed close together into a pond, interference patterns are visible in the interactions between the waves produced by the stones. Such interference patterns cannot be explained by particles moving according to the laws of classical mechanics.

Because the wavelengths of X-rays (10-10,000 picometers [pm]) are comparable to the size of atoms, X-rays can be used to determine the structure of molecules. When a beam of X-rays is passed through molecules packed together in a crystal, the X-rays collide with the electrons and scatter. Constructive and destructive interference of these scattered X-rays creates a specific diffraction pattern. Calculating backward from this pattern, the positions of each of the atoms in the molecule can be determined very precisely. One of the pioneers who helped create this technology was Dorothy Crowfoot Hodgkin.
She was born in Cairo, Egypt, in 1910, where her British parents were studying archeology. Even as a young girl, she was fascinated with minerals and crystals. When she was a student at Oxford University, she began researching how X-ray crystallography could be used to determine the structure of biomolecules. She invented new techniques that allowed her and her students to determine the structures of vitamin B12, penicillin, and many other important molecules. Diabetes, a disease that affects 382 million people worldwide, involves the hormone insulin. Hodgkin began studying the structure of insulin in 1934, but it required several decades of advances in the field before she finally reported the structure in 1969. Understanding the structure has led to better understanding of the disease and treatment options.
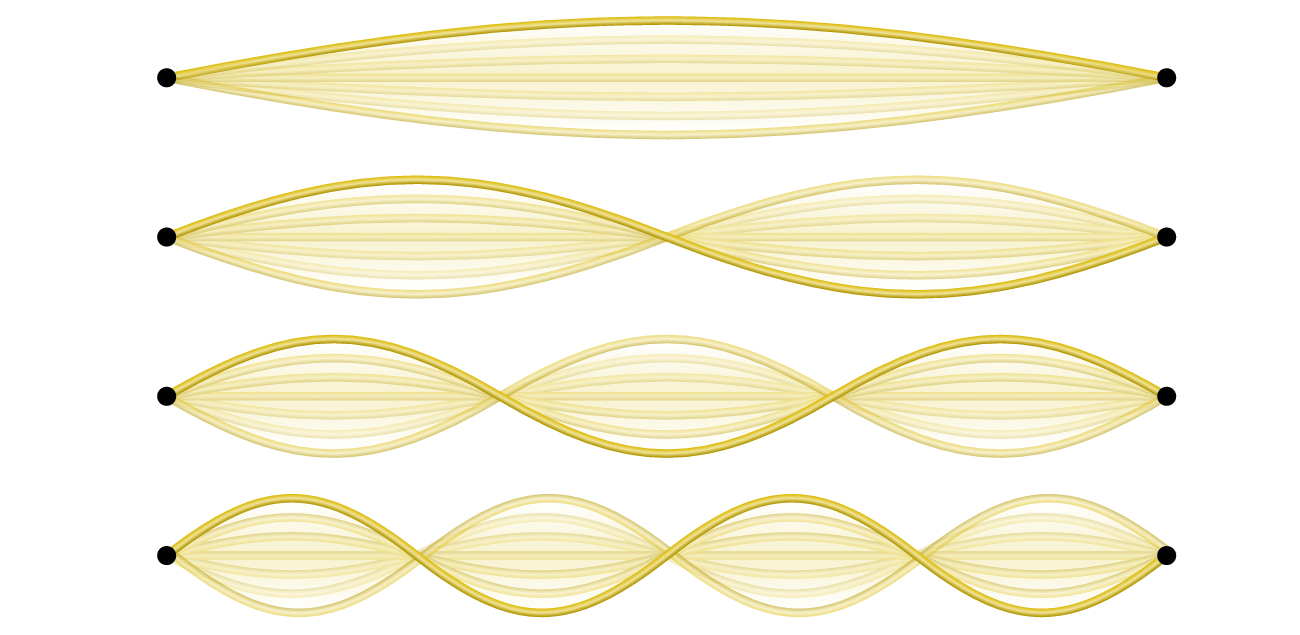
Not all waves are traveling waves. Standing waves (also known as stationary waves) remain constrained within some region of space. As we shall see, standing waves play an important role in our understanding of the electronic structure of atoms and molecules. The simplest example of a standing wave is a one-dimensional wave associated with a vibrating string that is held fixed at its two end points. Figure \(\PageIndex{4}\) shows the four lowest-energy standing waves (the fundamental wave and the lowest three harmonics) for a vibrating string at a particular amplitude. Although the string's motion lies mostly within a plane, the wave itself is considered to be one dimensional, since it lies along the length of the string. The motion of string segments in a direction perpendicular to the string length generates the waves and so the amplitude of the waves is visible as the maximum displacement of the curves seen in Figure \(\PageIndex{4}\). The key observation from the figure is that only those waves having an integer number, n, of half-wavelengths between the end points can form. A system with fixed end points such as this restricts the number and type of the possible waveforms. This is an example of quantization, in which only discrete values from a more general set of continuous values of some property are observed. Another important observation is that the harmonic waves (those waves displaying more than one-half wavelength) all have one or more points between the two end points that are not in motion. These special points are nodes. The energies of the standing waves with a given amplitude in a vibrating string increase with the number of half-wavelengths n. Since the number of nodes is n – 1, the energy can also be said to depend on the number of nodes, generally increasing as the number of nodes increases.
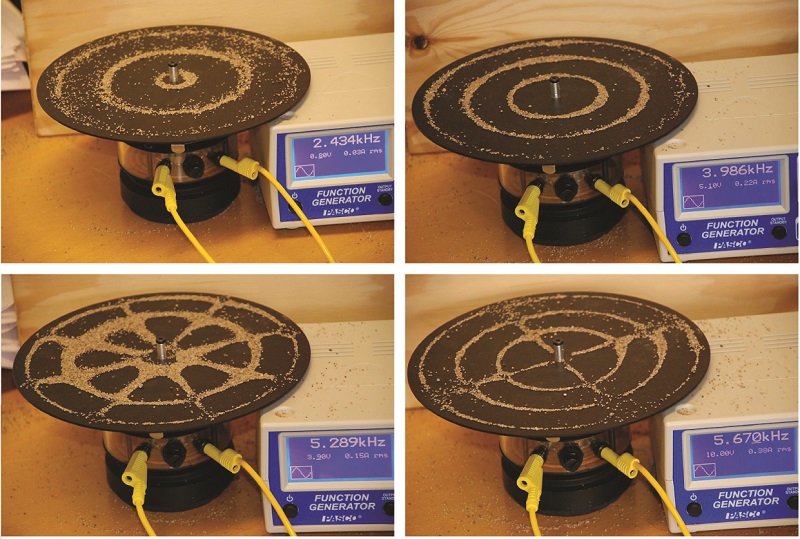
An example of two-dimensional standing waves is shown in Figure \(\PageIndex{5}\) which shows the vibrational patterns on a flat surface. Although the vibrational amplitudes cannot be seen like they could in the vibrating string, the nodes have been made visible by sprinkling the drum surface with a powder that collects on the areas of the surface that have minimal displacement. For one-dimensional standing waves, the nodes were points on the line, but for two-dimensional standing waves, the nodes are lines on the surface. Because of the circular symmetry of the drum surface, its boundary conditions (the drum surface being tightly constrained to the circumference of the drum) result in two types of nodes: radial nodes that sweep out all angles at constant radii and, thus, are seen as circles about the center, and angular nodes that sweep out all radii at constant angles and, thus, are seen as lines passing through the center. The upper left image in Figure \(\PageIndex{5}\) shows two radial nodes, while the image in the lower right shows the vibrational pattern associated with three radial nodes and two angular nodes.
The Photoelectric Effect
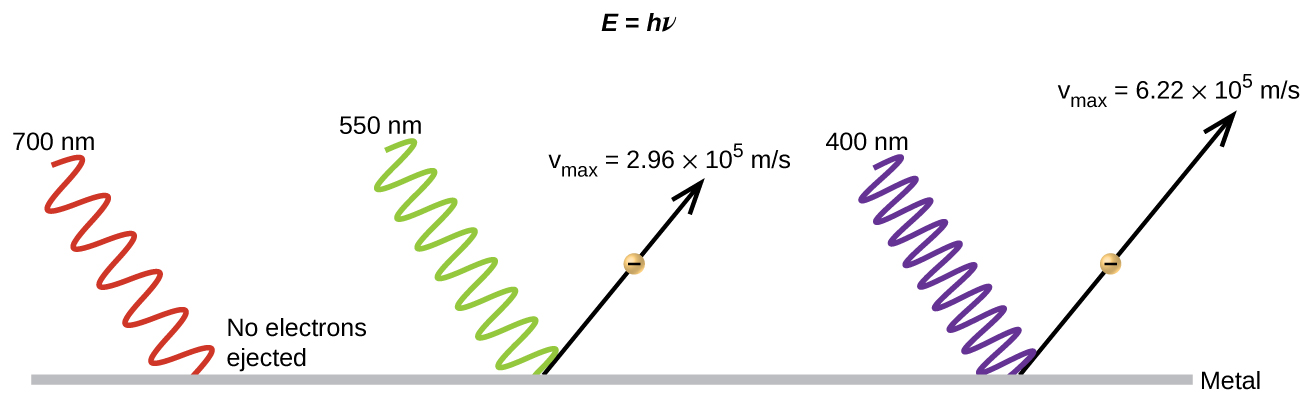
The next paradox in the classical theory to be resolved concerned the photoelectric effect (Figure \(\PageIndex{6}\)). It had been observed that electrons could be ejected from the clean surface of a metal when light having a frequency greater than some threshold frequency was shone on it. Surprisingly, the kinetic energy of the ejected electrons did not depend on the brightness of the light, but increased with increasing frequency of the light. Since the electrons in the metal had a certain amount of binding energy keeping them there, the incident light needed to have more energy to free the electrons. According to classical wave theory, a wave's energy depends on its amplitude, not its frequency. One part of these observations was that the number of electrons ejected within in a given time period was seen to increase as the brightness increased. In 1905, Albert Einstein was able to resolve the paradox by incorporating Planck's quantization findings into the discredited particle view of light. Einstein won his Nobel prize for this work, and not for his theories of relativity for which he is most famous.
Einstein argued that the quantized energies that Planck had postulated in his treatment of blackbody radiation could be applied to the light in the photoelectric effect so that the light striking the metal surface should not be viewed as a wave, but instead as a stream of particles (later called photons) whose energy depended on their frequency, not amplitude. Electrons were ejected when hit by photons having sufficient energy (a frequency greater than the threshold). The greater the frequency, the greater the kinetic energy imparted to the escaping electrons by the collisions. Einstein also argued that the light intensity did not depend on the amplitude of the incoming wave, but instead corresponded to the number of photons striking the surface within a given time period. This explains why the number of ejected electrons increased with increasing brightness, since the greater the number of incoming photons, the greater the likelihood that they would collide with some of the electrons. This shows the brightness or intensity of light depends on the number of photos, not the amplitude of the wave.
According to Planck's formula where E is the energy of a single photon, h is planks constant (6.62607015 x 10⁻³⁴ J sec) and \(\nu\) is the frequency.
\[E=\mathrm{h \nu} \]
With Einstein's findings, the nature of light took on a new air of mystery. Although many light phenomena could be explained either in terms of waves or particles, certain phenomena, such as the interference patterns obtained when light passed through a double slit, were completely contrary to a particle view of light, while other phenomena, such as the photoelectric effect, were completely contrary to a wave view of light. Somehow, at a deep fundamental level still not fully understood, light is both wavelike and particle-like. This is known as wave-particle duality.
When we see light from a neon sign, we are observing radiation from excited neon atoms. If this radiation has a wavelength of 640 nm, what is the energy of the photon being emitted?
Solution
We use the part of Planck's equation that includes the wavelength, λ, and convert units of nanometers to meters so that the units of λ and c are the same.
\[\begin{align*} E&=\dfrac{hc}{λ} \\[4pt] &=\mathrm{\dfrac{(6.626×10^{−34}\:J\cancel{s})(2.998×10^{8}\:m\cancel{s}^{−1})}{(640\cancel{nm})\left(\dfrac{1\:m}{10^9\cancel{nm}}\right)}}\\[4pt] &=\mathrm{3.10×10^{−19}\:J} \end{align*}\]
The microwaves in an oven are of a specific frequency that will heat the water molecules contained in food. (This is why most plastics and glass do not become hot in a microwave oven-they do not contain water molecules.) This frequency is about 3 × 10⁹ Hz. What is the energy of one photon in these microwaves?
- Answer
-
2 × 10⁻²⁴ J
Line Spectra
Another paradox within the classical electromagnetic theory that scientists in the late nineteenth century struggled with concerned the light emitted from atoms and molecules. When solids, liquids, or condensed gases are heated sufficiently, they radiate some of the excess energy as light. Photons produced in this manner have a range of energies, and thereby produce a continuous spectrum in which an unbroken series of wavelengths is present. Most of the light generated from stars (including our sun) is produced in this fashion. You can see all the visible wavelengths of light present in sunlight by using a prism to separate them. Sunlight also contains UV light (shorter wavelengths) and IR light (longer wavelengths) that can be detected using instruments but that are invisible to the human eye. Incandescent (glowing) solids such as tungsten filaments in incandescent lights also give off light that contains all wavelengths of visible light. These continuous spectra can often be approximated by blackbody radiation curves at some appropriate temperature.
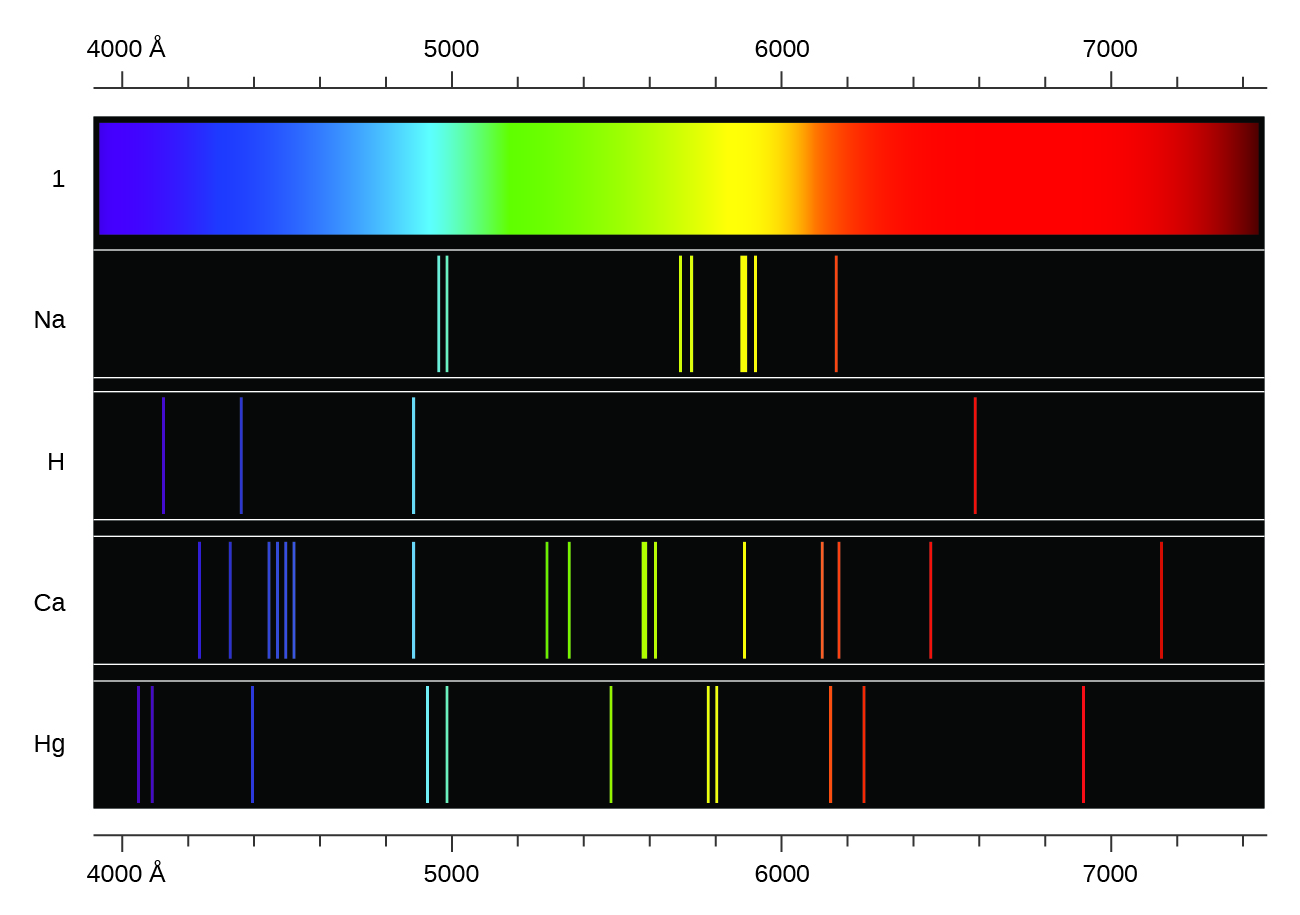
In contrast to continuous spectra, light can also occur as discrete or line spectra having very narrow line widths interspersed throughout the spectral regions. Exciting a gas at low partial pressure using an electrical current, or heating it, will produce line spectra. Fluorescent light bulbs and neon signs operate in this way (Figure \(\PageIndex{7}\)). Each element displays its own characteristic set of lines, as do molecules, although their spectra are generally much more complicated.

Each emission line consists of a single wavelength of light, which implies that the light emitted by a gas consists of a set of discrete energies. For example, when an electric discharge passes through a tube containing hydrogen gas at low pressure, the H2 molecules are broken apart into separate H atoms, and we see a blue-pink color. Passing the light through a prism produces a line spectrum, indicating that this light is composed of photons of four visible wavelengths, as shown in Figure \(\PageIndex{8}\).
The origin of discrete spectra in atoms and molecules was extremely puzzling to scientists in the late nineteenth century, since according to classical electromagnetic theory, only continuous spectra should be observed. Even more puzzling, in 1885, Johann Balmer was able to derive an empirical equation that related the four visible wavelengths of light emitted by hydrogen atoms to whole integers. That equation is the following one, in which k is a constant:
\[\dfrac{1}{λ}=k\left(\dfrac{1}{4}−\dfrac{1}{n^2}\right),\:n=3,\:4,\:5,\:6\]
Other discrete lines for the hydrogen atom were found in the UV and IR regions. Johannes Rydberg generalized Balmer's work and developed an empirical formula that predicted all of hydrogen's emission lines, not just those restricted to the visible range, where, n1 and n2 are integers, n1 < n2, and \(R_∞\) is the Rydberg constant (1.097 × 10⁷ m−1).
\[\dfrac{1}{λ}=R_∞\left(\dfrac{1}{n^2_1}−\dfrac{1}{n^2_2}\right)\]
Even in the late nineteenth century, spectroscopy was a very precise science, and so the wavelengths of hydrogen were measured to very high accuracy, which implied that the Rydberg constant could be determined very precisely as well. That such a simple formula as the Rydberg formula could account for such precise measurements seemed astounding at the time, but it was the eventual explanation for emission spectra by Neils Bohr in 1913 that ultimately convinced scientists to abandon classical physics and spurred the development of modern quantum mechanics.
Atomic Structure
Following the work of Ernest Rutherford and his colleagues in the early twentieth century, the picture of atoms consisting of tiny dense nuclei surrounded by lighter and even tinier electrons continually moving about the nucleus was well established. This picture was called the planetary model, since it pictured the atom as a miniature “solar system” with the electrons orbiting the nucleus like planets orbiting the sun. The simplest atom is hydrogen, consisting of a single proton as the nucleus about which a single electron moves. This classical mechanics description of the atom is incomplete, however, since an electron moving in an elliptical orbit would be accelerating (by changing direction) and, according to classical electromagnetism, it should continuously emit electromagnetic radiation. This loss in orbital energy should result in the electron’s orbit getting continually smaller until it spirals into the nucleus, implying that atoms are inherently unstable.
In 1913, Niels Bohr attempted to resolve the atomic paradox by ignoring classical electromagnetism’s prediction that the orbiting electron in hydrogen would continuously emit light. Instead, he incorporated into the classical mechanics description of the atom Planck’s ideas of quantization and Einstein’s finding that light consists of photons whose energy is proportional to their frequency. Bohr assumed that the electron orbiting the nucleus would not normally emit any radiation (the stationary state hypothesis), but it would emit or absorb a photon if it moved to a different orbit. This model leads directly to the Rydberg equation discussed in section 7.1. In this equation, h is Planck’s constant (6.62607015 x 10⁻³⁴ J sec), with \(n=1,2,3, ...\), \(k\) is a constant comprising fundamental constants such as the electron mass and charge, \(k\) has a value of \(2.179 \times 10^{–18}\; J\).
\[ \dfrac{1}{\lambda}=\dfrac{k}{hc} \left(\dfrac{1}{n^2_1}−\dfrac{1}{n_2^2}\right) \]
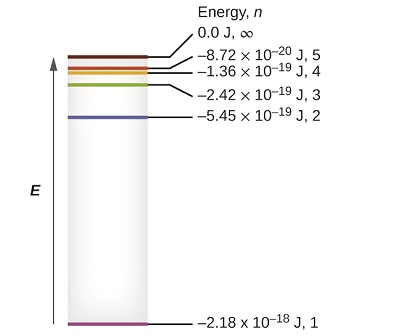
The lowest few energy levels are shown in Figure \(\PageIndex{9}\). One of the fundamental laws of physics is that matter is most stable with the lowest possible energy. Thus, the electron in a hydrogen atom usually moves in the \(n = 1\) orbit, the orbit in which it has the lowest energy. When the electron is in this lowest energy orbit, the atom is said to be in its ground state. If the atom receives energy from an outside source, it is possible for the electron to move to an orbit with a higher \(n\) value and the atom is now in an excited state with a higher energy. When an electron transitions from an excited state (higher energy orbit) to the ground state, the difference in energy is emitted as a photon. Similarly, if a photon is absorbed by an atom, the energy of the photon moves an electron from a lower energy orbit up to a more excited one.
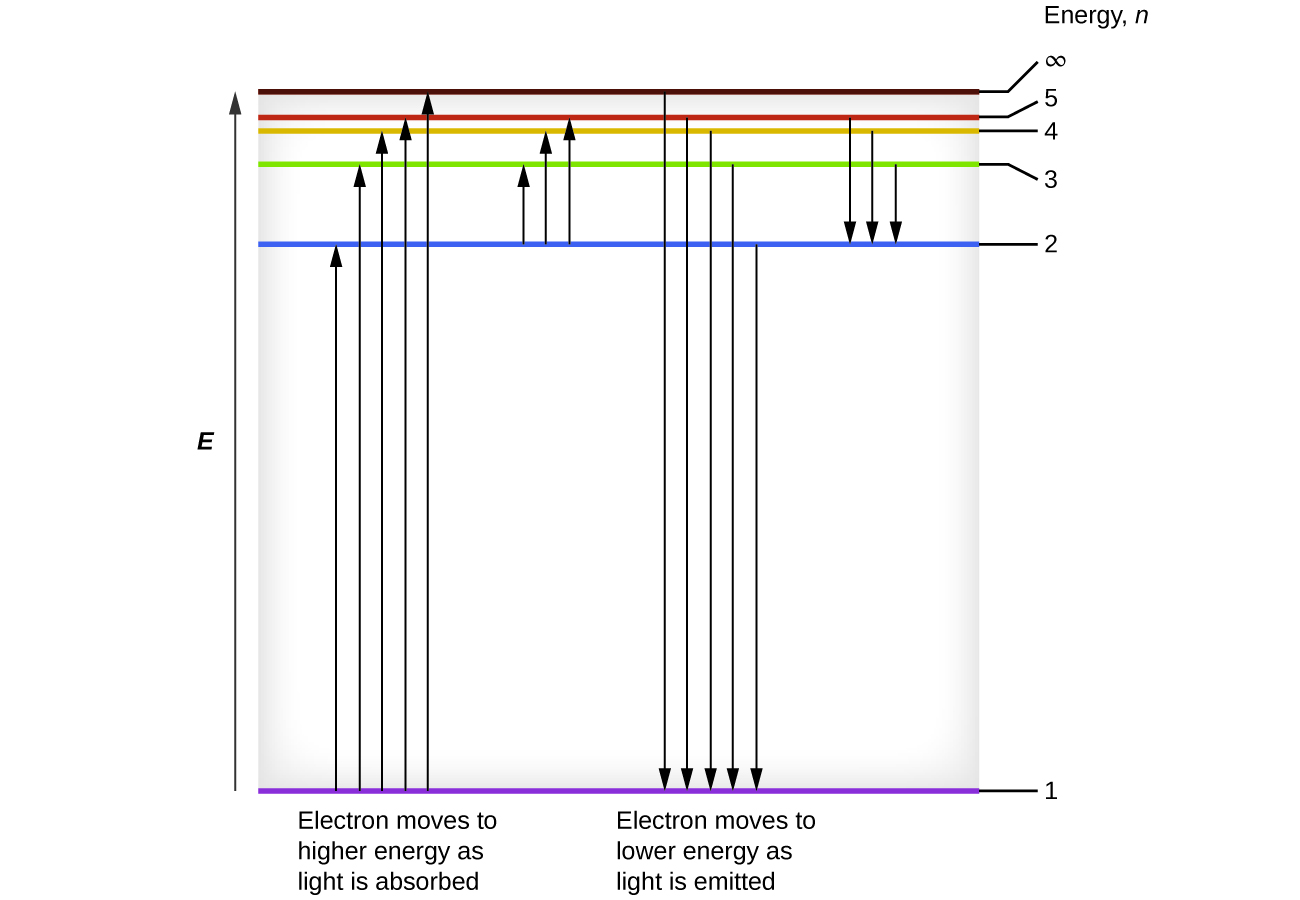
We can relate the energy of electrons in atoms to what we learned previously about energy. The law of conservation of energy says that we can neither create nor destroy energy. Thus, if a certain amount of external energy is required to excite an electron from one energy level to another, that same amount of energy will be liberated when the electron returns to its initial state (Figure \(\PageIndex{10}\)). In effect, an atom can “store” energy by using it to promote an electron to a state with a higher energy and release it when the electron returns to a lower state. The energy can be released as one quantum of energy, as the electron returns to its ground state (say, from \(n = 5\) to \(n = 1\)), or it can be released as two or more smaller quanta as the electron falls to an intermediate state, then to the ground state (say, from \(n = 5\) to \(n = 4\), emitting one quantum, then to \(n = 1\), emitting a second quantum).
With three extremely puzzling paradoxes now solved (blackbody radiation, the photoelectric effect, and the hydrogen atom), and all involving Planck’s constant in a fundamental manner, it became clear to most physicists at that time that the classical theories that worked so well in the macroscopic world were fundamentally flawed and could not be extended down into the microscopic domain of atoms and molecules. Unfortunately, despite Bohr’s remarkable achievement in deriving a theoretical expression for the Rydberg constant, he was unable to extend his theory to the next simplest atom, He, which only has two electrons. Bohr’s model was severely flawed, since it was still based on the classical mechanics notion of precise orbits, a concept that was later found to be untenable in the microscopic domain, when a proper model of quantum mechanics was developed to supersede classical mechanics.
What is the energy (in joules) and the wavelength (in meters) of the line in the spectrum of hydrogen that represents the movement of an electron from Bohr orbit with n = 4 to the orbit with n = 6? In what part of the electromagnetic spectrum do we find this radiation?
Solution
In this case, the electron starts out with \(n = 4\), so \(n_1 = 4\). It comes to rest in the \(n = 6\) orbit, so \(n_2 = 6\). The difference in energy between the two states is given by this expression:
\[ΔE=E_1−E_2=2.179 \times 10^{−18}\left(\dfrac{1}{n^2_1}−\dfrac{1}{n_2^2}\right)\]
\[ΔE=2.179 \times 10^{−18} \left(\dfrac{1}{4^2}−\dfrac{1}{6^2}\right)\; J\]
\[ΔE=2.179 \times 10^{−18} \left(\dfrac{1}{16}−\dfrac{1}{36}\right)\;J\]
\[ΔE=7.566 \times 10^{−20}\;J\]
This energy difference is positive, indicating a photon enters the system (is absorbed) to excite the electron from the n = 4 orbit up to the \(n = 6\) orbit. The wavelength of a photon with this energy is found by the expression \(E=hc \lambda\). Rearrangement gives:
\[ \lambda=\dfrac{hc}{E}\]
From the figure of electromagnetic radiation, we can see that this wavelength is found in the infrared portion of the electromagnetic spectrum.
What is the wavelength in meters and the energy in Joules of the photon produced when an electron falls from the \(n = 5\) to the \(n = 3\) level in a H atom.
- Answer
-
\(6.837 \times 10^{−7}\; m\) and \(2.90 \times 10^{–19}\; J\)
Bohr’s model of the hydrogen atom provides insight into the behavior of matter at the microscopic level, but it is does not account for electron–electron interactions in atoms with more than one electron. It does introduce several important features of all models used to describe the distribution of electrons in an atom. These features include the following:
- The energies of electrons (energy levels) in an atom are quantized, described by quantum numbers: integer numbers having only specific allowed value and used to characterize the arrangement of electrons in an atom.
- An electron’s energy increases with increasing distance from the nucleus.
- The discrete energies (lines) in the spectra of the elements result from quantized electronic energies.
Of these features, the most important is the postulate of quantized energy levels for an electron in an atom. As a consequence, the model laid the foundation for the quantum mechanical model of the atom. Bohr won a Nobel Prize in Physics for his contributions to our understanding of the structure of atoms and how that is related to line spectra emissions.
Summary
Light and other forms of electromagnetic radiation move through a vacuum with a constant speed, c, of 2.998 × 10⁸ m s−1. This radiation shows wavelike behavior, which can be characterized by a frequency, ν, and a wavelength, λ, such that c = λν. Light is an example of a travelling wave. Other important wave phenomena include standing waves, periodic oscillations, and vibrations. Standing waves exhibit quantization, since their wavelengths are limited to discrete integer multiples of some characteristic lengths. Electromagnetic radiation that passes through two closely spaced narrow slits having dimensions roughly similar to the wavelength will show an interference pattern that is a result of constructive and destructive interference of the waves.
Electromagnetic radiation also demonstrates properties of particles called photons. The energy of a photon is related to the frequency (or alternatively, the wavelength) of the radiation as E = hν (or \(E=\dfrac{hc}{λ}\)), where h is Planck's constant.
That light demonstrates both wavelike and particle-like behavior is known as wave-particle duality. All forms of electromagnetic radiation share these properties, although various forms including X-rays, visible light, microwaves, and radio waves interact differently with matter and have very different practical applications. Electromagnetic radiation can be generated by exciting matter to higher energies, such as by heating it. The emitted light can be either continuous (incandescent sources like the sun) or discrete (from specific types of excited atoms). Continuous spectra often have distributions that can be approximated as blackbody radiation at some appropriate temperature. The line spectrum of hydrogen can be obtained by passing the light from an electrified tube of hydrogen gas through a prism. This line spectrum was simple enough that an empirical formula called the Rydberg formula could be derived from the spectrum. Three historically important paradoxes from the late 19th and early 20th centuries that could not be explained within the existing framework of classical mechanics and classical electromagnetism were the blackbody problem, the photoelectric effect, and the discrete spectra of atoms. The resolution of these paradoxes ultimately led to quantum theories that superseded the classical theories.
Bohr incorporated Planck’s and Einstein’s quantization ideas into a model of the hydrogen atom that resolved the paradox of atom stability and discrete spectra. The Bohr model of the hydrogen atom explains the connection between the quantization of photons and the quantized emission from atoms. Bohr described the hydrogen atom in terms of an electron moving in a circular orbit about a nucleus. He postulated that the electron was restricted to certain orbits characterized by discrete energies. Transitions between these allowed orbits result in the absorption or emission of photons. When an electron moves from a higher-energy orbit to a more stable one, energy is emitted in the form of a photon. To move an electron from a stable orbit to a more excited one, a photon of energy must be absorbed. Using the Bohr model, we can calculate the energy of an electron and the radius of its orbit in any one-electron system.
Key Equations
- c = λν, where c = 2.99792458 x 10⁸ m/s
- \(E=hν=\dfrac{hc}{λ}\), where h = 6.626 × 10⁻³⁴ J s
- \(\dfrac{1}{λ}=R_∞\left(\dfrac{1}{n^2_1}−\dfrac{1}{n^2_2}\right)\), where \(R_∞\) = 1.097 x 10⁷ m-1
Glossary
- amplitude
- extent of the displacement caused by a wave (for sinusoidal waves, it is one-half the difference from the peak height to the trough depth, and the intensity is proportional to the square of the amplitude)
- blackbody
- idealized perfect absorber of all incident electromagnetic radiation; such bodies emit electromagnetic radiation in characteristic continuous spectra called blackbody radiation
- Bohr’s model of the hydrogen atom
- structural model in which an electron moves around the nucleus only in circular orbits, each with a specific allowed radius; the orbiting electron does not normally emit electromagnetic radiation, but does so when changing from one orbit to another.
- continuous spectrum
- electromagnetic radiation given off in an unbroken series of wavelengths (e.g., white light from the sun)
- electromagnetic radiation
- energy transmitted by waves that have an electric-field component and a magnetic-field component
- electromagnetic spectrum
- range of energies that electromagnetic radiation can comprise, including radio, microwaves, infrared, visible, ultraviolet, X-rays, and gamma rays; since electromagnetic radiation energy is proportional to the frequency and inversely proportional to the wavelength, the spectrum can also be specified by ranges of frequencies or wavelengths
- excited state
- state having an energy greater than the ground-state energy
- frequency (\(\nu\))
- number of wave cycles (peaks or troughs) that pass a specified point in space per unit time
- ground state
- state in which the electrons in an atom, ion, or molecule have the lowest energy possible
- hertz (Hz)
- the unit of frequency, which is the number of cycles per second, s−1
- intensity
- property of wave-propagated energy related to the amplitude of the wave, such as brightness of light or loudness of sound
- interference pattern
- pattern typically consisting of alternating bright and dark fringes; it results from constructive and destructive interference of waves
- line spectrum
- electromagnetic radiation emitted at discrete wavelengths by a specific atom (or atoms) in an excited state
- node
- any point of a standing wave with zero amplitude
- photon
- smallest possible packet of electromagnetic radiation, a particle of light
- quantization
- occurring only in specific discrete values, not continuous
- quantum number
- integer number having only specific allowed values and used to characterize the arrangement of electrons in an atom
- standing wave
- (also, stationary wave) localized wave phenomenon characterized by discrete wavelengths determined by the boundary conditions used to generate the waves; standing waves are inherently quantized
- wave
- oscillation that can transport energy from one point to another in space
- wavelength (λ)
- distance between two consecutive peaks or troughs in a wave
- wave-particle duality
- term used to describe the fact that elementary particles including matter exhibit properties of both particles (including localized position, momentum) and waves (including nonlocalization, wavelength, frequency)
Contributors and Attributions
Paul Flowers (University of North Carolina - Pembroke), Klaus Theopold (University of Delaware) and Richard Langley (Stephen F. Austin State University) with contributing authors. Textbook content produced by OpenStax College is licensed under a Creative Commons Attribution License 4.0 license. Download for free at http://cnx.org/contents/85abf193-2bd...a7ac8df6@9.110).
Paul Flowers (University of North Carolina - Pembroke), Klaus Theopold (University of Delaware) and Richard Langley (Stephen F. Austin State University) with contributing authors. Textbook content produced by OpenStax College is licensed under a Creative Commons Attribution License 4.0 license. Download for free at http://cnx.org/contents/85abf193-2bd...a7ac8df6@9.110).