4.5: Separating Volatile Solutions - Distillation
- Page ID
- 137797
Make sure you thoroughly understand the following essential ideas:
- Sketch out a typical boiling point diagram for a binary liquid solution, and use this to show how a simple one-stage distillation works.
- Explain the role of the lever rule in fractional distillation
- Describe the purpose and function of a fractionating column
- Sketch out boiling point diagrams for high- and low-boiling azeotropes
- Describe the role of distillation in crude oil refining, and explain, in a very general way, how further processing is used to increase the yield of gasoline motor fuel.
Distillation is a process whereby a mixture of liquids having different vapor pressures is separated into its components. At first one might think that this would be quite simple: if you have a solution consisting of liquid A that boils at 50°C and liquid B with a boiling point of 90°C, all that would be necessary would be to heat the mixture to some temperature between these two values; this would boil off all the A (whose vapor could then be condensed back into pure liquid A), leaving pure liquid B in the pot. But that overlooks that fact that these liquids will have substantial vapor pressures at all temperatures, not only at their boiling points.
Vapor Pressure vs. Composition Phase Diagrams
To fully understand distillation, we will consider an ideal binary liquid mixture of \(\ce{A}\) and \(\ce{B}\). If the mole fraction of \(A\) in the mixture is \(\chi_A\), then by the definition of mole fraction, that of \(B\) is
\[\chi_B = 1 – \chi_A\]
Since distillation depends on the different vapor pressures of the components to be separated, let's first consider the vapor pressure vs. composition plots (Figure \(\PageIndex{1}\)) for a hypothetical mixture at some arbitrary temperature at which both liquid and gas phases can exist, depending on the total pressure.
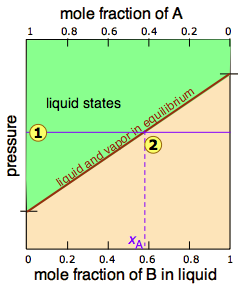
In Figure \(\PageIndex{2}\), all states of the system (i.e., combinations of pressure and composition) in which the solution exists solely as a liquid are shaded in green. Since liquids are more stable at higher pressures, these states occupy the upper part of the diagram. At any given total vapor pressure such as at  , the composition of the vapor in equilibrium with the liquid (designated by \(x_A\)) corresponds to the intercept with the diagonal equilibrium line at
  . The diagonal line is just an expression of the linearity between vapor pressure and composition according to Raoult's law.
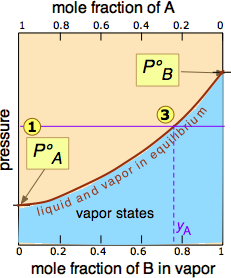
 of the pressure line
  with the equilibrium curve defines the mole fractions of \(\ce{A}\) and \(\ce{B}\) present in the vapor. (Note that mole fractions of gases, which we are dealing with here, are conventionally represented by y, hence yA and yB). The curvature of the equilibrium line arises from the need to combine Raoult's law with Dalton's law of partial pressures which applies to gaseous mixtures. Figure \(\PageIndex{3}\).
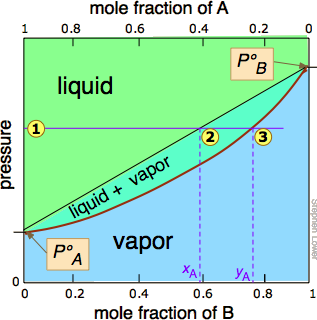
The two liquid-vapor equilibrium lines (one curved, the other straight) now enclose an area in which liquid and vapor can coexist; outside of this region, the mixture will consist entirely of liquid or of vapor. At this particular pressure  , the intercept
  with the upper boundary of the two-phase region gives the mole fractions of A and B in the liquid phase, while the intercept
  with the lower boundary gives the mole fractions of the two components in the vapor.
Take a moment to study Figure \(\PageIndex{5}\) and to confirm that
- because both intercepts occur on equilibrium lines, they describe the compositions of the liquid and vapor that can simultaneously exist;
- the compositions of the vapor and liquid are not the same;
- in the vapor, the mole fraction of \(\ce{B}\) (the more volatile component of the solution) is greater than that in the liquid;
- in the liquid, the mole fraction of \(\ce{A}\) (the less volatile component) is smaller than that of the vapor.
The vapor in equilibrium with a solution of two or more liquids is always richer in the more volatile component.
Temperatures vs. Composition Phase Diagrams (Boiling Point Diagrams)
The lever rule discussed above suggests that if we heat a mixture sufficiently to bring its total vapor pressure into the two-phase region, we will have a means of separating the mixture into two portions which will be enriched in the more volatile and less volatile components respectively. This is the principle on which distillation is based. But what temperature is required to achieve this? Again, we will spare you the mathematical details, but it is possible to construct a plot similar to the Figure \(\PageIndex{4}\) except that the vertical axis represents temperature rather than pressure. This kind of plot is called a boiling point diagram.
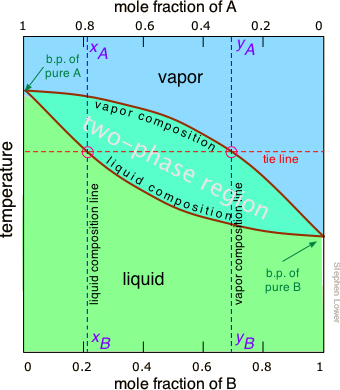
Some important things to understand about Figure \(\PageIndex{6}\):
- The shape of the two-phase region is bi-convex, as opposed to the half-convex shape of the pressure-composition plot.
- The slope of the two-phase region is opposite to what we saw in the previous plot, and the areas corresponding to the single-phase regions are reversed. This simply reflects the fact that liquids having a higher vapor pressure boil at lower temperatures, and vice versa.
- The horizontal line that defines the temperature is called the tie line. Its intercepts with the two equilibrium curves specify the composition of the liquid and vapor in equilibrium with the mixture at the given temperature.
- The vapor composition line is also known as the dew point line — the temperature at which condensation begins on cooling.
- The liquid composition line is also called the bubble point line — the temperature at which boiling begins on heating.
The tie line shown in Figure \(\PageIndex{4}\) is for one particular temperature. But when we heat a liquid to its boiling point, the composition will change as the more volatile component (\(\ce{B}\) in these examples) is selectively removed as vapor. The remaining liquid will be enriched in the less volatile component, and its boiling point will consequently rise. To understand this process more thoroughly, let us consider the situation at several points during the distillation of an equimolar solution of \(\ce{A}\) and \(\ce{B}\).
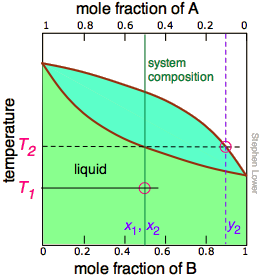

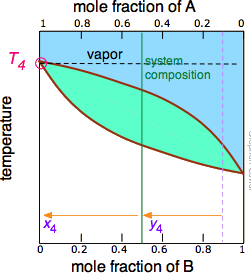
Notice that the vertical green system composition line remains in the same location in the three plots because the "system" is defined as consisting of both the liquid in the "pot" and that in the receiving container which was condensed from the vapor. The principal ideas you should take away from this are that
- distillation can never completely separate two volatile liquids;
- the composition of the vapor and thus of the condensed distillate changes continually as each drop forms, starting at y2 and ending at y4 in this example;
- if the liquid is completely boiled away, the composition of the distillate will be the same as that of the original solution.
Laboratory Distillation Setup
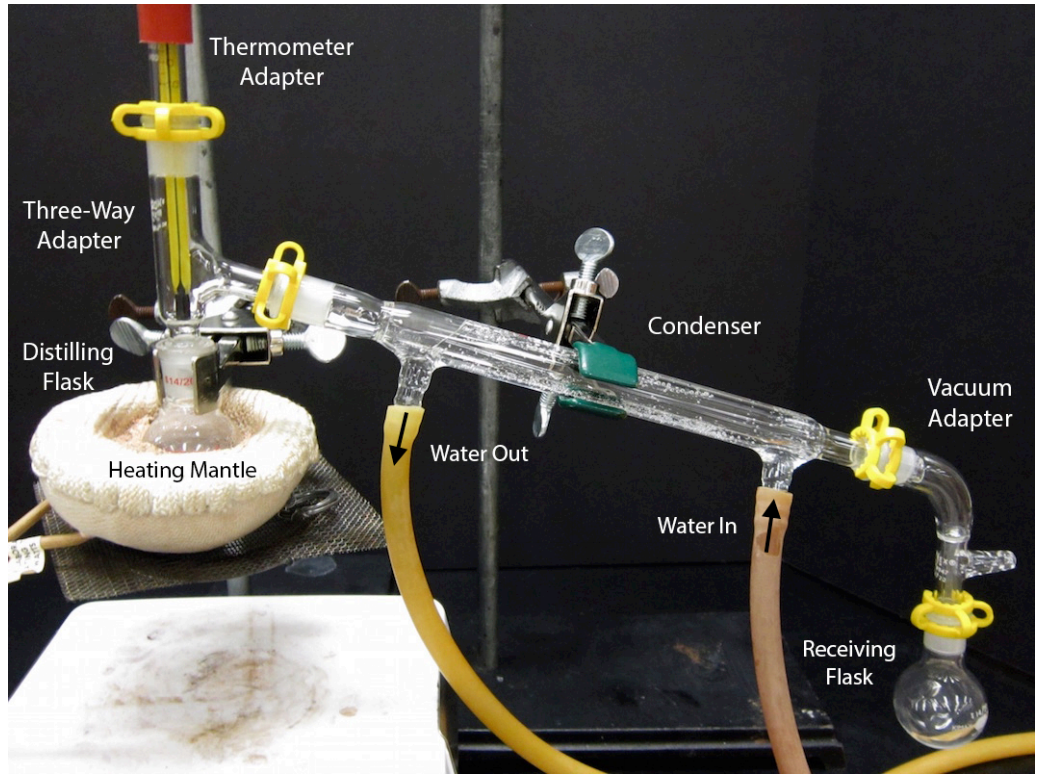
The apparatus used for a simple laboratory batch distillation is shown here. The purpose of the thermometer is to follow the progress of the distillation; as a rough rule of thumb, the distillation should be stopped when the temperature rises to about half-way between the boiling points of the two pure liquids, which should be at least 20-30 C° apart (if they are closer, then fractional distillation, described below, becomes necessary).
Fractional Distillation
Although distillation can never achieve complete separation of volatile liquids, it can in principal be carried out in such a way that any desired degree of separation can be achieved if the solution behaves ideally and one is willing to go to the trouble. The general procedure is to distill only a fraction of the liquid, the smaller the better. The condensate, now enriched in the more volatile component, is then collected and re-distilled (again, only a small fraction), thus obtaining a condensate even-more-enriched in the more volatile component. If we repeat this sequence many times, we can eventually obtain almost-pure, if minute, samples of the two components.
However, since this would hardly be practical, there is a better way. To understand it, you need to know about the lever rule, which provides a simple way of determining the relative quantities (not just the compositions) of two phases in equilibrium. The lever rule is easily derived from Raoult's and Dalton's laws, but we will simply illustrate it graphically (Figure \(\PageIndex{7}\)). The plot shows the boiling point diagram of a simple binary mixture of composition  . At the temperature corresponding to the tie line, the composition of the liquid corresponds to
 and that of the vapor to
 .
.
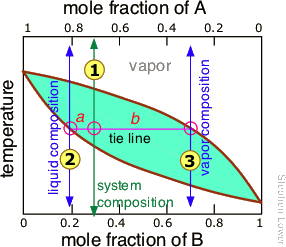
So now for the lever rule: the relative quantities of the liquid and the vapor we identified above are given by the lengths of the tie-line segments labeled a and b. Thus in this particular example, in which b is about four times longer than a, we can say that the mole ratio of vapor (of composition ![]() ) to liquid (composition
) to liquid (composition ![]() ) is 4.
) is 4.
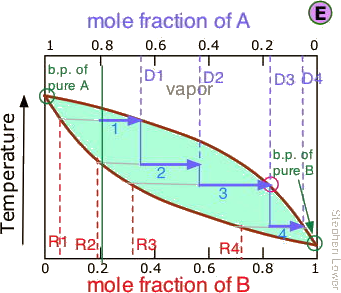
It is not practical to carry out an almost-infinite number of distillation steps to obtain nearly-infinitesimal quantities of the two pure liquids we wish to separate. So instead of collecting each drop of condensate and re-distilling it, we will distil half of the mixture in each step. Suppose you want to separate a liquid mixture composed of 20 mole-% B and 80 mole-% A, with A being the more volatile.

 As we heat the mixture whose overall composition is indicated by
  , the first vapor is formed at T0 and has the composition y0, found by extending the horizontal dashed line until it meets the vapor curve. This vapor is clearly enriched in B; if it is condensed, the resulting liquid will have a mole fraction xB approaching that of A in the original liquid. But this is only the first drop, we don't want to stop there!
 As the liquid continues to boil, the boiling temperature rises. When it reaches T1, we will have boiled away half of the liquid. At this point, the "system" composition (liquid plus vapor) is still the same (
 ), but is now equally divided between the liquid, which we call "residue" R1, and the condensed vapor, the distillate D1.
How do we know it is equally divided? We have picked T1 so that the tie line is centered on the system concentration, so by the lever rule, R1 and D1 contain equal numbers of moles.
 We now take the condensed liquid D1 having the composition
  , and distill half of it, obtaining distillate of composition D2.
 .. and then carry out yet another distillation, this time using D3 as our feedstock.
 Our four-stage fractionation has enriched the more volatile solute from 20 to slightly over 80 mole-percent in D4. The less volatile component A is most concentrated in R1. R2 through R4 are thrown away (but not down the sink, please!)
Azeotropes: the Limits of Distillation (Non-Ideal Behavior)
The boiling point diagrams discussed above apply to solutions that behave in a reasonably ideal manner — that is, to solutions that do not deviate too far from Raoult's law. As we explained above, mixtures of liquids whose intermolecular interactions are widely different do not behave ideally, and may be impossible to separate by ordinary distillation. The reason for this is that under certain conditions, the compositions of the liquid and of the vapor in equilibrium with it become identical, precluding any further separation. These cross-over points appear as "kinks" in the boiling point diagrams (Figure \(\PageIndex{10}\)).
Thus in this boiling point diagram for a mixture exhibiting a positive deviation from Raoult's law (Figure \(\PageIndex{10A}\)), successive fractionations of mixtures correspond to either  or
or  bring the distillation closer to the azeotropic composition indicated by the dashed vertical line. Once this point is reached, further distillation simply yields more of the same "high-boiling" azeotrope.
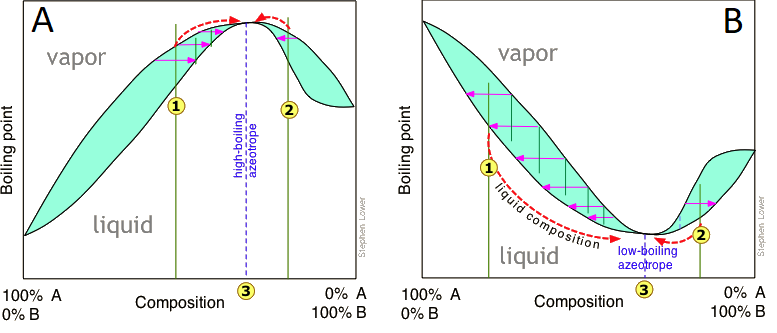
Distillation of a mixture having a negative deviation from Raoult's law leads to a similar stalemate, in this case yielding a "low-boiling" azeotrope (Figure \(\PageIndex{10B}\)). High- and low-boiling azeotropes are commonly referred to as constant-boiling mixtures, and they are more common than most people think.
| Mixture | Azeotrope |
|---|---|
| Ethanol : water | 98%, high, 78.1°C |
| Hydrochloric acid : water | 20.2% high, 108.6°C |
| Hydrofluoric acid : water | 35.6%, 111.3°C |
| Nitric acid : water | 68%, 120.5°C |
| Sulfuric acid : water | 98.3%, 338°C |
Ethanol is one of the major industrial chemicals, and is of course the essential component of beverages that have been a part of civilization throughout recorded history. Most ethanol is produced by fermentation of the starch present in food grains, or of sugars formed by the enzymatic degradation of cellulose. Because ethanol is toxic to the organisms whose enzymes mediate the fermentation process, the ethanol concentration in the fermented mixture is usually limited to about 15%. The liquid phase of the mixture is then separated and distilled.
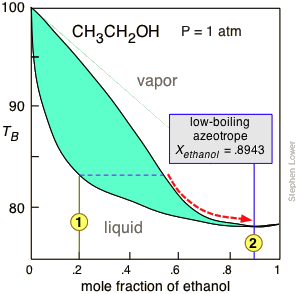
For applications requiring anhydrous ethanol ("absolute ethanol "), the most common method is the use of zeolite-based molecular sieves to absorb the remaining water. Addition of benzene can break the azeotrope, and this was the most common production method in earlier years. For certain critical uses where the purest ethanol is required, it is synthesized directly from ethylene.
How to "Break" an Azeotrope
There are four general ways of dealing with azeotropes. The first two of these are known collectively as azeotropic distillation.
- Addition of a third substance that alters the intermolecular attractions is the most common trick. The drawback is that another procedure is usually needed to remove this other substance.
- Pressure-swing distillation takes advantage of the fact that boiling point (T,X) diagrams are two-dimensional slices of a (T,X,P) diagram in which the pressure is the third variable. This means that the azeotropic composition depends on the pressure, so distillation at some pressure other than 1 atm may allow one to "jump" the azeotrope.
- Use of a molecular sieve — a porous material that selectively absorbs one of the liquids, most commonly water when the latter is present at a low concentration.
- Give up. It often happens that the azeotropic composition is sufficiently useful that it's not ordinarily worth the trouble of obtaining a more pure product. This accounts for the concentrations of many commercial chemicals such as mineral acids.
Contributors and Attributions
Stephen Lower, Professor Emeritus (Simon Fraser U.) Chem1 Virtual Textbook


