
7.2: Lab - Titrations
- Page ID
- 455760
\( \newcommand{\vecs}[1]{\overset { \scriptstyle \rightharpoonup} {\mathbf{#1}} } \)
\( \newcommand{\vecd}[1]{\overset{-\!-\!\rightharpoonup}{\vphantom{a}\smash {#1}}} \)
\( \newcommand{\dsum}{\displaystyle\sum\limits} \)
\( \newcommand{\dint}{\displaystyle\int\limits} \)
\( \newcommand{\dlim}{\displaystyle\lim\limits} \)
\( \newcommand{\id}{\mathrm{id}}\) \( \newcommand{\Span}{\mathrm{span}}\)
( \newcommand{\kernel}{\mathrm{null}\,}\) \( \newcommand{\range}{\mathrm{range}\,}\)
\( \newcommand{\RealPart}{\mathrm{Re}}\) \( \newcommand{\ImaginaryPart}{\mathrm{Im}}\)
\( \newcommand{\Argument}{\mathrm{Arg}}\) \( \newcommand{\norm}[1]{\| #1 \|}\)
\( \newcommand{\inner}[2]{\langle #1, #2 \rangle}\)
\( \newcommand{\Span}{\mathrm{span}}\)
\( \newcommand{\id}{\mathrm{id}}\)
\( \newcommand{\Span}{\mathrm{span}}\)
\( \newcommand{\kernel}{\mathrm{null}\,}\)
\( \newcommand{\range}{\mathrm{range}\,}\)
\( \newcommand{\RealPart}{\mathrm{Re}}\)
\( \newcommand{\ImaginaryPart}{\mathrm{Im}}\)
\( \newcommand{\Argument}{\mathrm{Arg}}\)
\( \newcommand{\norm}[1]{\| #1 \|}\)
\( \newcommand{\inner}[2]{\langle #1, #2 \rangle}\)
\( \newcommand{\Span}{\mathrm{span}}\) \( \newcommand{\AA}{\unicode[.8,0]{x212B}}\)
\( \newcommand{\vectorA}[1]{\vec{#1}} % arrow\)
\( \newcommand{\vectorAt}[1]{\vec{\text{#1}}} % arrow\)
\( \newcommand{\vectorB}[1]{\overset { \scriptstyle \rightharpoonup} {\mathbf{#1}} } \)
\( \newcommand{\vectorC}[1]{\textbf{#1}} \)
\( \newcommand{\vectorD}[1]{\overrightarrow{#1}} \)
\( \newcommand{\vectorDt}[1]{\overrightarrow{\text{#1}}} \)
\( \newcommand{\vectE}[1]{\overset{-\!-\!\rightharpoonup}{\vphantom{a}\smash{\mathbf {#1}}}} \)
\( \newcommand{\vecs}[1]{\overset { \scriptstyle \rightharpoonup} {\mathbf{#1}} } \)
\(\newcommand{\longvect}{\overrightarrow}\)
\( \newcommand{\vecd}[1]{\overset{-\!-\!\rightharpoonup}{\vphantom{a}\smash {#1}}} \)
\(\newcommand{\avec}{\mathbf a}\) \(\newcommand{\bvec}{\mathbf b}\) \(\newcommand{\cvec}{\mathbf c}\) \(\newcommand{\dvec}{\mathbf d}\) \(\newcommand{\dtil}{\widetilde{\mathbf d}}\) \(\newcommand{\evec}{\mathbf e}\) \(\newcommand{\fvec}{\mathbf f}\) \(\newcommand{\nvec}{\mathbf n}\) \(\newcommand{\pvec}{\mathbf p}\) \(\newcommand{\qvec}{\mathbf q}\) \(\newcommand{\svec}{\mathbf s}\) \(\newcommand{\tvec}{\mathbf t}\) \(\newcommand{\uvec}{\mathbf u}\) \(\newcommand{\vvec}{\mathbf v}\) \(\newcommand{\wvec}{\mathbf w}\) \(\newcommand{\xvec}{\mathbf x}\) \(\newcommand{\yvec}{\mathbf y}\) \(\newcommand{\zvec}{\mathbf z}\) \(\newcommand{\rvec}{\mathbf r}\) \(\newcommand{\mvec}{\mathbf m}\) \(\newcommand{\zerovec}{\mathbf 0}\) \(\newcommand{\onevec}{\mathbf 1}\) \(\newcommand{\real}{\mathbb R}\) \(\newcommand{\twovec}[2]{\left[\begin{array}{r}#1 \\ #2 \end{array}\right]}\) \(\newcommand{\ctwovec}[2]{\left[\begin{array}{c}#1 \\ #2 \end{array}\right]}\) \(\newcommand{\threevec}[3]{\left[\begin{array}{r}#1 \\ #2 \\ #3 \end{array}\right]}\) \(\newcommand{\cthreevec}[3]{\left[\begin{array}{c}#1 \\ #2 \\ #3 \end{array}\right]}\) \(\newcommand{\fourvec}[4]{\left[\begin{array}{r}#1 \\ #2 \\ #3 \\ #4 \end{array}\right]}\) \(\newcommand{\cfourvec}[4]{\left[\begin{array}{c}#1 \\ #2 \\ #3 \\ #4 \end{array}\right]}\) \(\newcommand{\fivevec}[5]{\left[\begin{array}{r}#1 \\ #2 \\ #3 \\ #4 \\ #5 \\ \end{array}\right]}\) \(\newcommand{\cfivevec}[5]{\left[\begin{array}{c}#1 \\ #2 \\ #3 \\ #4 \\ #5 \\ \end{array}\right]}\) \(\newcommand{\mattwo}[4]{\left[\begin{array}{rr}#1 \amp #2 \\ #3 \amp #4 \\ \end{array}\right]}\) \(\newcommand{\laspan}[1]{\text{Span}\{#1\}}\) \(\newcommand{\bcal}{\cal B}\) \(\newcommand{\ccal}{\cal C}\) \(\newcommand{\scal}{\cal S}\) \(\newcommand{\wcal}{\cal W}\) \(\newcommand{\ecal}{\cal E}\) \(\newcommand{\coords}[2]{\left\{#1\right\}_{#2}}\) \(\newcommand{\gray}[1]{\color{gray}{#1}}\) \(\newcommand{\lgray}[1]{\color{lightgray}{#1}}\) \(\newcommand{\rank}{\operatorname{rank}}\) \(\newcommand{\row}{\text{Row}}\) \(\newcommand{\col}{\text{Col}}\) \(\renewcommand{\row}{\text{Row}}\) \(\newcommand{\nul}{\text{Nul}}\) \(\newcommand{\var}{\text{Var}}\) \(\newcommand{\corr}{\text{corr}}\) \(\newcommand{\len}[1]{\left|#1\right|}\) \(\newcommand{\bbar}{\overline{\bvec}}\) \(\newcommand{\bhat}{\widehat{\bvec}}\) \(\newcommand{\bperp}{\bvec^\perp}\) \(\newcommand{\xhat}{\widehat{\xvec}}\) \(\newcommand{\vhat}{\widehat{\vvec}}\) \(\newcommand{\uhat}{\widehat{\uvec}}\) \(\newcommand{\what}{\widehat{\wvec}}\) \(\newcommand{\Sighat}{\widehat{\Sigma}}\) \(\newcommand{\lt}{<}\) \(\newcommand{\gt}{>}\) \(\newcommand{\amp}{&}\) \(\definecolor{fillinmathshade}{gray}{0.9}\)
Learning Objectives
Goals:
- Understand that parts of an acid-base titration
- be able to determine the Ka or Kb from pH data associated with the titration of a weak acid or base
- be able to determine the molar mass of a solid monoprotic acid from titration data
- be able to calculate Ka1 and Ka2 for a polyprotic acid
By the end of this lab, students should be able to:
- design, develop and perform acid base titrations .
Prior knowledge:
- Graphing
- Stoichiometry of Acid-Base Titrations in quantitative analysis (section 4.7.2)
Concurrent Reading & Additional Resources
- pH and pOH (section 16.2)
- pH of Weak Acids and Bases (section 16.3, 16.5.4 and 16.5.5)
- pH of salts (sections 16.4, 16.5.6 and 16.5.7)
- buffers (section 17.2)
Safety
- Emergency Preparedness
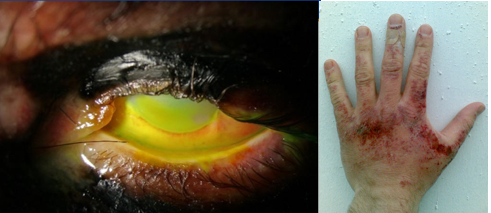
- Eye protection is mandatory in this lab, and you should not wear shorts or open toed shoes.
The following image shows the damage 4 M sodium hydroxide can cause. By following proper procedures and using proper PPE (Personal Protective Equipment) the risk to damage can be reduced to near zero. There are two primary factors that determine the extent of injury due to exposure to corrosive chemicals like NaOH, the concentration of the chemical and the time of contact (exposure to the chemical). For this reason we do not perform titrations with concentrated acids and bases, but dilute ones. If you ever have an acid or base spill you need to immediately inform your instructor, who will clean it up or instruct you on what to do. If you spill it on your body you should immediately wash it off with copious amounts of water.
-
- Sodium hydroxide
- Acetic Acid
- Minimize Risk
- Check the cord on the hotplate, inform the instructor if it is frayed.
- Make sure the electrical cord never touches the surface of the hotplate
- label all containers
- Recognize Hazards
- Sodium Hydroxide PubChem LCSS
- Acetic Acid PubChem LCSS
- All solutions should be considered harmful and care should be taken to avoid contact with your skin or other body tissues.
- In event of contact with reagents you should flush contacted area with water and notify instructor immediately.
- All waste is placed in the labeled container in the hood and will be recycled when the lab is over. Contact your instructor if the waste container is full, or about full.
Equipment and materials needed
| 1 50mL Burette | pH meter | 150 ml beaker |
| 0.100 M NaOH | 0.1M acetic acid | unknown solid acid |
| unknown diprotic acid | phenolphthalein indicator | Ring stand and clamp |
| 25 mL pipet | magnetic stirrer & bar | pH 4, 7 & 10 buffers |
Background
Indicator Titrations
The next several labs will involve laboratory techniques that take into account the equilibrium chemistry associated with the stoichiometry of chemical reactions. The first will involve titrations of acid base reactions that may include the equilibria of weak acids or bases and the second will deal with the formation of complex ions. The stoichiometry of acid base titrations were introduced in the first semester (section 4.7) as an analytical technique to determine the concentration of an unknown (analyte) by adding a standard of known concentration (titrant) until they were in stoichiometric proportions (the equivalence point). At the equivalence point the analyte has been neutralized and converted to its salt (conjugate form). The volume of titrant required to neutralize the analyte could be quickly determined through the use of an appropriate indicator, where titrant was added until the solution changed color, which was at a volume known as the endpoint of the titration. For this to work the pH at which an indicator changes color must be the same as that of the salt of the analyte being neutralized. The analyte may be weak or strong, but the titrant must be strong and typically is monoprotic. Figure \(\PageIndex{2}\) shows the experimental setup for an indicator based titration
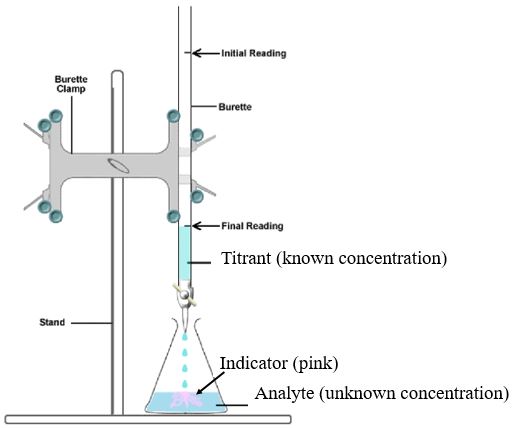
Figure \(\PageIndex{6}\) of the experimental section is a chart of the colors and pHs various indicators change at and it is important that you pick an appropriate indicator based on the acidity or basicity of the neutralized analyte. If the analyte is a strong acid or base the indicator should change color around a pH of 7. If the analyte is a weak acid the indicator should change color in a basic solution, and if it is a weak base it should change color in an acidic solution. The calculations for determining this are in the expermintal section of this lab.
pH Titrations
In a pH titration you measure the pH as a function of the volume of titrant added and determine the equivalence point as the point in where there is an inflection in the slope of the curve. Figure \(\PageIndex{2}\) shows the four common types of titrations. Initially the pH is that of the pure analyte. Before the equivalence point the titrant is neutralizing the analyte and converting it to its salt, but since there is an excess of the analyte it is not completely consumed and so a buffer is formed, which is a mixture of the analyte and its salt. As the equivalence point is approached the pH changes rapidly as the analyte is being consumed and so there is nothing to react with the titrant (which must be a strong acid or base) and after the equivalence point the pH stabilizes as it is effectively determined by the pure titrant, which is both strong and in excess, and a change is only due to dilution. Lets look at two examples
- Titration of Acetic Acid with Sodium hydroxide (analagous to figure \(\PageIndex{3}\)c. Initially the pH is due to pure acetic acid . As sodium hydroxide is added it reacts with the acetic acid forming its conjugate base, the salt sodium acetate. This is an acetic acid/acetate buffer and the pH is determined by the ratio of the un-neutralized to neutralized acetic acid.
\[C_2H_3O_2(aq) + NaOH(aq) \rightarrow NaC_2H_3O_2(aq) + H_2O(l) \]
At the equivalence point all the acetic acid has been neutralized and converted to its conjugate base acetate, so the pH is determined by the concentration of its salt, sodium acetate. After the equivalence point there is no more acetic acid to react with the sodium hydroxide and so it accumulates, with the pH being dictated by the amount of excess sodium hydroxide. - Titration of Ammonia with Hydrochloric Acid (analagous to figure \(\PageIndex{3}\)d. Initially the pH is due to pure ammonia As HCl is added it reacts with the ammonia forming its salt, ammonium chloride. This is an ammonia/ammonium buffer and the pH is determined by the ratio of the un-neutralized to neutralized ammonia.
\[NH_3(aq) + HCl(aq) \rightarrow NH_4Cl(aq) \]
At the equivalence point all the ammonia has been neutralized and converted to its conjugate acid ammonium, and so the pH is dictated by the concentration of the ammonium chloride salt. After the equivalence point there is no more ammonia to react with the HCl and so it accumulates and the pH is dictated by the excess HCl.
 Figure \(\PageIndex{3}\): Titration curves for (a) strong acid with strong base and (b) strong base with strong acid.
Equivalence Point Determination
A closer look at figure \(\PageIndex{3}\) indicates that the steepest part of the titration curve is the equivalence point and that there is an inflection in the slope of the line as the solution goes from excess analyte to excess titrant. Lets look at parts (a) and (c) of figure \(\PageIndex{3}\). As you approach the equivalence point the slope increases and then after the equivalence it decreases. This can be shown with a first derivative plot of the curve as in figure \(\PageIndex{4}\) \(\left ( lim \;\Delta V \to 0 \; \frac{\Delta pH}{\Delta V} \right )\) . What is clear in the first derivative plot is that the line is going higher and higher and then reverses direction and goes lower and lower. The point where it changes from increasing to decreasing is the inflection point, and this can identified where the second derivative plot goes through zero \(\left ( lim \;\Delta V \to 0 \; \frac{\Delta^2 pH}{\Delta V^2} \right )\) . Note, if there is noise in your data over the flat portion of the curve you will have a lot of false inflection points and so you do not need to take the second derivitive plot over all the data, just in the region around the equivalence point

Titration of a weak monoprotic acid.
Figure \(\PageIndex{4}\) shows the four "regions" of the titration curve for the titration of a weak acid with a strong base. It should be noted that region two is a buffer because there is excess acid (analyte) and so only part of it been neutralized by the base and converted to it's salt (the acid's conjugate base). This is one of the two ways to make a buffer (see section 17.2.3).
Weak Acid + Strong Base -> Salt +Water
where the salt is the conjugate base of the acid.
The four parts of the titration curve are described below and you should look to the approriate text section to see how they are treated.
- Pure Acid (0 ml of base is added, section 17.3.2.1)
- Excess acid (you have not added enough base to neutralize all of it and so have a buffer of the weak acid and it's salt, section 17.3.2.2)
- Ka can be calculated from the pH at half equivalence (section 17.3.2.2.1)
- Equivalence Point (the acid and base are in stoichiometric proportions and you effectively have the salt of the weak acid, section 17.3.2.3)
- The acid and base are in 1 to 1 ratio at the equivalence point and so the initial moles acid can be calculated from the moles base at this point (nA=nB and nB=MBVB)
- If the acid was a solution you can determine its molarity from he volume titrated.
- If the acid was a solid you can determine its molar mass from the mass titrated.
- The acid and base are in 1 to 1 ratio at the equivalence point and so the initial moles acid can be calculated from the moles base at this point (nA=nB and nB=MBVB)
- Excess Base (you have added more base than there was acid, section 17.3.2.4)
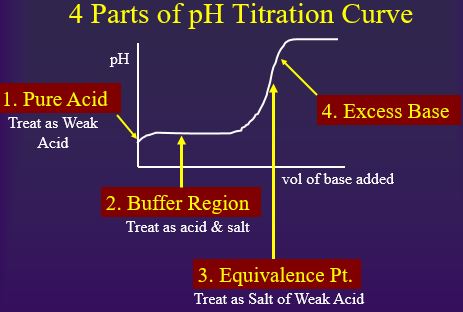
Figure \(\PageIndex{5}\): Four parts of the titration curve for a weak acid being titrated with a strong base. Notice that two parts are points (1 & 3) and two parts are regions (2 & 4).
Be sure to go over the four parts of the titration curve in section 17.3.2 as that material is not being repeated here. If you are titrating a weak base with a strong acid you should go over section 17.3.4
Titration of Weak Diprotic Acid
A diprotic acid has two titratable protons and if Ka1>1000Ka2 there are two clearly defined equivalence points.
Determination of Ka
Ka can be determined by reading the pH at half equivalence (when half of the acid has been neutralized and converted to its salt). This is in the buffer region and uses the Henderson Hasselbach equation
\[pH=pK_a+\log \dfrac{[A^-]}{HA}\]
Since at half equivalence [HA]=[A-] pH = pKa , at half equivalence
so
\[K_a =10^{-pH\text{, at half equivalence}} \]
So you find the equivalent point on the titration curve and read the value of the curve at half of that volume. For this reason you need to collect data half way along the curve (red circle).
pH Probes
In this experiment we will use a Ph probe, which is an electronic device that measures the pH. These are very common and they should always be checked against standard solutions of known pH and calibrated if they read incorrectly. The pH probe is an electrochemical cell and we will cover these in chapter 19, sections 19.3-19.5 and 19.7. The following YouTube from Oxford Press does an excellent job of describing how a pH probe works. It is imperative that you test your probe in a buffer to be sure it is reading accurately and if it is not, you will need to calibrate it.
Video \(\PageIndex{1}\) 2:30 YouTuve describing the operation of a pH probe developed by Oxford University Press (https://youtu.be/aIn4D2QXUy4).
The pH reading is not accurate until the probe stabilizes, so when you change the pH you need to wait until the reading becomes steady before recording the value.
Exploratory Run
Before running a pH titration you should make a trial run with an indicator (section 17.3.4.2), which is a chemical that undergoes a color change at a specific pH. You want an indicator that indicates when the titrant and analyte have been added in stoichiometric proportions, (the equivalence point), which is when the analyte has been converted to its salt. From section 17.3.3.2 we see that for the titration of a weak acid
\[[OH^-]=\sqrt{\left (\frac{K_w}{K_a} \right )[A^-]_e} \]
where Kw=water ionization constant (10-14), Ka=acid ionization constant and [A-e]=the salt concentration at the equivalence point (when all the acid is neutralized).
So \[pOH =-log\sqrt{\left (\frac{K_w}{K_a} \right )[A^-]_e} \]
and \[pH=14-pOH=14+ \sqrt{\left (\frac{K_w}{K_a} \right )[A^-]_e} \]
In the first experiment we are neutralizing 25.00 mL of 0.100M acetic acid with 0.100M NaOH, and so when 25.00 mL of NaOH has been added all the acetic acid will be converted to acetate ions, but the volume has doubled and so the concentration is now 0.05M A-. This gives a pH of
\[pH=14-pOH=14+ \sqrt{\left (\frac{10^{-14}}{1.8x10^{-5}} \right )[0.05M]_e}= 8.72\]
From figure \(\PageIndex{4}\) we see that phenolphthalein would be a good indicator for a weak acid like acetic acid as it is clear up until just below a pH of 9, when it turns pink.

That is, you want an indicator that changes color at the pH of the salt of the acid or base that you are titrating, and that way you can tell when you have completely neutralized it.
Experimental Procedures
Before running a pH titration we are going to make a quick exploratory run with an indicator. The endpoint of an indicator titration is when the indicator changes color and if we choose an indicator that changes color at the pH of the salt of the analyte, it gives us a bearing on the equivalence point, which is when that analyte and titrant have been added in stoichiometric proportions (moles acid = moles base for monoprotic acid being titrated with a monoprotic base). You will then use the results of the exploratory run to design the pH titration.
Designing the pH titration
The challenge is that the pH probes are old and it takes a while for their readings to stabilize. If you do not let the reading stabilize there will be a lot of noise in your data.
 Figure \(\PageIndex{7}\): Dots represent pH readings. (Copyright; Belford CC-BY)
The goal of the exploratory run is to figure out where the equivalence point is. You then need to record data dropwise for about 3/4 a mL before and after the endpoint and collect data around half equivalence. You need to be sure to record the inital pH (pure acid) and extend your data at least 5 mL beyond the equivalence point.
Tips on getting good data
If you look at YouTube you will see many titrations where people are creating a vortex with magnetic stirrers. This can increase the rate at which gasses dissolve and there are a class of non-metal oxides called the acid anhydrides that form acids when they combine with water. The carbon dioxide you exhale is an acid anhydride and the following youtube shows what happens if you breath over a beaker that is rapidly being stirred.
Video \(\PageIndex{2}\): 1:10 minute video showing effect of cavitation and breathing on a slightly basic solution (https://youtu.be/4RiftqpXI8c, Belford)
In the above video a slightly basic solution with phenolphthalein indicator is pink. If you listen carefully you can hear someone breathing above it and due to the vortex the carbon dioxide they exhale reacts with the water to form carbonic acid and the solution turns clear.
\[CO_2(g) +H_2O(l) \leftrightharpoons H_2CO_3(aq)\]
Exploratory Run
The goal of the exploratory run is to give you a feeling for the volume of actual titrant you will need to neutralize 25 mL of your analyte. Using a volumetric pipette 25 mL of acetic acid and a few drops of phenolphthalein were added to the Erlenmeyer flask. Then it was titrated with 0.1M NaOH and the volume of NaOH needed to neutralize the acetic acid was quickly determined. This video shows how to quickly do this, and we are not using this to measure the concentration, but to get a quick bearing on how to design the pH titration.
Video \(\PageIndex{3}\): 2:01 minute video showing a quick exploratory run with an indicator. Note how as the titration proceeds the color takes longer to disappear as the solution approaches the end point.
pH Run
In this experiment we will hook up the Vernier pH probe to a $35 Raspberry Pi microcomputer that transmits the data to your Google Sheet in real time. We will run two python programs on the Raspberry Pi. The first program we will run from the command line and it gives you the pH readings every 10 seconds, and you use this to decide when to upload data to your Google Sheet. The second program you will run from the Thonny IDE (Interactive Development Environment), and this program will allow you to input your volumes and pH to your Google Sheet. These programs were developed during the COVID pandemic to allow instructors to stream data to students in real time, and we have decided to let students use them directly, as data science skills are important for today's students to learn. Further information may be obtained in the Internet of Science Things course at UALR. Please do not get water on the Raspberry Pis as you will kill them.
 Figure \(\PageIndex{8}\): Raspberry Pi in "Desktop mode" hooked up to a pH probe. Note, this Pi is also hooked up to a breadboard (Copyright; Bob Belford, CC-BY)
COVID 19 Protocols
The second reason we have decided to use the Raspberry Pis is that we feel the lab can be run safer in a pandemic than using the normal equipment. We ask students to take up roles for each experiment, and change the roles when they perform different titrations. Note, at the discretion of your instructor these roles may be modified by the number of people in your group. Each group will have two stations on opposite sides of the bench. On one side is the Raspberry Pi, keyboard and monitor, and on the other side is the titration setup. All students need to work together, make sure the lab is run safely and that you get the best data possible.
- Titrator. Only one person handles the buret (opens and closes the stopcock).
- burette reader. This person assists the titrator and reads the volume. This may be the person running the titration.
- Titration supervisor. This person coordinates with the titrator and burette reader to determine the approriate volumes for when they should make a measurement and for communicating with the data supervisor.
- Pi operator. This is the only person who touches the keyboard and mouse. This person runs the python programs.
- Data supervisor. This person assists the pi operator in determining when the pH is stable enough to upload to the Google Sheet, and is responsible for communicating with the titration supervisor.
IOT Enhanced Titration
The following image shows the setup for the titration lab. Note this Raspberry Pi is being run in "headless mode" through VNC viewer and connected to a laptop. Your Pi may be run in desktop mode, where it is connected to a monitor and keyboard. Note the tip of the pH probe is submerged and magnetic stirrer is set where it is under the burette and does not touch the probe as it spins. A gentle spin is all you need.
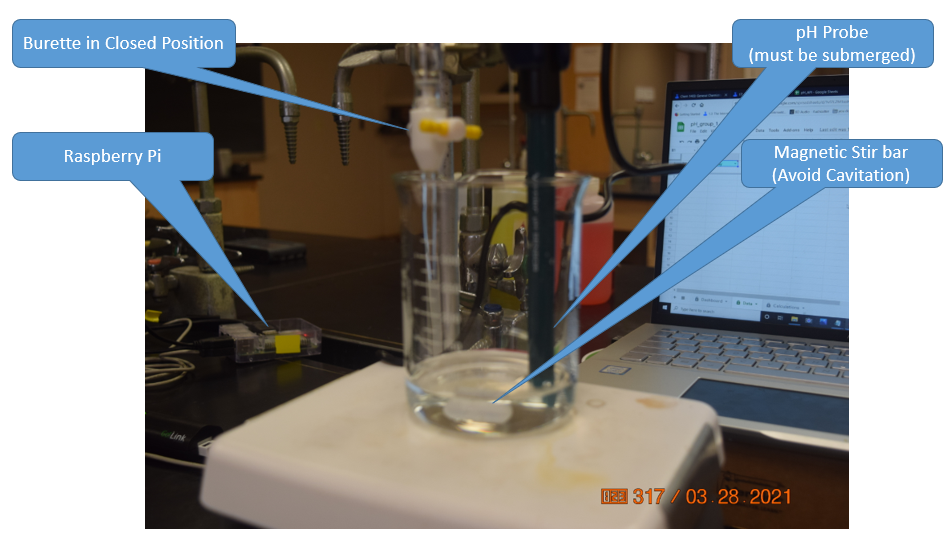
Be sure to add enough water to submerge the pH probe and take the dilution effect of this water into account when determining the initial concentration of the acid.
The following image shows all the programs on the desktop of a Raspberry Pi (remotely accessed via VNC viewer). Step (1) of the blue commands show you how to run the "current pH" program in command line, where (2) shows the display with the values being streamed every 10 seconds. The green tabs show how to activate and run the progam that sends data to the Google Sheet (ph_Venier_sheets.py). (1) Open the folder pH_lab on the desktop and then (2) clicking the python program pH_Veneir_sheets.py opens that program in the Thonny. The shell of Thonny (3) allows you to input the volume in mL (do not include units) and when you hit <enter> that volume and the current pH are uploaded to the Google Sheet. You need to use both progams concurrently.
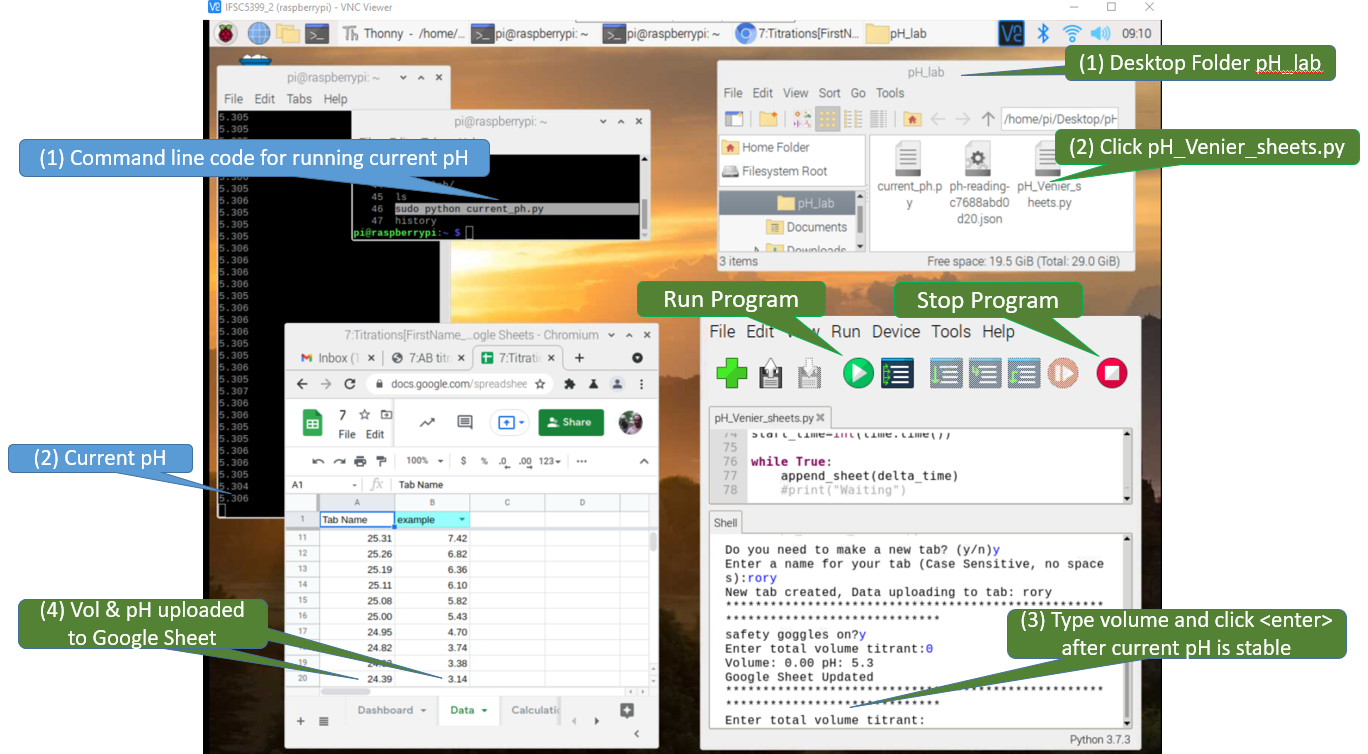 Figure \(\PageIndex{10}\): The Raspberry Pi Desktop is being overlaid a Google sheet by the VNC Vierwer in this screen capture. There are two Python programs being run, one in command line and one in the Thonny IDE (Interactive Development Environment). The white text on the black background is the program being run in command line and every 10 seconds it displays the current pH. The program in Thonny is running a program "PH_Vernier_sheets_append", which allows a user to enter the volume and when the hit <Enter> it takes that volume and pH and appends it to the Google Sheet in the foreground. (Bob Belford, CC-BY)
Stepwise procedures
- Add titrant
- Record the new volume of titrant added to analyte in Thonny Shell (running pH_Venier_sheets.py)
- Observe pH in command line (running current_pH.py)
- When pH is stable, hit <enter> on Thonny
- repeat above steps with a new volume of titrant
Note, you do not need to run the Google Sheet, but it would be nice to be sure your data is being uploaded (everytime you hit enter on Thonny your sheet should be updated). You can also run the Google Sheet on a separate laptop.
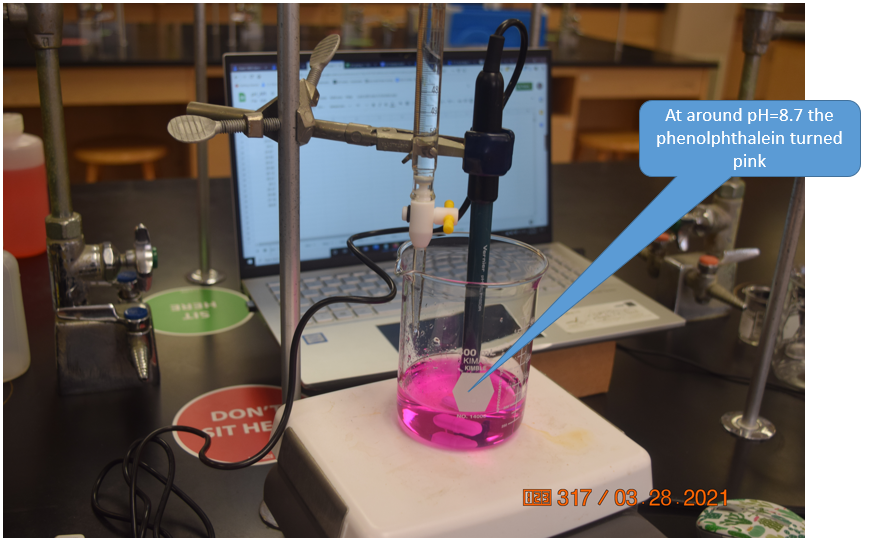 Figure \(\PageIndex{11}\): At around pH=8.7 the indicator turned pink, and the titration was continued for another 5 mL into the excess base region. As there was only one person in the lab we ignored the COVID-19 seating assignments, but if students attend labs they need to sit where the green stickers are (Belford, cc 3.0)
Printable Instructions
Experiments
Experiment 1: Weak Acid
- Perform Exploratory Run (watch video first)
- Using a volumetric pipette transfer 25 mL 0.1M Acetic Acid to a 250 mL Erlenmeyer flask
- Add a few drops of phenolphthalein
- Attach burette to a ring stand and fill with 0.1 M NaOH
- Titrate to endpoint when solution turns pink and use this value when decided what volumes to take data at in the pH titration
- Check if sensor is calibrated in buffer solution.
- Place probe in buffer solution
- In command line (The black box to the left of screen) you will see
- Sudo python /home/Desktop/pH_lab/current_ph.py
- First time running it will sometime get error, just hit up arrow on keyboard then enter
- If you need to calibrate then plug the probe into the lab quest and calibrate as normal
- After calibrating before pressing ok, go to storage tab
- Select save calibration to sensor, then press ok twice when prompted
- Setting Up pH Titration
- Using a volumetric pipette transfer 25 mL 0.1M Acetic Acid to a 500 mL beaker.
- Add 50 mL water to make sure the pH probe will be fully submerged. If not, add more water and record total volume of water added
- Add a few drops of phenolphthalein
- Set up titration station like the demo station in the lab.
- Make sure heat is OFF.
- Carefully transfer 0.100 M NaOH to the burette
- Gently turn on the magnetic stirrer and make sure it does not hit the sides of the beaker or the probe.
- Obtain initial pH using program in Thonny editor
- Press Green play button to start
- Enter y to make your group's tab
- Enter a name for your group
- Look at the black box (current ph reading) and wait for the numbers to stabilize
- When ready Enter volume of titrant (first will be zero) then press enter
- Run Titration
- Add appropriate amount of base (see image on back side of handout)
- Record total volume base added in the Thonny shell (do not hit enter)
- Observe the pH in command line and when it is stable, click enter in Thonny shell
- Repeat above steps adding the next increment of base, while recording the total amount of base added in the Thonny shell.
- Be sure to collect data at least 5 mL beyond the equivalence point
- Check data on the data tab of lab report copy
Experiment 2: Solid Acid
- Perform Exploratory Run
- Weigh around 0.5 grams of unknown acid.
- Transfer acid to 500 mL beaker.
- Add around 50 mL of water to beaker and dissolve solid acid
- Add a few drops of phenolphthalein
- Attach burette to a ring stand and fill with 0.1 M NaOH
- Titrate to the endpoint when the solution turns pink and use this value to design the pH titration and choose volumes to take data at.
- Check if pH probe is calibrated in buffer solution
- Place probe in buffer solution
- In command line (The black box to the left of screen) you will see
- Sudo python /home/Desktop/pH_lab/current_ph.py
- First time running it will sometime get error, just hit up arrow on keyboard then enter
- If you need to calibrate then plug the probe into the lab quest and calibrate as normal
- After calibrating before pressing ok, go to storage tab
- Select save calibration to sensor, then press ok twice when prompted
- Reattach pH probe to Raspberry Pi via Go!Link
- Setting Up pH Titration
- Set up a titration station like the demo station in the lab.
- Weigh around 0.5 grams of unknown acid and record value to the precision of the balance on data sheet
- Add 50 mL water and make sure the pH probe tip is fully submerged. If not, add more water.
- Add a few drops of phenolphthalein
- Make sure heat is OFF.
- Carefully transfer 0.100 M NaOH to the burette
- Turn on the magnetic stirrer and make sure it does not hit the sides of the beaker or the probe. Avoid cavitation
- Obtain initial pH using program in Thonny editor
- Press Green play button to start
- Enter y to make your group's tab
- Enter a name for your group
- Look at the black box (current ph reading) and wait for the numbers to stabilize
- When ready Enter volume of titrant (first will be zero) then press enter
- Run Titration
- Add appropriate amount of base (see image on back side of handout)
- Record total volume base added in the Thonny shell (do not hit enter)
- Observe the pH in command line and when it is stable, click enter in Thonny shell
- Repeat above steps adding the next increment of base, while recording the total amount of base added in the Thonny shell.
- Be sure to collect data at least 5 mL beyond the equivalence point
- Check data on the data tab of lab report copy
Experiment 3: Diprotic Acid
The challenge with the drop counter is to set the flow rate slow enough so that the pH readings stabilize between drops. The burette has two valves, the top one to adjust the flow rate and the bottom one to turn on/off the device. Before calibrating the drop counter you need to adjust the flow rate by filling the burette with about 40 mL of water,
- Adjust Flow Rate
- Open bottom valve and close top valve of burette and place on stand.
- place 100 mL beaker under burette.
- Add around 40 mL water to burrette
- Slowly open top valve until a drop falls every 2 to 4 second.
- When desired rate is achieved close bottom valve.
Video \(\PageIndex{4}\):
- Calibrate Drop Counter
- Place 10 mL graduated cylinder under burette
- Align drop detector so drops break cross IR beam path as they fall from burette to graduated cylinder
- Click red section of LabQuest
- Choose calibrate
- Choose calibrate now
- Open valve and the counter should increment one value every time a drop falls.
- After you have around 9 mL you can stop the calibration and the device will know record the volume of each drop
 Figure \(\PageIndex{12}\): experimental setup (left). (Copyright; Bob Belford & Liliane Poirot CC-BY)
- Titration
- Set up calibrated drop counter and burette over a 500 mL beaker containing 50 mL of water
- Connect pH sensor to LabQuest Analog port, it should read the pH
- Connect drop counter to LabQuest Digital port, it should read zero volume
 Figure \(\PageIndex{13}\): LabQuest auto detects the pH probe and the digital counter. (Copyright; Belford & Poriot CC0)
- Add magnetic stirrer, set up to a slow stir rate and make sure it does not hit the probe
- Add 15 mL of the diprotic acid to a 500 mL beaker
- Submerge pH probe into solution, add water if probe not submerged
- start the titration
- Switch to graphing mode so you can observe the titration curve grow in real time.
- complete for about 5 mL in the excess base region after the second equivalence point (there should be two buffer regions, do not mistake the second buffer for being excess base.
Data Analysis
Accessing your Data
The program on the raspberry pi automatically sends the data to your instructor, which is then sent to your copy of the workbook template. Make your copy of the template from the 7.3 Titrations Lab Report and rename the title to be your name.
Navigate to the data tab and click the drop down in cell B1 to find your group. (The name you chose when starting the program) Next click the #REF in cell A2 and select Allow access. Now you should automatically see your groups data.
If you do not see your group's name ask the instructor to refresh the Index
Highlight the cells you want to copy then go to the tab you want to use. You want to paste values only so you can use Ctrl+Shift+V or right click and select Paste Values Only.
Week 1
Titration Curve
First make your titration curve (First image of Figure 7.2.4, pH Vs. V)
Tip: When selecting the range you can select the entire column instead of individual cells, this will make your life much easier when it comes to week 2 (Example use A:B as range instead of A3:B50)
Follow the standards set in the Graphing Lab for your graphs, making sure you have all labels and etc.
Note: Does a titration curve need a line of best fit or formula? What does a line of best fit do and does that apply to this chart?
First Derivative
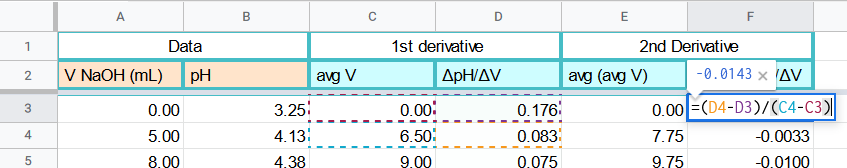
In cell D we want to calculate the slope between each set of two data points
\[ \frac{\Delta pH}{\Delta V}=\frac{pH_{2}-pH_{1}}{V_{2}-V_{1}}\]
This can be done in google sheets using formulas

Average V
Since we used two data points to calculate the slope, we now need the average volume between those two points.
=AVERAGE(A3:A4)
Second Derivative
The second derivative will follow the exact same steps as the first derivative. We now want to calculate the slope between each set of two data points form the first derivative. You will use the same formula but now applying it to the 1st derivative values
This can be done in google sheets using formulas
Average V
Since we used two data points to calculate the slope, we now need the average volume between those two points.
=AVERAGE(C3:C4)
Before making your graphs scroll to the bottom of your data. Check the last rows of data points. Are all of your formulas using data or are some using empty rows? Delete any cells where the number is not valid. (You should end up with less rows of data points for each derivative)
Finding Ka
Use the first and second derivative to find your equivalence point. (Note not the point observed in lab) Enter the volume of base added at that point in your WA Calculations tab
Use that value to determine your half equivalence point
Find the pH value at your half equivalence point. Use this value to determine your pKa. Then solve for your Ka value.
Week 2
First and Second Derivative
Now if you were so determined you could repeat all of the steps from week one to create your first and second derivative graphs. But since we are using google sheets we can make our lives much easier. You can right click your tab for WADerivatives and select duplicate. Now just rename your tab and enter in this weeks data. The number of rows most likely will not match so you may have to adjust your formulas (deleting or extending the formulas)
Remember that each derivative should have one less data point!
If you made the range for the charts the entire column it should automatically update the chart for your new data.
Finding Molar Mass
Use the definition of equivalence point to determine the number of mols of our acid in solution. You will need the molarity of your titrant to do so. Then use your mass of the unknown that you weighed in the lab and the mols of acid to determine the molar mass. (If you are stuck take a look at the units!)
Finding Ka
The steps of finding Ka are the same as last week