
4: Kinetics Part 1
- Page ID
- 303093
\( \newcommand{\vecs}[1]{\overset { \scriptstyle \rightharpoonup} {\mathbf{#1}} } \)
\( \newcommand{\vecd}[1]{\overset{-\!-\!\rightharpoonup}{\vphantom{a}\smash {#1}}} \)
\( \newcommand{\dsum}{\displaystyle\sum\limits} \)
\( \newcommand{\dint}{\displaystyle\int\limits} \)
\( \newcommand{\dlim}{\displaystyle\lim\limits} \)
\( \newcommand{\id}{\mathrm{id}}\) \( \newcommand{\Span}{\mathrm{span}}\)
( \newcommand{\kernel}{\mathrm{null}\,}\) \( \newcommand{\range}{\mathrm{range}\,}\)
\( \newcommand{\RealPart}{\mathrm{Re}}\) \( \newcommand{\ImaginaryPart}{\mathrm{Im}}\)
\( \newcommand{\Argument}{\mathrm{Arg}}\) \( \newcommand{\norm}[1]{\| #1 \|}\)
\( \newcommand{\inner}[2]{\langle #1, #2 \rangle}\)
\( \newcommand{\Span}{\mathrm{span}}\)
\( \newcommand{\id}{\mathrm{id}}\)
\( \newcommand{\Span}{\mathrm{span}}\)
\( \newcommand{\kernel}{\mathrm{null}\,}\)
\( \newcommand{\range}{\mathrm{range}\,}\)
\( \newcommand{\RealPart}{\mathrm{Re}}\)
\( \newcommand{\ImaginaryPart}{\mathrm{Im}}\)
\( \newcommand{\Argument}{\mathrm{Arg}}\)
\( \newcommand{\norm}[1]{\| #1 \|}\)
\( \newcommand{\inner}[2]{\langle #1, #2 \rangle}\)
\( \newcommand{\Span}{\mathrm{span}}\) \( \newcommand{\AA}{\unicode[.8,0]{x212B}}\)
\( \newcommand{\vectorA}[1]{\vec{#1}} % arrow\)
\( \newcommand{\vectorAt}[1]{\vec{\text{#1}}} % arrow\)
\( \newcommand{\vectorB}[1]{\overset { \scriptstyle \rightharpoonup} {\mathbf{#1}} } \)
\( \newcommand{\vectorC}[1]{\textbf{#1}} \)
\( \newcommand{\vectorD}[1]{\overrightarrow{#1}} \)
\( \newcommand{\vectorDt}[1]{\overrightarrow{\text{#1}}} \)
\( \newcommand{\vectE}[1]{\overset{-\!-\!\rightharpoonup}{\vphantom{a}\smash{\mathbf {#1}}}} \)
\( \newcommand{\vecs}[1]{\overset { \scriptstyle \rightharpoonup} {\mathbf{#1}} } \)
\(\newcommand{\longvect}{\overrightarrow}\)
\( \newcommand{\vecd}[1]{\overset{-\!-\!\rightharpoonup}{\vphantom{a}\smash {#1}}} \)
\(\newcommand{\avec}{\mathbf a}\) \(\newcommand{\bvec}{\mathbf b}\) \(\newcommand{\cvec}{\mathbf c}\) \(\newcommand{\dvec}{\mathbf d}\) \(\newcommand{\dtil}{\widetilde{\mathbf d}}\) \(\newcommand{\evec}{\mathbf e}\) \(\newcommand{\fvec}{\mathbf f}\) \(\newcommand{\nvec}{\mathbf n}\) \(\newcommand{\pvec}{\mathbf p}\) \(\newcommand{\qvec}{\mathbf q}\) \(\newcommand{\svec}{\mathbf s}\) \(\newcommand{\tvec}{\mathbf t}\) \(\newcommand{\uvec}{\mathbf u}\) \(\newcommand{\vvec}{\mathbf v}\) \(\newcommand{\wvec}{\mathbf w}\) \(\newcommand{\xvec}{\mathbf x}\) \(\newcommand{\yvec}{\mathbf y}\) \(\newcommand{\zvec}{\mathbf z}\) \(\newcommand{\rvec}{\mathbf r}\) \(\newcommand{\mvec}{\mathbf m}\) \(\newcommand{\zerovec}{\mathbf 0}\) \(\newcommand{\onevec}{\mathbf 1}\) \(\newcommand{\real}{\mathbb R}\) \(\newcommand{\twovec}[2]{\left[\begin{array}{r}#1 \\ #2 \end{array}\right]}\) \(\newcommand{\ctwovec}[2]{\left[\begin{array}{c}#1 \\ #2 \end{array}\right]}\) \(\newcommand{\threevec}[3]{\left[\begin{array}{r}#1 \\ #2 \\ #3 \end{array}\right]}\) \(\newcommand{\cthreevec}[3]{\left[\begin{array}{c}#1 \\ #2 \\ #3 \end{array}\right]}\) \(\newcommand{\fourvec}[4]{\left[\begin{array}{r}#1 \\ #2 \\ #3 \\ #4 \end{array}\right]}\) \(\newcommand{\cfourvec}[4]{\left[\begin{array}{c}#1 \\ #2 \\ #3 \\ #4 \end{array}\right]}\) \(\newcommand{\fivevec}[5]{\left[\begin{array}{r}#1 \\ #2 \\ #3 \\ #4 \\ #5 \\ \end{array}\right]}\) \(\newcommand{\cfivevec}[5]{\left[\begin{array}{c}#1 \\ #2 \\ #3 \\ #4 \\ #5 \\ \end{array}\right]}\) \(\newcommand{\mattwo}[4]{\left[\begin{array}{rr}#1 \amp #2 \\ #3 \amp #4 \\ \end{array}\right]}\) \(\newcommand{\laspan}[1]{\text{Span}\{#1\}}\) \(\newcommand{\bcal}{\cal B}\) \(\newcommand{\ccal}{\cal C}\) \(\newcommand{\scal}{\cal S}\) \(\newcommand{\wcal}{\cal W}\) \(\newcommand{\ecal}{\cal E}\) \(\newcommand{\coords}[2]{\left\{#1\right\}_{#2}}\) \(\newcommand{\gray}[1]{\color{gray}{#1}}\) \(\newcommand{\lgray}[1]{\color{lightgray}{#1}}\) \(\newcommand{\rank}{\operatorname{rank}}\) \(\newcommand{\row}{\text{Row}}\) \(\newcommand{\col}{\text{Col}}\) \(\renewcommand{\row}{\text{Row}}\) \(\newcommand{\nul}{\text{Nul}}\) \(\newcommand{\var}{\text{Var}}\) \(\newcommand{\corr}{\text{corr}}\) \(\newcommand{\len}[1]{\left|#1\right|}\) \(\newcommand{\bbar}{\overline{\bvec}}\) \(\newcommand{\bhat}{\widehat{\bvec}}\) \(\newcommand{\bperp}{\bvec^\perp}\) \(\newcommand{\xhat}{\widehat{\xvec}}\) \(\newcommand{\vhat}{\widehat{\vvec}}\) \(\newcommand{\uhat}{\widehat{\uvec}}\) \(\newcommand{\what}{\widehat{\wvec}}\) \(\newcommand{\Sighat}{\widehat{\Sigma}}\) \(\newcommand{\lt}{<}\) \(\newcommand{\gt}{>}\) \(\newcommand{\amp}{&}\) \(\definecolor{fillinmathshade}{gray}{0.9}\)
Ancillary Documents
UALR Students Use Documents in Google Classroom The following links allow anyone to make their own copy of the assignment, which they can modify and reuse, but students must use the copies provided in Google Classroom for grading.
- Copy of Worksheet I: Kinetics (Group Activity)
- Copy of Worksheet II: Kinetics (Individual Activity)
Learning Objectives
Students will be able to:
Content
- Design a series experiments to calculate the constants involved in function, the rate law, where the value of the dependent variable (Rate Law) depends on three independent variables (concentration of two reactions and temperature).
- Apply this to the reaction of the reduction of Ferric Iron by Iodide at various temperatures.
- Understand how the initial rate of a chemical reaction producing iodine can be measured in an iodine clock reaction.
- Work up the data and calculate the rate constant at room temperature, the order of reaction with respect to Ferric and Iodide ions and the Arrhenius constant from rate law data.
- Understand the mathematics of all the calculations
Process
- Run experiments to measure the initial rate of reaction by varying three independant variables, [Fe+2], [I-] and T.
- Use a spreadsheet to calculate the order of reaction from log log plots of Rate and concentration data.
- Use a spreadsheet to calculate the Arrhenius constant from temperature and ln rate constant data.
- Report results
Prior Knowledge
- Redox Reactions (LibreText Section 3.6)
- Use of Logarithms (LibreText Section 14.0.2)
- Use of spreadsheets on log and natural log plots (Graphing Lab)
- Use of spreadsheet functions (Graphing Lab)
Recommended Prior Reading
Introduction
Kinetics deals with the rate at which a process occurs and chemical kinetics deals with the rates of chemical reactions. This is a multi-week lab and each week we will go through several worksheets, where we will investigate the kinetics associated with the following reaction.
\[2Fe^{+3}(aq) + 2I^-(aq) \rightarrow 2Fe^{+2}(aq) + I_2(aq) \]
We will be using an iodine clock reaction as demonstrated in the following video from Thammasat University in Thailand, and will be measuring the effects of changing reactant concentrations and temperature on the time it takes to turn blue.
Video \(\PageIndex{1}\): The last 46 seconds of a video showing the reduction of Iron(III) by Iodide reaction that we will be studying, uploaded by Kanchanok Duangkhai (https://youtu.be/azUuxhclcm0).
Worksheet 1: Group Work
- Part 1: Understanding the Iodine Clock Reaction. This activity will guide students through the chemistry used to measure the rate of reaction, which is based on knowing the concentrations of reagents mixed and the time it takes for the solution to turn blue after they are mixed (see above video).
- Part 2: Rate Law at Constant Temperature. This Group Activity will focus on the rate law, which is a power function, and guide students through how to calculate the rate constant and the orders of reaction from experimental data that shows the dependence of the reaction rate on reactant concentrations. Students should study the rate law section of their textbook (section 14.3) and be able to make appropriate log graphs.
- Part 3: Rate Constant as Function of Temperature, the Arrhenius Equation. This Activity will focus on the Arrhenius equation, which is an exponential function, and guide us through how to calculate the energy of activation for a reaction from the effect of temperature on the rate of reaction. Students should study the section of their textbook on the Arrhenius equation (section 14.5) and know how to make the appropriate natural log graph.
- Part 4: Designing a Multivariable Experiment: This Group Activity will combine the results of worksheets 2 and 3 for students to design three sets of experiments that will allow the to students acquire all the data needed to determine the rate constant, orders of reaction and activation energy for the reaction of the ferric ion oxidation of iodide into iodide. This worksheet will include specifying all reagent concentrations and the design of an appropriate data tables.
Worksheet 2: Individual Work
- Part 1: Making the Solutions
- Part 2: Obtaining the Data: This individual activity will require each student fill out their own data and develop a chemical safety section. Students may work together on the data sheet, but each student must turn in their own data sheet. The safety evaluation must be unique, and students with duplicate safety sections will be docked points.
- Part 3: Working Up the Data: This individual activity will involve developing a Google Sheets workbook to work up the data and report the results. Every student must submit their own original work.
Work Sheet I: The Chemistry
Part I: Understanding the Iodine Clock Reaction
In designing an experiment we need to understand the current state of knowledge of the fundamental chemistry, and know the tools and supplies we have to work with.
Equipment and supplies
2x 50ml burets 0.04 M Ferric Nitrate solution
0.04 M KI solution. 2% starch solution
0.15 M HNO3 solution distilled water
0.004M Na2S2O3 Hot Plate
Ice Bath
Safety Considerations
All solutions should be considered to be potentially harmful and care should be exercised to insure that they do not come in contact with the skin or other body tissues. In the event contact with the reagents occurs, the contacted area should be flushed with water and the instructor notified immediately. Approved eye protection is MANDATORY for this experiment.
The Reactions
In this experiment, we will mix two solutions and as in video \(\PageIndex{1}\), measure the time for the mixture to turn blue, and with an understanding of the chemistry, calculate the rate constant under the conditions of the solutions were mixed ([Fe+3], [I-] and T). The following image shows the essential procedure for this experiment, you make two solutions, one with the ferric ion and another with the iodide ion, and then you mix them and measure the time for it to turn blue after they are mixed.
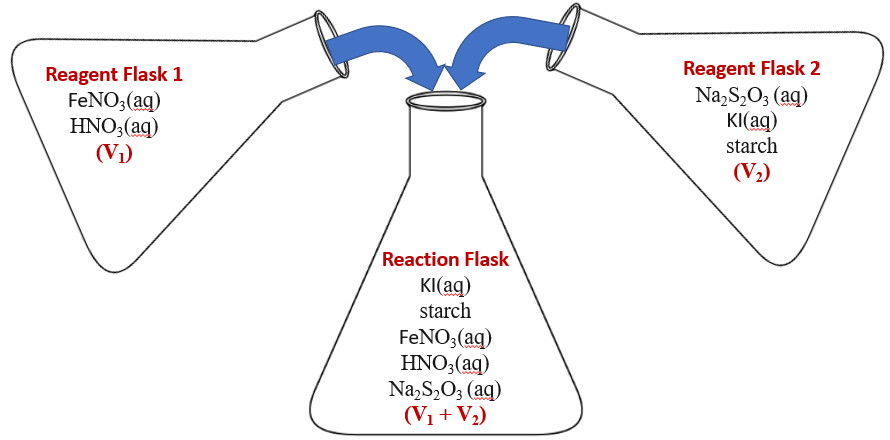 Figure
 The chemical reactions in this equation are described below. The basis of the reaction is once the iodine reaches a sufficient concentration it reacts with the starch and the system turns blue, but this can not happen until all the thiosulfate (S2O3-2) is consumed.
\[\begin{align} 2Fe^{+3}(aq) + 2I^-(aq) & \rightarrow 2Fe^{+2}(aq) + {\color{red}I_2(aq)} \; \; \; \;\; \; \;\text{Relatively Slow Step}\\ {\color{red}I_2(aq)} + 2S_2O_3^{-2}(aq) & \rightarrow 2I^-(aq) + S_4O_6^{-2}(aq) \; \; \;\ \; \text{Very Fast Step}\\ I_2(aq) + Starch(aq) & \rightarrow \underbrace{\color{blue}{I_2\text{-Starch Complex}}}_{ \textcolor{blue}{(\large{DARK BLUE})}} \end{align}\]
Note how the iodine (in red) produced in the first step is consumed in the second step. If we add the first two steps both the iodine (in red) and the iodide cancel giving:
\[2Fe^{+3}(aq) + 2S_2O_3^{-2}(aq) \rightarrow 2Fe^{+2}(aq) + S_4O_6^{-2}(aq)\]
Thiosulfate (S2O3-2) reacts so fast that it is considered to be an "iodine scavenger" and as long as there is thiosulfate present the iodine never accumulates to a sufficient concentration to react with the starch and turn blue. But once the thiosulfate is consumed the iodine accumulates, reacts with the starch and the solution turns blue.
From equation 4.5 we can see that two thiosulfate molecules react with two ferric ions and so the rate of ferric consumption is the same as the rate of thiosulfate consumption, and this provides a way to measure the rate.
\[ R= \frac{\Delta [S_2O_3^{-2}]}{\Delta t}=\frac{\Delta [Fe^{+3}]}{\Delta t}\]
For this to work
\[\color{Red}{ [S_2O_3^{-2}]<<[Fe^{+3}]
}\]
and so if we know the concentration of thiosulfate ([S2O3-2]) and measure the time to turn blue, we can determine the rate of reaction.
Important Note
For this technique to work the thiosulfate concentration ([S2O3-2]) must be much less than the ferric ion concentration ([Fe+3]), as we are saying the change in concentration of the ferric ion is so small by the the time the solution turns blue that it is negligible, and therefor we can use the initial concentration of ferric ion in our calculations. Note, if the thiosulfate concentration is greater than the ferric ion, the solution will never turn blue.
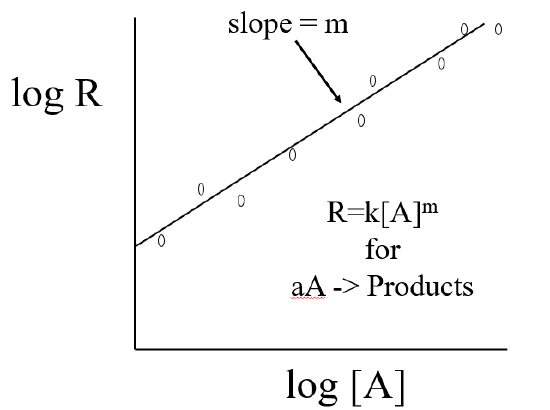
Part II: The Rate Law-Concentration Dependence of Rate
Before proceeding with this experiment you should review your textbook's section (14.3 ) on chemical kinetics and the two equations we are using to describe the rate of a chemical reaction. For the generic reaction
\[A \rightarrow B\]
The Rate Law is:
\[R=k[A]^{m}\]
We can determine the value of k and m by measuring the dependent variable R at various concentrations of the independent variable [A], and plotting the log of both variables.
\[\log R=\log k[A]^{m}\]
Using the relationship \(\ln ab = \ln a + \ln b\) gives
\[ \log R=\log k + \log [A]^{m} \]
then using the relationship \(\log[A]^b=b\log[A]\) and rearranging gives
\[ \log R=m \log[A] + \log k \]
which has the form of a straight line with slope=m
\[y=mx+b\]
where, \(y=\log R\), \(x=\log [A]\) and \(b=\log k\).
To get \(k\) you take the antilog of \(b\), where \(b\) is a numerical value this is obtained from your graph \[k=10^b\]
We need to apply the above technique to our reaction,
\[2Fe^{+3}(aq) + 2I^-(aq) \rightarrow 2Fe^{+2}(aq) + I_2(aq) \]
which gives the following rate law
\[R=k[Fe^{+3}]^m[I^-]^n\]
where,
k=rate constant at constant temperature
m=order of reaction with respect to ferrous ion (Fe+3)
n=order of reaction with respect to iodide ion (I-).
The problem is that we have two independent variables. So what will have to do is run two sets of experiments, where we successively hold the concentration of one of the independent variables constant ([Fe+3] or[I-]) while varying the concentration of the other. Please work out part 2 of the worksheet.
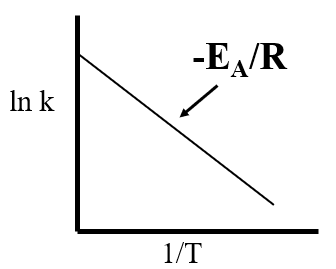
Part III: The Arrhenius Equation-Temperature Dependence of Rate
The second is the Arrhenius equation, which describes the rate constant k's dependence on temperature.
\[k=Ae^{-\frac{E_A}{RT}}\]
where,
- A - is a constant, the Frequency Factor, which describes the frequency of collisions with the proper orientation for a reaction to proceed.
- EA - is a constant, the Activation Energy, which is the minimal amount of energy required to overcome the endothermic step of colliding reactant molecules forming an activated activated complex that can result in products.
- R - is a constant, the Ideal Gas constant in terms of energy (\(R=8.314\frac{J}{mol \cdot K}\))
- T - is a variable, the absolute temperature (in Kelvin)
Converting the Arrhenius equation to its logrithmic forms gives a linear function.
\[\begin{align} k & = Ae^{-\frac{E_A}{RT} }\\ lnk & =ln(Ae^{-\frac{E_A}{RT} }) \nonumber \\ & =lnA + ln(e^{-\frac{E_A}{RT}}) \nonumber \\ & =lnA - \frac{E_A}{RT}\cancel{ln(e)} \nonumber \\ lnk &= - \left (\frac{E_A}{R}\right )\frac{1}{T} + lnA \end{align}\]
Part IV: Designing a MultiVariable Experiment
Before proceeding study/review section 14.3.4 Multi Reactant Systems. That section starts with a discussion of the ideal gas law that has 4 variables (P,V,n & T), and how the empirical gas laws represented measured data that was plotted when two of those variables were held constant. Like the ideal gas law the kinetics of this experiment also involves 4 variables (R, [Fe+3], [I-] & T), which can be understood by substituting the rate constant from the Arrhenius equation into the Rate Law
\[R=Ae^{-\frac{E_A}{RT}}[Fe^{+3}]^m[I^-]^n\]
The goal of this section is to design experiments where we can calculate the constants in the above equation so that we can predict the rate of reaction for different values of the independent variables. If each variable can be considered to be a dimension in information space, we are reducing the number of dimensions from four to two, so that we can plot the functional relationship on a 2D graph, with the dependent variable (R) being represented on the Y axis and the independent variable on the X axis. Unlike the ideal gas law which is an equation of state and all variables are equivalent, the above equation has a dependent variable (Rate) with a value that depends on three independent variables, two of which are power functions ([Fe+3] & [I-]) and one which is an exponential function(T, or more accurately 1/T). That is, in the Ideal/empirical gas laws all variables were equivalent and any variable could be plotted as a function of another, but here the Y-axis must be a representation of the rate, the dependent variable.
Important Note
Note, R represents two things in the equation. \[R=Ae^{-\frac{E_A}{RT}}[Fe^{+3}]^m[I^-]^n\]
On the left of the equal sign R represents the rate of consumption of a reactant or production of a product and is expressed in units of concentration over time. On the right in the exponential, R is the ideal gas constant in units of \(\frac{J}{mol \cdot K}\) and RT is a molar representation of energy. It is important for students to realize the meaning of an algebraic symbol can be contextual, that is, based on the context in which it is using. In fact the numerical value of R, the ideal gas constant is contextual, and in the context of the Arrhenius equation you would use the value of 8.3145 \(\frac{J}{mol \cdot K}\) and not 0.08206\(\frac{l \cdot atm}{mol \cdot K}\). This understanding of the contextual use of algebraic symbols is important, for example, what does "m" stand for, it could be molality, mass, milli,.. and the exact meaning needs to be understood in the context it is used.
From the experimental perspective there is an additional layer of complexity to the experimental design as one does not directly measure the rate, but measures the time for a very small of amount of thiosulfate to be consumed (review part I above), that is the raw data is time and the rate is calculated by measuring the time it takes for a solution of known thiosulfate concentration to turn blue. So before proceeding to the actual experimental design we need to have a quick discussion on Rate (section 14.1) and define the temperature dependent rate law in terms of the actual data we measure. There are many ways to describe the rate of the above reaction, which could be in terms of any reactant or product, and they are related by the following expression.
\[ R_{relative}=-\dfrac{1}{2}\dfrac{\Delta [Fe^{+3}]}{\Delta t} = - \dfrac{1}{2}\dfrac{\Delta [I^-]}{\Delta t} = \dfrac{1}{2}\dfrac{\Delta [Fe^{+2}]}{\Delta t} = \dfrac{\Delta [I_2]}{\Delta t}\]
In this experiment we are going to use the iodine clock and relate the ferric iron consumption to the thiosulfate consumption as defined in eq. 4.6 \( R= \frac{\Delta [S_2O_3^{-2}]}{\Delta t}=\frac{\Delta [Fe^{+3}]}{\Delta t}\) and thus:
\[ R =\frac{\Delta [\;Fe^{+3} \;]}{\Delta t}= \frac{\Delta [S_2O_3^{-2}]}{\Delta t}=Ae^{-\frac{E_A}{RT}}[Fe]^{+3}]^m[I^-]^n\]
Note, the above expression of the rate law has both temperature (T) and time (t) as measurable variables. That is, you measure time to calculate the rate, and it changes with the temperature, and they both use the same alphabetical symbol. So, we need a convention; t=time and T=temperature, TAs are instructed to take off points if you do not use this convention.
Important Note
Important Conventions: The units of R are \(\frac{\Delta [concentration]}{\Delta time}\) and so equation \(\PageIndex{3}\) has the units of both time and temperature. Therefore we need a convention; upper case T is for temperature and lower case t is for time. Likewise, the rate constant (k) is always written in lower case as in the next chapter we will introduce the equilibrium constant, which is an upper case K.
Experimental Strategy
In figure \(\PageIndex{1}\) we defined two reagent flasks and a reaction flask, but in reality you can use one of the reagent flasks as the reactant flask. You need to carefully label each flask, and we will use a beaker for iodide solutions and an Erlenmeyer flask ferric iron solution. During the second week you will make the solutions and record the time it takes to turn blue after you mix them. Right now you need to design three sets of experiments and write down in the worksheet the volumes of all reagents that are not prefilled in, so that you can successively calculate m, n and EA.
Reagent Flask 1: This flask contains the ferric iron. You are provided 0.04 M ferric ion (Fe(NO3)3), and each flask should contain 20 mL of 0.15M nitric acid (HNO3) and enough water so the entire volume is 50 ml. The nitric acid is added to stabilize the ferric iron from the ferric nitrate. The minimum volume of ferric nitrate should be 10 ml, as this will keep its concentration an order of magnitude greater than the thiosulfate in reagent flask 2.
Reagent Flask 2: This flask contains the Iodide. You are provided with 0.04M potassium iodide (KI). Each flask should have 10 ml of 0.004M thiosulfate and 5 ml of starch. Water is added to maintain a total volume of 50 ml. The minimum volume of potassium iodide should be 10 ml, as this will keep its concentration an order of magnitude greater than the thiosulfate in reagent flask 2.
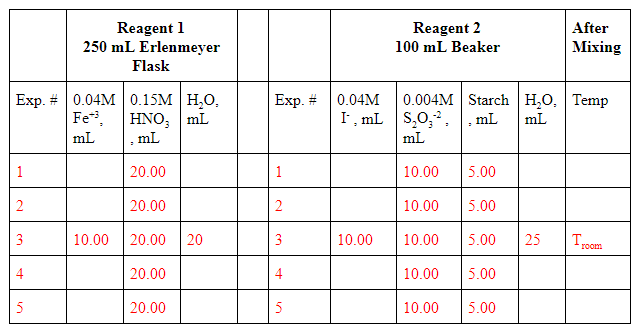 Figure \(\PageIndex{6}\): Screenshot from worksheet where students need to vary concentrations of reactants.
Reaction Flask: Although figure \(\PageIndex{1}\) shows this as a third flask, we will pour from the beaker into the Erlenmeyer flask and start the stop watch the moment the solutions come into contact with each other. The moment we mix the solution the reactions of the iodine clock will start and we will collect data related to the following equation, where the concentrations are based on the solutions you mix above, after being diluted.
\[ R = \frac{\Delta [S_2O_3^{-2}]}{\Delta t}=Ae^{-\frac{E_A}{RT}}[Fe]^{+3}]^m[I^-]^n\]
That is, the concentration of the reagents in flask 1 and beaker 2 are not what is important, but their concentrations at the moment of mixing. This is where worksheet 2 will pick up.