
3: Spectroscopy
- Page ID
- 316198
\( \newcommand{\vecs}[1]{\overset { \scriptstyle \rightharpoonup} {\mathbf{#1}} } \)
\( \newcommand{\vecd}[1]{\overset{-\!-\!\rightharpoonup}{\vphantom{a}\smash {#1}}} \)
\( \newcommand{\dsum}{\displaystyle\sum\limits} \)
\( \newcommand{\dint}{\displaystyle\int\limits} \)
\( \newcommand{\dlim}{\displaystyle\lim\limits} \)
\( \newcommand{\id}{\mathrm{id}}\) \( \newcommand{\Span}{\mathrm{span}}\)
( \newcommand{\kernel}{\mathrm{null}\,}\) \( \newcommand{\range}{\mathrm{range}\,}\)
\( \newcommand{\RealPart}{\mathrm{Re}}\) \( \newcommand{\ImaginaryPart}{\mathrm{Im}}\)
\( \newcommand{\Argument}{\mathrm{Arg}}\) \( \newcommand{\norm}[1]{\| #1 \|}\)
\( \newcommand{\inner}[2]{\langle #1, #2 \rangle}\)
\( \newcommand{\Span}{\mathrm{span}}\)
\( \newcommand{\id}{\mathrm{id}}\)
\( \newcommand{\Span}{\mathrm{span}}\)
\( \newcommand{\kernel}{\mathrm{null}\,}\)
\( \newcommand{\range}{\mathrm{range}\,}\)
\( \newcommand{\RealPart}{\mathrm{Re}}\)
\( \newcommand{\ImaginaryPart}{\mathrm{Im}}\)
\( \newcommand{\Argument}{\mathrm{Arg}}\)
\( \newcommand{\norm}[1]{\| #1 \|}\)
\( \newcommand{\inner}[2]{\langle #1, #2 \rangle}\)
\( \newcommand{\Span}{\mathrm{span}}\) \( \newcommand{\AA}{\unicode[.8,0]{x212B}}\)
\( \newcommand{\vectorA}[1]{\vec{#1}} % arrow\)
\( \newcommand{\vectorAt}[1]{\vec{\text{#1}}} % arrow\)
\( \newcommand{\vectorB}[1]{\overset { \scriptstyle \rightharpoonup} {\mathbf{#1}} } \)
\( \newcommand{\vectorC}[1]{\textbf{#1}} \)
\( \newcommand{\vectorD}[1]{\overrightarrow{#1}} \)
\( \newcommand{\vectorDt}[1]{\overrightarrow{\text{#1}}} \)
\( \newcommand{\vectE}[1]{\overset{-\!-\!\rightharpoonup}{\vphantom{a}\smash{\mathbf {#1}}}} \)
\( \newcommand{\vecs}[1]{\overset { \scriptstyle \rightharpoonup} {\mathbf{#1}} } \)
\(\newcommand{\longvect}{\overrightarrow}\)
\( \newcommand{\vecd}[1]{\overset{-\!-\!\rightharpoonup}{\vphantom{a}\smash {#1}}} \)
\(\newcommand{\avec}{\mathbf a}\) \(\newcommand{\bvec}{\mathbf b}\) \(\newcommand{\cvec}{\mathbf c}\) \(\newcommand{\dvec}{\mathbf d}\) \(\newcommand{\dtil}{\widetilde{\mathbf d}}\) \(\newcommand{\evec}{\mathbf e}\) \(\newcommand{\fvec}{\mathbf f}\) \(\newcommand{\nvec}{\mathbf n}\) \(\newcommand{\pvec}{\mathbf p}\) \(\newcommand{\qvec}{\mathbf q}\) \(\newcommand{\svec}{\mathbf s}\) \(\newcommand{\tvec}{\mathbf t}\) \(\newcommand{\uvec}{\mathbf u}\) \(\newcommand{\vvec}{\mathbf v}\) \(\newcommand{\wvec}{\mathbf w}\) \(\newcommand{\xvec}{\mathbf x}\) \(\newcommand{\yvec}{\mathbf y}\) \(\newcommand{\zvec}{\mathbf z}\) \(\newcommand{\rvec}{\mathbf r}\) \(\newcommand{\mvec}{\mathbf m}\) \(\newcommand{\zerovec}{\mathbf 0}\) \(\newcommand{\onevec}{\mathbf 1}\) \(\newcommand{\real}{\mathbb R}\) \(\newcommand{\twovec}[2]{\left[\begin{array}{r}#1 \\ #2 \end{array}\right]}\) \(\newcommand{\ctwovec}[2]{\left[\begin{array}{c}#1 \\ #2 \end{array}\right]}\) \(\newcommand{\threevec}[3]{\left[\begin{array}{r}#1 \\ #2 \\ #3 \end{array}\right]}\) \(\newcommand{\cthreevec}[3]{\left[\begin{array}{c}#1 \\ #2 \\ #3 \end{array}\right]}\) \(\newcommand{\fourvec}[4]{\left[\begin{array}{r}#1 \\ #2 \\ #3 \\ #4 \end{array}\right]}\) \(\newcommand{\cfourvec}[4]{\left[\begin{array}{c}#1 \\ #2 \\ #3 \\ #4 \end{array}\right]}\) \(\newcommand{\fivevec}[5]{\left[\begin{array}{r}#1 \\ #2 \\ #3 \\ #4 \\ #5 \\ \end{array}\right]}\) \(\newcommand{\cfivevec}[5]{\left[\begin{array}{c}#1 \\ #2 \\ #3 \\ #4 \\ #5 \\ \end{array}\right]}\) \(\newcommand{\mattwo}[4]{\left[\begin{array}{rr}#1 \amp #2 \\ #3 \amp #4 \\ \end{array}\right]}\) \(\newcommand{\laspan}[1]{\text{Span}\{#1\}}\) \(\newcommand{\bcal}{\cal B}\) \(\newcommand{\ccal}{\cal C}\) \(\newcommand{\scal}{\cal S}\) \(\newcommand{\wcal}{\cal W}\) \(\newcommand{\ecal}{\cal E}\) \(\newcommand{\coords}[2]{\left\{#1\right\}_{#2}}\) \(\newcommand{\gray}[1]{\color{gray}{#1}}\) \(\newcommand{\lgray}[1]{\color{lightgray}{#1}}\) \(\newcommand{\rank}{\operatorname{rank}}\) \(\newcommand{\row}{\text{Row}}\) \(\newcommand{\col}{\text{Col}}\) \(\renewcommand{\row}{\text{Row}}\) \(\newcommand{\nul}{\text{Nul}}\) \(\newcommand{\var}{\text{Var}}\) \(\newcommand{\corr}{\text{corr}}\) \(\newcommand{\len}[1]{\left|#1\right|}\) \(\newcommand{\bbar}{\overline{\bvec}}\) \(\newcommand{\bhat}{\widehat{\bvec}}\) \(\newcommand{\bperp}{\bvec^\perp}\) \(\newcommand{\xhat}{\widehat{\xvec}}\) \(\newcommand{\vhat}{\widehat{\vvec}}\) \(\newcommand{\uhat}{\widehat{\uvec}}\) \(\newcommand{\what}{\widehat{\wvec}}\) \(\newcommand{\Sighat}{\widehat{\Sigma}}\) \(\newcommand{\lt}{<}\) \(\newcommand{\gt}{>}\) \(\newcommand{\amp}{&}\) \(\definecolor{fillinmathshade}{gray}{0.9}\)Learning Objectives
- Use spectroscopy to examine atomic structure
- Gain an understanding about the relationships between energy and light.
Introduction:
A source of light (often called a continuous source) that has all of the different colors (wavelengths) and is called white light. However, some sources of light have only certain colors (discreet wavelengths) as components and appear colored to the eye.
Spectroscope: A spectroscope splits visible light into its component wavelengths (colors) and uses the human eye as the detector.
Spectrophotometer: A spectrophotometer splits light into its component wavelengths (colors) and uses an electronic detector.
This experiment explores the spectra of fluorescent light wavelengths using the spectroscopes and of various lamps containing gases with discreet wavelengths of radiation using the spectrophotometer.
Pre Lab Video
Experiment:
Part I: Spectroscopes and Tubes
Step 1
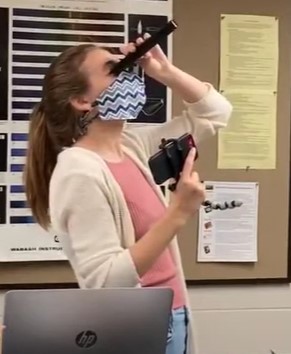 Obtain a spectroscope. Look into the spectroscope while aiming it at the overhead lights.
Step 2
You should see a numbered scale to the right with numbers ranging from four to seven. Underneath that you should see a series broad swath of colors from red to purple (see Figure 1). The scale is listed in hundreds of nanometers, so the “4” refers to 400 nm. This is the wavelength of that color of light.
Step 3
Draw the spectra in your lab notebook.
Step 4
Now turn on the hydrogen lamp and do the same. As soon as you are finished with the lamp though, turn it off. The gas lamps are very easy to burn out if left on too long.
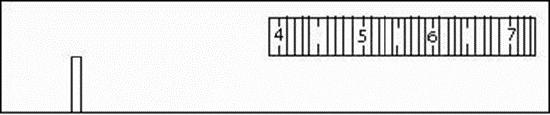
Figure \(\PageIndex {1}\): Inside of the Spectroscope
Part II: Using a spectrophotometer to record wavelengths
Each lamp has a spectrophotometer next to it connected to a computer. The spectrophotometer is an instrument that accurately measures the wavelengths and intensities of light.
Step 1
On the computer open SI 400 Series Emission.
Step 2
Click on the Initialize button.
Step 3
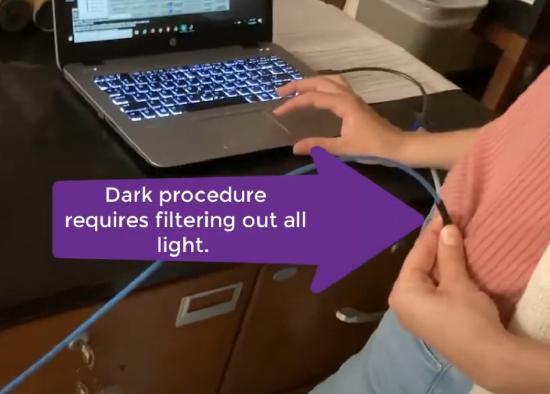 Holding the end of the fiber optic against a piece of clothing (to block light from entering) click on the “Dark” button on the screen.
Step 4
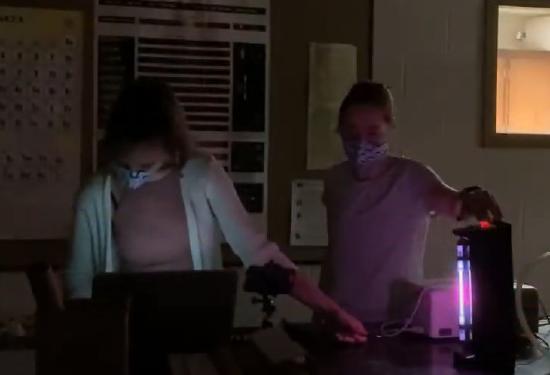 Hold the end of the fiber optic cable up to the lamp. Click on the “Acquire” button on the screen (best done by second person). Continue to hold the end of the fiber optic cable to the lamp until the spectra appears in the window.
Step 5
Examine the spectrum. You should see a set a plot (wavelength in nanometers on the x-axis and intensity on the y-axis) with a set of peaks. Each peak represents a different wavelength of light.
Step 6
Determine the wavelengths of the peaks. Use the arrow to grab the blue cursor and move it to the top of a peak. Click on the “Blue Cursor” button on the screen. The wavelength and intensity of that peak will appear in the box. Repeat until the major peaks have all been identified. Do this for up to the eight strongest peaks.
Step 7
Enter the appropriate information in the boxes for Sample name, Comment and Operator.
Step 8
Print your spectrum by clicking on the “Print” button on the screen the number of times as there are members in your group.
Step 9
Pick up your printouts.
Step 10
Complete both the hydrogen lamp and the other lamp at your initial station. Then move to the next station until you have the spectrum for each of the other remaining lamps.
Post Lab
From the data on your hydrogen spectrum from the spectrophotometer, calculate the energy associated with one of the three wavelengths of light using Planck's constant (h), the speed of light (c) and your wavelength \(\lambda\).
\[ E = \frac{\text{h}\text{c}}{\lambda}\label{1}\]
Determine the color associated with light of this wavelength. Is this value consistent with any of the light you observed for the hydrogen lamp using the spectroscope?