
5.4: Infrared Spectroscopy
- Page ID
- 319872
\( \newcommand{\vecs}[1]{\overset { \scriptstyle \rightharpoonup} {\mathbf{#1}} } \)
\( \newcommand{\vecd}[1]{\overset{-\!-\!\rightharpoonup}{\vphantom{a}\smash {#1}}} \)
\( \newcommand{\id}{\mathrm{id}}\) \( \newcommand{\Span}{\mathrm{span}}\)
( \newcommand{\kernel}{\mathrm{null}\,}\) \( \newcommand{\range}{\mathrm{range}\,}\)
\( \newcommand{\RealPart}{\mathrm{Re}}\) \( \newcommand{\ImaginaryPart}{\mathrm{Im}}\)
\( \newcommand{\Argument}{\mathrm{Arg}}\) \( \newcommand{\norm}[1]{\| #1 \|}\)
\( \newcommand{\inner}[2]{\langle #1, #2 \rangle}\)
\( \newcommand{\Span}{\mathrm{span}}\)
\( \newcommand{\id}{\mathrm{id}}\)
\( \newcommand{\Span}{\mathrm{span}}\)
\( \newcommand{\kernel}{\mathrm{null}\,}\)
\( \newcommand{\range}{\mathrm{range}\,}\)
\( \newcommand{\RealPart}{\mathrm{Re}}\)
\( \newcommand{\ImaginaryPart}{\mathrm{Im}}\)
\( \newcommand{\Argument}{\mathrm{Arg}}\)
\( \newcommand{\norm}[1]{\| #1 \|}\)
\( \newcommand{\inner}[2]{\langle #1, #2 \rangle}\)
\( \newcommand{\Span}{\mathrm{span}}\) \( \newcommand{\AA}{\unicode[.8,0]{x212B}}\)
\( \newcommand{\vectorA}[1]{\vec{#1}} % arrow\)
\( \newcommand{\vectorAt}[1]{\vec{\text{#1}}} % arrow\)
\( \newcommand{\vectorB}[1]{\overset { \scriptstyle \rightharpoonup} {\mathbf{#1}} } \)
\( \newcommand{\vectorC}[1]{\textbf{#1}} \)
\( \newcommand{\vectorD}[1]{\overrightarrow{#1}} \)
\( \newcommand{\vectorDt}[1]{\overrightarrow{\text{#1}}} \)
\( \newcommand{\vectE}[1]{\overset{-\!-\!\rightharpoonup}{\vphantom{a}\smash{\mathbf {#1}}}} \)
\( \newcommand{\vecs}[1]{\overset { \scriptstyle \rightharpoonup} {\mathbf{#1}} } \)
\( \newcommand{\vecd}[1]{\overset{-\!-\!\rightharpoonup}{\vphantom{a}\smash {#1}}} \)
\(\newcommand{\avec}{\mathbf a}\) \(\newcommand{\bvec}{\mathbf b}\) \(\newcommand{\cvec}{\mathbf c}\) \(\newcommand{\dvec}{\mathbf d}\) \(\newcommand{\dtil}{\widetilde{\mathbf d}}\) \(\newcommand{\evec}{\mathbf e}\) \(\newcommand{\fvec}{\mathbf f}\) \(\newcommand{\nvec}{\mathbf n}\) \(\newcommand{\pvec}{\mathbf p}\) \(\newcommand{\qvec}{\mathbf q}\) \(\newcommand{\svec}{\mathbf s}\) \(\newcommand{\tvec}{\mathbf t}\) \(\newcommand{\uvec}{\mathbf u}\) \(\newcommand{\vvec}{\mathbf v}\) \(\newcommand{\wvec}{\mathbf w}\) \(\newcommand{\xvec}{\mathbf x}\) \(\newcommand{\yvec}{\mathbf y}\) \(\newcommand{\zvec}{\mathbf z}\) \(\newcommand{\rvec}{\mathbf r}\) \(\newcommand{\mvec}{\mathbf m}\) \(\newcommand{\zerovec}{\mathbf 0}\) \(\newcommand{\onevec}{\mathbf 1}\) \(\newcommand{\real}{\mathbb R}\) \(\newcommand{\twovec}[2]{\left[\begin{array}{r}#1 \\ #2 \end{array}\right]}\) \(\newcommand{\ctwovec}[2]{\left[\begin{array}{c}#1 \\ #2 \end{array}\right]}\) \(\newcommand{\threevec}[3]{\left[\begin{array}{r}#1 \\ #2 \\ #3 \end{array}\right]}\) \(\newcommand{\cthreevec}[3]{\left[\begin{array}{c}#1 \\ #2 \\ #3 \end{array}\right]}\) \(\newcommand{\fourvec}[4]{\left[\begin{array}{r}#1 \\ #2 \\ #3 \\ #4 \end{array}\right]}\) \(\newcommand{\cfourvec}[4]{\left[\begin{array}{c}#1 \\ #2 \\ #3 \\ #4 \end{array}\right]}\) \(\newcommand{\fivevec}[5]{\left[\begin{array}{r}#1 \\ #2 \\ #3 \\ #4 \\ #5 \\ \end{array}\right]}\) \(\newcommand{\cfivevec}[5]{\left[\begin{array}{c}#1 \\ #2 \\ #3 \\ #4 \\ #5 \\ \end{array}\right]}\) \(\newcommand{\mattwo}[4]{\left[\begin{array}{rr}#1 \amp #2 \\ #3 \amp #4 \\ \end{array}\right]}\) \(\newcommand{\laspan}[1]{\text{Span}\{#1\}}\) \(\newcommand{\bcal}{\cal B}\) \(\newcommand{\ccal}{\cal C}\) \(\newcommand{\scal}{\cal S}\) \(\newcommand{\wcal}{\cal W}\) \(\newcommand{\ecal}{\cal E}\) \(\newcommand{\coords}[2]{\left\{#1\right\}_{#2}}\) \(\newcommand{\gray}[1]{\color{gray}{#1}}\) \(\newcommand{\lgray}[1]{\color{lightgray}{#1}}\) \(\newcommand{\rank}{\operatorname{rank}}\) \(\newcommand{\row}{\text{Row}}\) \(\newcommand{\col}{\text{Col}}\) \(\renewcommand{\row}{\text{Row}}\) \(\newcommand{\nul}{\text{Nul}}\) \(\newcommand{\var}{\text{Var}}\) \(\newcommand{\corr}{\text{corr}}\) \(\newcommand{\len}[1]{\left|#1\right|}\) \(\newcommand{\bbar}{\overline{\bvec}}\) \(\newcommand{\bhat}{\widehat{\bvec}}\) \(\newcommand{\bperp}{\bvec^\perp}\) \(\newcommand{\xhat}{\widehat{\xvec}}\) \(\newcommand{\vhat}{\widehat{\vvec}}\) \(\newcommand{\uhat}{\widehat{\uvec}}\) \(\newcommand{\what}{\widehat{\wvec}}\) \(\newcommand{\Sighat}{\widehat{\Sigma}}\) \(\newcommand{\lt}{<}\) \(\newcommand{\gt}{>}\) \(\newcommand{\amp}{&}\) \(\definecolor{fillinmathshade}{gray}{0.9}\)Infrared Spectroscopy is used to characterize organic molecules by functional group. Since we cannot visually observe the atoms and bonds in a molecule, we use indirect techniques to determine the functional groups in a molecule.
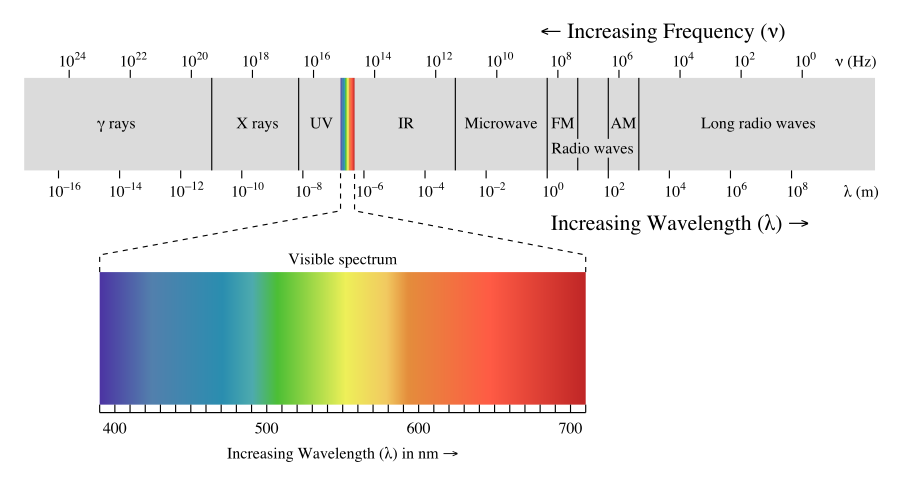
Let’s first talk about spectroscopy as a discipline within chemistry. Spectroscopy is the study of the interaction of matter with energy from the electromagnetic spectrum. In other words, it is the study of what happens to molecules in the presence of difference wavelengths of light. The electromagnetic spectrum in shown in Figure 5.4.1. High energy waves of light have short wavelengths and high frequencies. Examples of this kind of light include x-rays and gamma rays. On the opposite end of the spectrum are radio waves, which have long wavelengths, low frequencies, and low energies. Interaction of different wavelelengths of light have an impact on the behavior of molecules. Radiowaves, for example, cause nuclear spin transitions. Microwaves cause molecules to tumble. Infrared light, which is now higher in energy, causes bonds to vibrate. Visible light gives molecules color. Finally, ultraviolet light causes electronic transitions.
Infrared light causes molecular vibrations. Certain bonds will absorb at specific wavelengths, which will give us information on the strength of the bond and which functional groups are present. An example of an infrared spectrum is shown in Figure 5.4.2. From this spectrum, we can deduce that this molecule contains at least two types of bonds: C-H and C=O. The x-axis is in wavenumbers. A wavenumber is defined as the reciprocal of wavelength. You may recall that energy is equal to Planck’s constant times the speed of light (c), divided by the wavelength. Substituting for wavelength, we can also obtain E = hc * wavenumber. A wavenumber is really just the number of cycles of a wave in 1 cm. If one wanted to convert from wavenumbers to wavelength (in this case microns), the equation is simply wavenumbers = 10,000/microns. The y-axis is the percent transmittance (which is the opposite of absorbance (1/A)). When reporting peaks in an infrared spectrum, we use a qualitative approach, where s is an intense peak, m is a moderately sized peak, and w is a weak peak.
 Figure \(\PageIndex{2}\): Infrared spectrum of vanillin. (CC BY-NS-SA; Delmar Larsen via LibreTexts)
Let’s now talk about the theory of IR spectroscopy by considering a spring. If we have a block and a ball connected by a spring in a vacuum and we were to pull them apart, the spring would stretch. The spring now has a high tension and high potential energy. If we then released both structures, the ball and block would bounce back and forth until they came to rest. Thus, a restoring force inherent in the spring would bring the ball and block back to an equilibrium state. Likewise, if we pushed the two together, the spring would compress and the distance between the block and ball would shorten. Again, the spring at this stage would have high tension and high potential energy, such that when you released the block and ball, they would vibrate back and forth until they are at rest. This same analogy can be used for chemical bonds. Instead of a block and a ball connected by a spring, we have two atoms connected by a bond.
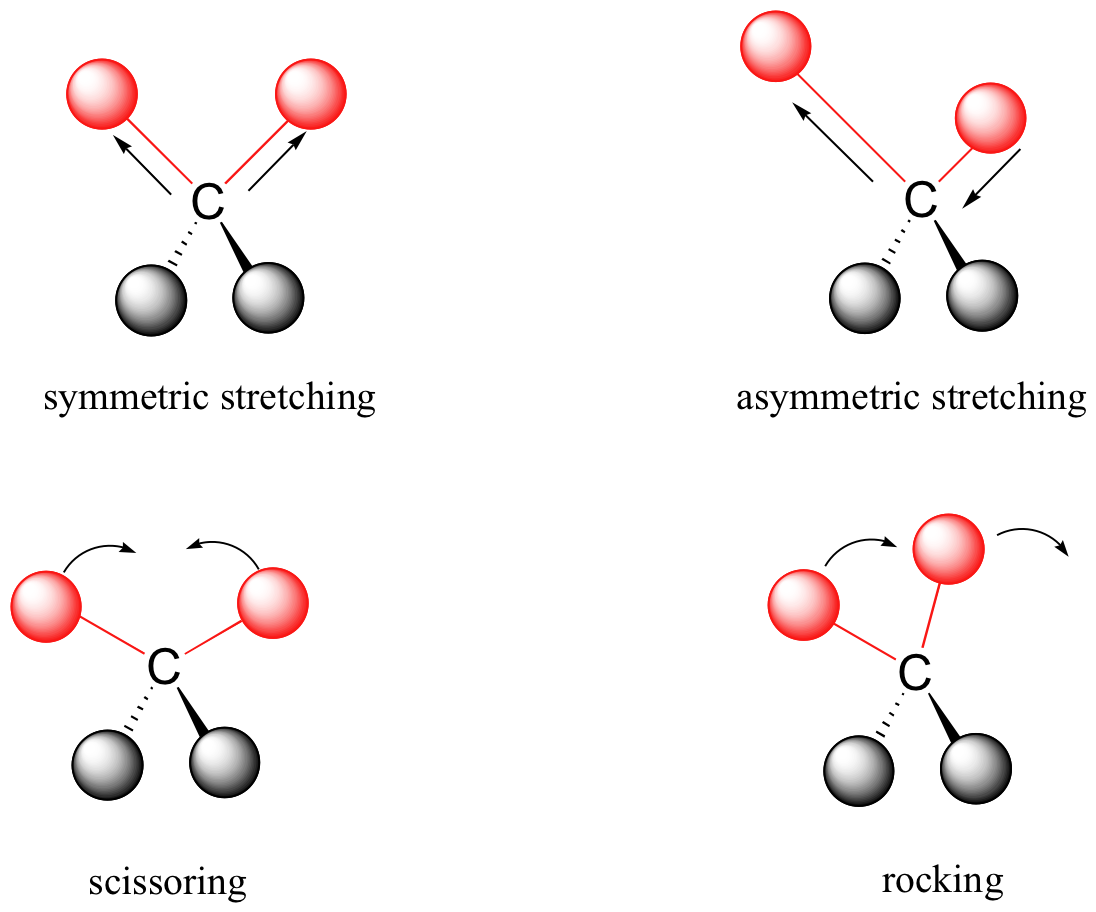
So, what kinds of molecular vibrations are there? Well, if we were to extend our analogy of the spring, we would have a diatomic molecule that upon excitation with infrared light would causes stretching of the bond, and then the movement back and forth of each atom. This is called a stretching vibration. In a molecule containing three atoms, there are several modes of vibration, as described in Figure 5.4.3. When both bonds lengthen and shorten at the same time, we call this a symmetric stretching vibration. When one bond shortens and the other lengthens, this is called asymmetric stretching. In the same molecule, there are two types of bending vibrations (scissoring and rocking). Infrared light can cause the bond angle between the atom to decrease, and then increase as it reaches back to equilibrium. In a complex molecule, many types of bonds will be undergoing these vibrations, all at different frequencies and intensities, so the spectra can become quite complicated. But there are a few factors that determine where the vibrational frequency will lie.
Vibrational frequencies are determined by the type of vibration, the strength of the bond, the masses of the atoms, and by electronegativity. The first factor is the type of vibration. If we were to consider the C-H stretch versus the CH2 bend, we see that the stretching vibration occurs at higher frequency. This tells us that stretching vibrations require more energy than bending vibrations.
The strength of the bond or bond order also has an impact on frequency. Consider a bond order of 1, we can have C-C, C-O, and C-N single bonds, with frequencies in the range of 1300-800 cm-1. Using the same atoms, but with a bond order of two, a C=C double bond, C-O double bond, and C-N double bond vibrate much higher, at 1900-1500 cm-1. Triple bonds, which are stronger than both double and single bounds, vibrate at even higher frequencies, roughly 2300-2000 cm-1. Thus, we can conclude that stronger bonds require more force to compress or stretch, which means that they will also vibrate faster than weaker bonds. Thus, frequency increases as bond strength increases. A third factor is the masses of the atoms. If we consider the C-H versus C-D stretch, we see that the C-H stretch is much more energetic than C-D. Hydrogen is a small atom and can vibrate much faster than large atoms. We see this hold true for other atoms bound to hydrogen as well. O-H, N-H, and C-H bonds have high vibrational frequencies. Thus, heavier atoms vibrate more slowly than lighter atoms, so frequency increases as weight decreases.
The final parameter is electronegativity. While electronegativity does not affect frequency, it does effect the intensity of the peak. This is because bond polarity effected absorption intensity. For example, C-C single and double bonds are either weak or moderate in intensity, while C-O single and double bonds are quite strong. This is because as infrared light causes stretching vibrations, bond dipoles will change. If a C=O double bond lengthens, the bond dipole will be stronger. This increases the intensity of the IR band.
Finally, we need to discuss where to find specific bands for functional groups in an IR spectra and develop a strategy for interpreting such data. We can divide the IR spectra into four regions, roughly 4000-2800, 2800-1900, 1900-1200, and 1200-400 cm-1. The first region, above 2800, is characteristic of X-H bonds, or bonds to hydrogen. Triple bonds come at slightly lower frequency, followed by double bonds, and finally single bonds. This final region can be very complex and there are often peaks that overlap. Another name for this region is the fingerprint region.
In the X-H region we have C-H, N-H, and O-H bonds at the frequencies shown. These stretches are correlated to the energies of the respective bonds. Thus, the O-H bond has the highest frequency since it is the strongest bond. One important feature of this region is that alcohols and carboxylic acids can be easily detected because hydrogen bonding causes band broadening. Extensive hydrogen bonding will cause the width of the O-H band to increase. What was roughly 100 cm-1 in width is now as much as 600 cm-1 in width.
The triple bond region is home to alkynes, at around 2200-2100 cm-1, and nitriles, which are slightly higher. The difference between these two is that a strong bond dipole exists for nitriles due to the electronegativity of N, causes strong bands for nitriles, but weak or moderate bands for alkynes. The double bond region is complex and many types of double bonds exist, such as C=O, C=C, N=O, and C=N. What is most informative is the C=O, also known as the carbonyl functional group. The carbonyl is common to many types of functional groups and their vibrational frequencies come at specific regions of the spectrum, as shown.
Finally, the C-X region is home to single bond vibrations. The problem with this region is its overall complexity. There are so many single bonds in a molecule that this region of the IR spectrum is difficult to interpret. However, just like a fingerprint is unique to each person, the fingerprint region of the IR is unique to each molecule.