The Power of the Fourier Transform for Spectroscopists
- Page ID
- 1785
\( \newcommand{\vecs}[1]{\overset { \scriptstyle \rightharpoonup} {\mathbf{#1}} } \)
\( \newcommand{\vecd}[1]{\overset{-\!-\!\rightharpoonup}{\vphantom{a}\smash {#1}}} \)
\( \newcommand{\id}{\mathrm{id}}\) \( \newcommand{\Span}{\mathrm{span}}\)
( \newcommand{\kernel}{\mathrm{null}\,}\) \( \newcommand{\range}{\mathrm{range}\,}\)
\( \newcommand{\RealPart}{\mathrm{Re}}\) \( \newcommand{\ImaginaryPart}{\mathrm{Im}}\)
\( \newcommand{\Argument}{\mathrm{Arg}}\) \( \newcommand{\norm}[1]{\| #1 \|}\)
\( \newcommand{\inner}[2]{\langle #1, #2 \rangle}\)
\( \newcommand{\Span}{\mathrm{span}}\)
\( \newcommand{\id}{\mathrm{id}}\)
\( \newcommand{\Span}{\mathrm{span}}\)
\( \newcommand{\kernel}{\mathrm{null}\,}\)
\( \newcommand{\range}{\mathrm{range}\,}\)
\( \newcommand{\RealPart}{\mathrm{Re}}\)
\( \newcommand{\ImaginaryPart}{\mathrm{Im}}\)
\( \newcommand{\Argument}{\mathrm{Arg}}\)
\( \newcommand{\norm}[1]{\| #1 \|}\)
\( \newcommand{\inner}[2]{\langle #1, #2 \rangle}\)
\( \newcommand{\Span}{\mathrm{span}}\) \( \newcommand{\AA}{\unicode[.8,0]{x212B}}\)
\( \newcommand{\vectorA}[1]{\vec{#1}} % arrow\)
\( \newcommand{\vectorAt}[1]{\vec{\text{#1}}} % arrow\)
\( \newcommand{\vectorB}[1]{\overset { \scriptstyle \rightharpoonup} {\mathbf{#1}} } \)
\( \newcommand{\vectorC}[1]{\textbf{#1}} \)
\( \newcommand{\vectorD}[1]{\overrightarrow{#1}} \)
\( \newcommand{\vectorDt}[1]{\overrightarrow{\text{#1}}} \)
\( \newcommand{\vectE}[1]{\overset{-\!-\!\rightharpoonup}{\vphantom{a}\smash{\mathbf {#1}}}} \)
\( \newcommand{\vecs}[1]{\overset { \scriptstyle \rightharpoonup} {\mathbf{#1}} } \)
\( \newcommand{\vecd}[1]{\overset{-\!-\!\rightharpoonup}{\vphantom{a}\smash {#1}}} \)
\(\newcommand{\avec}{\mathbf a}\) \(\newcommand{\bvec}{\mathbf b}\) \(\newcommand{\cvec}{\mathbf c}\) \(\newcommand{\dvec}{\mathbf d}\) \(\newcommand{\dtil}{\widetilde{\mathbf d}}\) \(\newcommand{\evec}{\mathbf e}\) \(\newcommand{\fvec}{\mathbf f}\) \(\newcommand{\nvec}{\mathbf n}\) \(\newcommand{\pvec}{\mathbf p}\) \(\newcommand{\qvec}{\mathbf q}\) \(\newcommand{\svec}{\mathbf s}\) \(\newcommand{\tvec}{\mathbf t}\) \(\newcommand{\uvec}{\mathbf u}\) \(\newcommand{\vvec}{\mathbf v}\) \(\newcommand{\wvec}{\mathbf w}\) \(\newcommand{\xvec}{\mathbf x}\) \(\newcommand{\yvec}{\mathbf y}\) \(\newcommand{\zvec}{\mathbf z}\) \(\newcommand{\rvec}{\mathbf r}\) \(\newcommand{\mvec}{\mathbf m}\) \(\newcommand{\zerovec}{\mathbf 0}\) \(\newcommand{\onevec}{\mathbf 1}\) \(\newcommand{\real}{\mathbb R}\) \(\newcommand{\twovec}[2]{\left[\begin{array}{r}#1 \\ #2 \end{array}\right]}\) \(\newcommand{\ctwovec}[2]{\left[\begin{array}{c}#1 \\ #2 \end{array}\right]}\) \(\newcommand{\threevec}[3]{\left[\begin{array}{r}#1 \\ #2 \\ #3 \end{array}\right]}\) \(\newcommand{\cthreevec}[3]{\left[\begin{array}{c}#1 \\ #2 \\ #3 \end{array}\right]}\) \(\newcommand{\fourvec}[4]{\left[\begin{array}{r}#1 \\ #2 \\ #3 \\ #4 \end{array}\right]}\) \(\newcommand{\cfourvec}[4]{\left[\begin{array}{c}#1 \\ #2 \\ #3 \\ #4 \end{array}\right]}\) \(\newcommand{\fivevec}[5]{\left[\begin{array}{r}#1 \\ #2 \\ #3 \\ #4 \\ #5 \\ \end{array}\right]}\) \(\newcommand{\cfivevec}[5]{\left[\begin{array}{c}#1 \\ #2 \\ #3 \\ #4 \\ #5 \\ \end{array}\right]}\) \(\newcommand{\mattwo}[4]{\left[\begin{array}{rr}#1 \amp #2 \\ #3 \amp #4 \\ \end{array}\right]}\) \(\newcommand{\laspan}[1]{\text{Span}\{#1\}}\) \(\newcommand{\bcal}{\cal B}\) \(\newcommand{\ccal}{\cal C}\) \(\newcommand{\scal}{\cal S}\) \(\newcommand{\wcal}{\cal W}\) \(\newcommand{\ecal}{\cal E}\) \(\newcommand{\coords}[2]{\left\{#1\right\}_{#2}}\) \(\newcommand{\gray}[1]{\color{gray}{#1}}\) \(\newcommand{\lgray}[1]{\color{lightgray}{#1}}\) \(\newcommand{\rank}{\operatorname{rank}}\) \(\newcommand{\row}{\text{Row}}\) \(\newcommand{\col}{\text{Col}}\) \(\renewcommand{\row}{\text{Row}}\) \(\newcommand{\nul}{\text{Nul}}\) \(\newcommand{\var}{\text{Var}}\) \(\newcommand{\corr}{\text{corr}}\) \(\newcommand{\len}[1]{\left|#1\right|}\) \(\newcommand{\bbar}{\overline{\bvec}}\) \(\newcommand{\bhat}{\widehat{\bvec}}\) \(\newcommand{\bperp}{\bvec^\perp}\) \(\newcommand{\xhat}{\widehat{\xvec}}\) \(\newcommand{\vhat}{\widehat{\vvec}}\) \(\newcommand{\uhat}{\widehat{\uvec}}\) \(\newcommand{\what}{\widehat{\wvec}}\) \(\newcommand{\Sighat}{\widehat{\Sigma}}\) \(\newcommand{\lt}{<}\) \(\newcommand{\gt}{>}\) \(\newcommand{\amp}{&}\) \(\definecolor{fillinmathshade}{gray}{0.9}\)Fourier transform is a mathematical technique that can be used to transform a function from one real variable to another. It is a unique powerful tool for spectroscopists because a variety of spectroscopic studies are dealing with electromagnetic waves covering a wide range of frequency. In Fourier transform term \(\ e^{ - 2\pi ixy} \ \), when x represents frequency, the corresponding y is time. This provides an alternate way to process signal in time domain instead of the conventional frequency domain. To realize this idea, Fourier transform from time domain to frequency domain is the essential process that enable us to translate raw data to readable spectra. Recent prosperity of Fourier transform in spectroscopy should also attribute to the development of efficient Fast Fourier Transform algorithm.
Introduction
The nature of trigonometric function enables Fourier transform to convert a function from the domain of one variable to another and reconstruct it later on. This is a robust mathematical tool to process data in different domains under different circumstances. Taking this principal idea and applying it in spectroscopy showed many impressive results in the early stage, which in other ways are very difficult to resolve. These benefits triggered a wide exploration of Fourier transform based methodology in a variety of spectroscopic techniques. At the same time, Fourier transform spectroscopic instruments are developed with great efforts by physicists and engineers. All these factors give rise to the wide use of Fourier transform spectroscopy.
In the following topics, the relevant mathematical background, the implementation of Fourier transform in spectroscopy and a brief overview of various Fourier transform Spectrometers will be addressed in sequence.
Fourier Series
The motivation of Fourier transform arises from Fourier series, which was proposed by French mathematician and physicist Joseph Fourier when he tried to analyze the flow and the distribution of energy in solid bodies at the turn of the 19th century. He claimed that the temperature distribution could be described as an infinite series of sines and cosines of the form shown in equation (1):
\[f(x)= \dfrac{a_{0}}{2} + \displaystyle \sum_{n=1}^{\infty} \left(a_{n}\cos\dfrac{n\pi x}{L}+b_{n} \sin \frac{n \pi x}{L}\right) \tag{1}\]
It turns out that this combination of sines and cosines series can be used to express any periodical function. As \(n\) increases, the series will approach to the original function more closely.
If we use Euler's Identity (equation 2), as well as the exponential representations of sine (equation 3} and cosine (equation 4) in our Fourier Series, we will find a natural redefinition of our coefficients \(a_n\) and \(b_n\) into a single complex coefficient C_n (equation 5).
\[ e^{i\theta}=\cos{\theta}+ i\sin{\theta} \tag{2}\]
\[\cos{\theta}=\dfrac{1}{2} (e^{i\theta} + e^{-i\theta}) \tag{3}\]
\[\sin{\theta}=\dfrac{1}{2i} (e^{i\theta} - e^{-i\theta}) \tag{4}\]
\[C_n =\dfrac{1}{2}(C_n-ib_n) \tag{5}\]
Using a bit of clever mathematics (complex conjugation, properties of odd function, rearranging summation set) we can represent our original Fourier series in terms of a complex exponential, shown as equation 6.
\[f(x) = \sum_{n=-\infty}^{\infty} C_n e^{i\theta} \tag{6a}\]
\[\theta = \dfrac{2\pi n x}{L} \tag{6b}\]
Writing the Fourier series in this exponential form helps to simplify many formulas and expressions involved in the transformation.
Fourier Transform
Then we can consider an extreme case, when L in equation 1, the summation becomes an integral as shown in equation (4)
\[ f(x) = \sum\limits_{-\infty} ^\infty c_n e^{n\frac{i\pi x}{L}} = \int_{ -\infty}^\infty c_n e^{n\frac{i\pi x}{L}} dn = \int_{-\infty}^\infty c_n e^{\frac{i\pi xn}{L}} dn \tag{7}\]
This naturally gives the Fourier transform pair of f(x) and F(y). The relationships are shown below :
\[F(y) = \int_{ -\infty }^{ +\infty } {f(x)e^{ - i2\pi yx} dx} \tag{8a}\]
\[f(x) = \int_{ -\infty }^{ +\infty } {F(y)e^{ i2\pi xy} dx} \tag{8b}\]
Another important formula widely used to benefit In other cases, it is used to simplify the integral in the Fourier transform based on the symmetry of the function. But so far, all these are just about mathematics. Its story with spectroscopy should start from the mathematical description of electromagnetic waves.
Mathematical description of electromagnetic waves
Maxwell–Faraday equation and Ampère's circuital law give us electromagnetic wave equations to describe the characteristics of an electromagnetic wave.[1] Using the linearity of Maxwell's equations in a vacuum, the solutions of the equation can be decomposed into a superposition of sinusoids as shown below[3]:
\[E(r,t) = \overrightarrow {E_0 } \cos (2\pi ft - \overrightarrow k \cdot r + \phi _0 ) \tag{9a}\]
\[B(r,t) = \overrightarrow {B_0 } \cos (2\pi ft - \overrightarrow k \cdot r + \phi _0 ) \tag{9b}\]
Where t is time, f is the frequency, k=(kx,ky,kz) is the wave vector and \(\phi\) is the phase angle.
This indicates that electromagnetic wave can be written as the sum of trigonometric functions with specific frequencies. Scientists already discovered the fact that frequency and time is a classic Fourier transform pair in Fourier transform relationship. All the Fourier transform pairs are connected by the Fourier transform term \(e^{ - i2\pi yx}\). Regarding this case, we can use the term to transform between two variables in this pair, namely time and frequency. In this way, we can measure the properties of the electromagnetic wave in both conventional frequency domain and somehow more robust time domain.
Applying Fourier Transform-Fourier Transform Spectroscopy
Fourier transform are widely involved in spectroscopy in all research areas that require high accuracy, sensitivity, and resolution. All these spectroscopic techniques using Fourier transform are considered Fourier transform spectroscopy. By definition, Fourier transform spectroscopy is a spectroscopic technique where interferograms are collected by measurements of the coherence of an electromagnetic radiation source in the time-domain or space-domain, and translated into frequency domain through Fourier transform.
Interferometer-What it is used for and how it works?
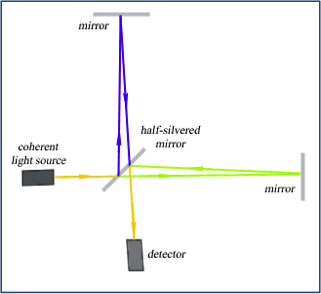
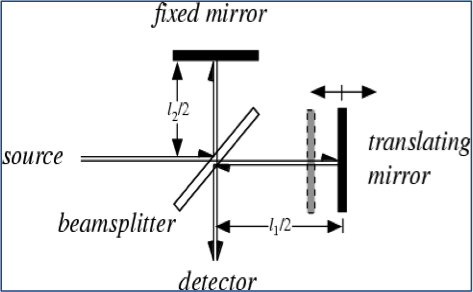
How to introduce a time-domain or space-domain variable in the spectrometer is the primary question that needed to be addressed when we consider constructing a Fourier transform spectrometer. In the experimental set-up, a Michelson interferometer is commonly used to solve this problem. Different from the classical Michelson interferometer with two fixed mirrors (Figure 1.a), the interferometer used in Fourier transform spectrometer has a moving mirror at one arm (Figure 1.b).
a. b.
Figure 1. Scheme for Michelson interferometer [components: coherent light source; half-silvered beam-splitting mirror; two highly polished reflective mirrors; detector] (a) Stationary version [two fixed mirrors] (b) Movable version [One movable mirror and one movable mirror]
As shown in Figure 1.b, when a parallel beam of coherent light hits a half-silvered mirror, it is divided into two beams of equal intensities by partial reflection and transmission. After being reflected back, the two beams meet at the half-silvered mirror and recombine to produce an interference pattern, which is later detected by the detector. Manipulating the difference between these two paths of light is the core of Michelson interferometer. If these two paths differ by a whole number of wavelengths, the resulting constructive interference will give a strong signal at the detector. If they differ by a whole number and a half of wavelengths, destructive interference will cancel the intensity of the signal.
Measuring Interferograms
With a Fourier transform spectrometer equipped with an interferometer, we can easily vary the parameter in time domain or spatial domain by changing the position of the movable mirror.
But how data are collected by a Fourier transform spectrometer? A quick comparison between a conventional spectrometer and a Fourier transform Spectrometer may help to find the answer.
- Conventional spectrometer:
Monochromator is commonly used. It can block off all other wavelengths except for a certain wavelength of interest. Then measuring the intensity of a monochromic light with that particular wavelength becomes practical. To collect the full spectrum over a wide wavelength range, monochromator needs to vary the wavelength setting every time.
- Fourier transform spectrometer:
Rather than allowing only one wavelength to pass through the sample at a time, an interferometer can let through a beam with the whole wavelength range at once, and measure the intensity of the total beam at that optical path difference. Then by changing the position of the moving mirror, a different optical path difference is modified and the detector can measure another intensity of the total beam as the second data point. If the beam is modified for each new data point by scanning the moving mirror along the axis of the moving arm, a series of intensity versus each optical path length difference are collected.
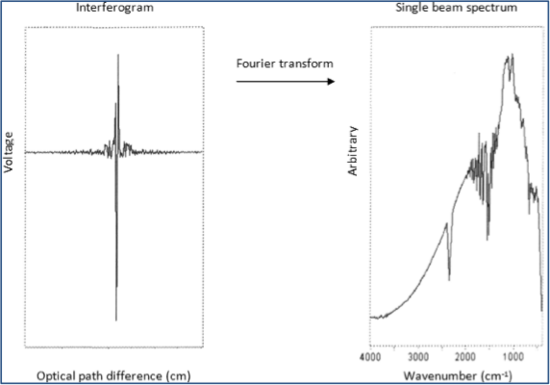
So instead of obtaining a scan spectrum directly, raw data recorded by the detector in a Fourier transform spectrometer is less intuitive to reveal the property of the sample. The raw data is actually the intensity of the interfering wave versus the optical path difference (also called Interferogram). The spectrum of the sample is actually encoded into this interferogram.
Extracting the spectrum from raw data
Based on the previous discussion, it is predictable that, without further translation, the raw data collected on a Fourier transform spectrometer will be quite difficult to read. A Fourier transform needs to be performed to decode interferogram and extract actual spectrum I(\(\overline v\)) from it. The following shows how to conduct a Fourier transform to decode:
The intensity collected by the detector is a function of the path length differences in the interferometer p and wavenumber \(\overline v\)[3]:
\[I(p,\overline v ) = I(\overline v )[1 + \cos (2\pi \overline v p)] \tag{9}\]
Thus, the total intensity measured at a certain optical path length difference (for each data point at a certain optical pathlength difference p) is:
\[I(p) = \int_0^\infty {I(p,\overline v ) = I(\overline v )[1 + \cos (2\pi \overline v p)]} \cdot d\overline v \tag{10}\]
It shows that they have a cosine Fourier transform relationship. So by computing an inverse Fourier transform, we can resolve the desired spectrum in terms of the measured raw data I(p) (10):
\[I(\overline v ) = 4\int_0^\infty {[I(p) - \frac{1} {2}I(p = 0)]} \cos (2\pi \overline v p) \cdot dp \tag{11}\]
An example to illustrate the raw data and the resolved spectrum is also shown in Figure 2.
Figure 2. Fourier transform between interferogram and actual spectrum[4]
The Fast Fourier Transform (FFT)
Fast Fourier Transform (FFT) is a very efficient algorithm to compute Fourier transform. It applies to Discrete Fourier Transform (DFT) and its inverse transform. DFT is a method that decomposes a sequence of signals into a series of components with different frequency or time intervals. This operation is useful in many fields, but in most cases computing it directly from definition is too slow to be practical. Fast Fourier Transform algorithm can help to reduce DFT computation time by several orders of magnitude without losing the accuracy of the result. This benefit becomes more significant when the number of the components is very large. FFT is considered a huge improvement to make many DFT-based algorithms practical. In Fourier transform spectrometer, signals are often collected by a series of optical or digital channels at the detector. Then FFT is of great importance to quickly achieve the following signal processing and data extraction based on DFT method.
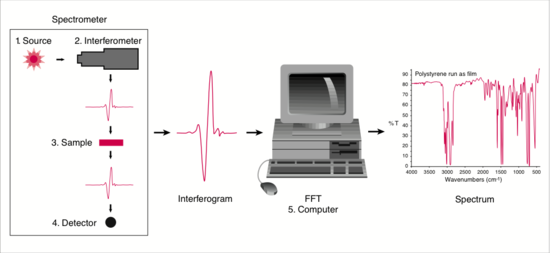
Combining all these steps together, we can take a look at how the data from the sample are processed. The diagram is shown in Figure 3.
Figure 3. Data processing in FTIR
(Figure from ThermoNiolet at mmrc.caltech.edu/FTIR/FTIRintro.pdf)
Different operating modes in Fourier Transform Spectrometer
- Continuous/Scanning FTS
Continuous Fourier transform spectroscopy refers to the scanning form of FTS, in which by step moving one mirror, the whole range of optical path difference is measured. This is the most widely used mode in FTS, like most absorption spectra and emission spectra obtained by FTS.
- Pulsed FTS
In some Fourier transform spectrometers, depending on the feature of the involved spectroscopic technique and purpose of measurement, a pulsed Fourier transform technique may be applied instead of the scanning mode.
Pulsed FTS is different from conventional continuous FTS. It is not based on the transmittance technique, which is widely used in the absorption spectra, like FTIR. Instead, in pulse FTS, the idea is that the sample is first exposed to an energizing event, and this pulse induces a periodic response. The frequency of this response relative to the field strength is determined by the properties of the sample. Using Fourier transform to resolve the frequency will tell the information about the targeted analyte.
Pulse FTS is a relatively new improvement of FTS. Some examples are from pulse-Fourier Transform-Nuclear Magnetic Resonnance (FT-NMR), pulse-Fourier Transform-Electron Paramagnetic Resonnance (FFT-EPR) and Fourier Transform-Mass Spectrometry (FT-MS). Please refer to the following topics for more details about how they work.
- Stationary FTS
In addition to the continuous/scanning mode of FTS, a number of stationary Fourier transform spectrometers are also available to meet special needs.
The principle of the interferometer and the analysis of its output signal is similar to the typical scanning FTS. But the signal is collected at certain optical path length differences rather than scanning over the whole range of the path difference.
An overview of various FTS techniques
Fourier transform spectroscopy can be applied to a variety of regions of spectroscopy and it continues to grow in application and utilization including optical spectroscopy, infrared spectroscopy (IR), nuclear magnetic resonance, electron paramagnetic resonance spectroscopy, mass spectrometry, and magnetic resonance spectroscopic imaging (MRSI). Among them, Fourier Transform Infrared Spectroscopy (FTIR) has been most intensively developed, which uses scanning Fourier transform to measure the mid-IR absorption spectra. .
Nuclear Magnetic Resonance (NMR) and Electron Spin Resonance Spectroscopy (EPR) are two magnetic techniques that use pulse Fourier transform mode. A Radio Frequency Pulse (RF Pulse) in a strong ambient magnetic field background is used as the energizing event. This RF Pulse directs the magnetic particles at an angle to the ambient strong magnetic field, causing gyration of the particle. Then the resulting gyrating spin induces a periodic current in the detector coil. This periodic current is recorded as the signal. Each gyrating spin has a characteristic frequency relative to the strength of the ambient magnetic field, which is also governed by the properties of the sample.
Fourier Transform Mass Spectrometry (MS) is also operated at pulse Fourier transform mode. Different from NMR and EPR, the injection of the charged sample into the strong electromagnetic field of a cyclotron acts as the energizing event in MS. The injected charged particles travel in circles under the strong electromagnetic field. The circular pathway will thus induce a current in a fixed coil at one point in their circle. Each traveling particle exhibits a characteristic cyclotron frequency relative to the field strength, which is determined by the masses in the sample.
References
- R.A. Serway, J.W. Jewett.Principles of physics: a calculus-based text (4th edition), 809
- Maxwell; James Clerk, A Dynamical Theory of the Electromagnetic Field, Philosophical Transactions of the Royal Society of London 155, 459-512 (1865).
- Peter Atkins, Julio De Paula. 2006. Physical Chemistry, 8th ed. Oxford University Press: Oxford, UK.
- Smith, B.C. Fourier Transform Infrared Spectroscopy. Boca Raton: CRC Press Inc,1996
- Bernhard Jaun, Analytische Chemie IV-Structure determination by NMR, 1. Practical aspects of pulse Fourier transform NMR spectroscopy, 1.1-1.21
Outside Links
- Please visit the free source for a consice introductory liquid pulse FT-NMR textbook[5] : www.analytik.ethz.ch/praktika...nmr/ft-nmr.pdf
- Fourier Series en.Wikipedia.org/wiki/Fourier_series
- Electromagnetic wave equation en.Wikipedia.org/wiki/Electro..._wave_equation
- Fourier Transform en.Wikipedia.org/wiki/Fourier_transform
- Fourier Transform Spectroscopy en.Wikipedia.org/wiki/Fourier...m_spectroscopy
- Fast Fourier Transform en.Wikipedia.org/wiki/Fast_Fourier_transform
- Discrete Fourier Transform en.Wikipedia.org/wiki/Discret...rier_transform
Problems
- Search literatures to find the advantages and the limitations of Fourier transform spectroscopic techniques.
- Perform a Fourier transform to show how to extract spectrum, equation (11), from the raw data in equation (10).
- Compare interferometer with monochromator (at least two aspects).
- What are the important components to make Fourier transform spectrometer practical? What are they used for?
- Based on the information introduced in this module, design any one of the Fourier transform spectrometers mentioned in the context.
Solutions
1. Advantages
Firstly, Fourier transform spectrometers have a multiplex advantage (Fellgett advantage) over dispersive spectral detection techniques for signal, but a multiplex disadvantage for noise; Moreover, measurement of a single spectrum is faster(in the FTIR technique) because the information at all frequencies is collected simultaneously. This allows multiple samples to be collected and averaged together also resulting in an improvement in sensitivity; In addition, FT spectrometers are cheaper than conventional spectrometers because building of interferometers is easier than the fabrication of a monochromator (in the FTIR technique). So most commercial IR spectrometers are built based on FTIR techniques.
Limitations: practical frequency regions limited (FT UV-vis is not quite practical)
2. See the following figure for the solution:

3. Interferometer vs. Monochromator
Interometer: a. Collect signal in time or spatial domain; b. Measure all frequencies in the incident beam at one time; c. Determined by the interferometer, raw data from FT spectrometer is an interogram, which needs to be Fourier Transform back to get spectrum.
Monochromator: a. Collect signal in frequency domain; b. Scan each wavelength and measure the intensity for each single wavelength at a time; c. Determined by the feasure of monochromator, spectrum can be directly collected from the spectrometer;
4. Interferometer and Fast Fourier Transform Data Analyzer
Interferometer: to generate continuous optical path length difference and enable the idea to collect data in the time or spatial domain;
Fast Fourier Transform Data Analyzer: to quickly transform the raw data (interferogram) to spectrum by using fast Fourier transform algorithm;
5. FTIR instrumentation: Figure 4
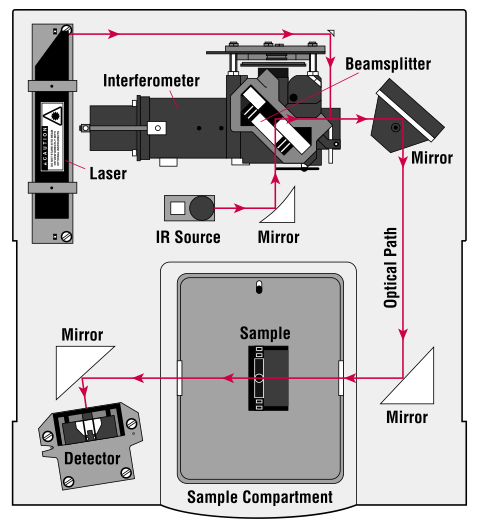
Figure 4. A FTIR Spectrometer Layout (Figure from ThermoNiolet at mmrc.caltech.edu/FTIR/FTIRintro.pdf)
FT-NMR instrumentation:
A modern high resolution liquid FT-NMR instrumentation is shown in Figure 5:
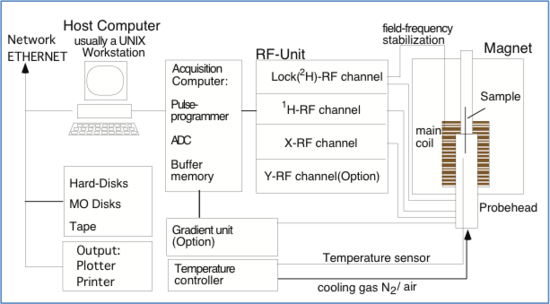
Figure 5. A schematic diagram of liquid FT-NMR[5]


