
8.3: Kinetics and the Mechanisms of Reactions
- Page ID
- 357438

\( \newcommand{\vecs}[1]{\overset { \scriptstyle \rightharpoonup} {\mathbf{#1}} } \)
\( \newcommand{\vecd}[1]{\overset{-\!-\!\rightharpoonup}{\vphantom{a}\smash {#1}}} \)
\( \newcommand{\id}{\mathrm{id}}\) \( \newcommand{\Span}{\mathrm{span}}\)
( \newcommand{\kernel}{\mathrm{null}\,}\) \( \newcommand{\range}{\mathrm{range}\,}\)
\( \newcommand{\RealPart}{\mathrm{Re}}\) \( \newcommand{\ImaginaryPart}{\mathrm{Im}}\)
\( \newcommand{\Argument}{\mathrm{Arg}}\) \( \newcommand{\norm}[1]{\| #1 \|}\)
\( \newcommand{\inner}[2]{\langle #1, #2 \rangle}\)
\( \newcommand{\Span}{\mathrm{span}}\)
\( \newcommand{\id}{\mathrm{id}}\)
\( \newcommand{\Span}{\mathrm{span}}\)
\( \newcommand{\kernel}{\mathrm{null}\,}\)
\( \newcommand{\range}{\mathrm{range}\,}\)
\( \newcommand{\RealPart}{\mathrm{Re}}\)
\( \newcommand{\ImaginaryPart}{\mathrm{Im}}\)
\( \newcommand{\Argument}{\mathrm{Arg}}\)
\( \newcommand{\norm}[1]{\| #1 \|}\)
\( \newcommand{\inner}[2]{\langle #1, #2 \rangle}\)
\( \newcommand{\Span}{\mathrm{span}}\) \( \newcommand{\AA}{\unicode[.8,0]{x212B}}\)
\( \newcommand{\vectorA}[1]{\vec{#1}} % arrow\)
\( \newcommand{\vectorAt}[1]{\vec{\text{#1}}} % arrow\)
\( \newcommand{\vectorB}[1]{\overset { \scriptstyle \rightharpoonup} {\mathbf{#1}} } \)
\( \newcommand{\vectorC}[1]{\textbf{#1}} \)
\( \newcommand{\vectorD}[1]{\overrightarrow{#1}} \)
\( \newcommand{\vectorDt}[1]{\overrightarrow{\text{#1}}} \)
\( \newcommand{\vectE}[1]{\overset{-\!-\!\rightharpoonup}{\vphantom{a}\smash{\mathbf {#1}}}} \)
\( \newcommand{\vecs}[1]{\overset { \scriptstyle \rightharpoonup} {\mathbf{#1}} } \)
\( \newcommand{\vecd}[1]{\overset{-\!-\!\rightharpoonup}{\vphantom{a}\smash {#1}}} \)
\(\newcommand{\avec}{\mathbf a}\) \(\newcommand{\bvec}{\mathbf b}\) \(\newcommand{\cvec}{\mathbf c}\) \(\newcommand{\dvec}{\mathbf d}\) \(\newcommand{\dtil}{\widetilde{\mathbf d}}\) \(\newcommand{\evec}{\mathbf e}\) \(\newcommand{\fvec}{\mathbf f}\) \(\newcommand{\nvec}{\mathbf n}\) \(\newcommand{\pvec}{\mathbf p}\) \(\newcommand{\qvec}{\mathbf q}\) \(\newcommand{\svec}{\mathbf s}\) \(\newcommand{\tvec}{\mathbf t}\) \(\newcommand{\uvec}{\mathbf u}\) \(\newcommand{\vvec}{\mathbf v}\) \(\newcommand{\wvec}{\mathbf w}\) \(\newcommand{\xvec}{\mathbf x}\) \(\newcommand{\yvec}{\mathbf y}\) \(\newcommand{\zvec}{\mathbf z}\) \(\newcommand{\rvec}{\mathbf r}\) \(\newcommand{\mvec}{\mathbf m}\) \(\newcommand{\zerovec}{\mathbf 0}\) \(\newcommand{\onevec}{\mathbf 1}\) \(\newcommand{\real}{\mathbb R}\) \(\newcommand{\twovec}[2]{\left[\begin{array}{r}#1 \\ #2 \end{array}\right]}\) \(\newcommand{\ctwovec}[2]{\left[\begin{array}{c}#1 \\ #2 \end{array}\right]}\) \(\newcommand{\threevec}[3]{\left[\begin{array}{r}#1 \\ #2 \\ #3 \end{array}\right]}\) \(\newcommand{\cthreevec}[3]{\left[\begin{array}{c}#1 \\ #2 \\ #3 \end{array}\right]}\) \(\newcommand{\fourvec}[4]{\left[\begin{array}{r}#1 \\ #2 \\ #3 \\ #4 \end{array}\right]}\) \(\newcommand{\cfourvec}[4]{\left[\begin{array}{c}#1 \\ #2 \\ #3 \\ #4 \end{array}\right]}\) \(\newcommand{\fivevec}[5]{\left[\begin{array}{r}#1 \\ #2 \\ #3 \\ #4 \\ #5 \\ \end{array}\right]}\) \(\newcommand{\cfivevec}[5]{\left[\begin{array}{c}#1 \\ #2 \\ #3 \\ #4 \\ #5 \\ \end{array}\right]}\) \(\newcommand{\mattwo}[4]{\left[\begin{array}{rr}#1 \amp #2 \\ #3 \amp #4 \\ \end{array}\right]}\) \(\newcommand{\laspan}[1]{\text{Span}\{#1\}}\) \(\newcommand{\bcal}{\cal B}\) \(\newcommand{\ccal}{\cal C}\) \(\newcommand{\scal}{\cal S}\) \(\newcommand{\wcal}{\cal W}\) \(\newcommand{\ecal}{\cal E}\) \(\newcommand{\coords}[2]{\left\{#1\right\}_{#2}}\) \(\newcommand{\gray}[1]{\color{gray}{#1}}\) \(\newcommand{\lgray}[1]{\color{lightgray}{#1}}\) \(\newcommand{\rank}{\operatorname{rank}}\) \(\newcommand{\row}{\text{Row}}\) \(\newcommand{\col}{\text{Col}}\) \(\renewcommand{\row}{\text{Row}}\) \(\newcommand{\nul}{\text{Nul}}\) \(\newcommand{\var}{\text{Var}}\) \(\newcommand{\corr}{\text{corr}}\) \(\newcommand{\len}[1]{\left|#1\right|}\) \(\newcommand{\bbar}{\overline{\bvec}}\) \(\newcommand{\bhat}{\widehat{\bvec}}\) \(\newcommand{\bperp}{\bvec^\perp}\) \(\newcommand{\xhat}{\widehat{\xvec}}\) \(\newcommand{\vhat}{\widehat{\vvec}}\) \(\newcommand{\uhat}{\widehat{\uvec}}\) \(\newcommand{\what}{\widehat{\wvec}}\) \(\newcommand{\Sighat}{\widehat{\Sigma}}\) \(\newcommand{\lt}{<}\) \(\newcommand{\gt}{>}\) \(\newcommand{\amp}{&}\) \(\definecolor{fillinmathshade}{gray}{0.9}\)The study of reaction rates, called chemical kinetics, encompasses a wide range of activities, measurements, and calculations. You might wonder why anyone would bother with this, but it turns out that we can use kinetic data to get more information about a reaction than just how fast it goes; we can find out about the pathway that the reaction takes from reactants to products, known as the mechanism of the reaction. If you think about a reaction in molecular terms, it seems clear that there must be a continuous pathway between reactants and products. The reactants do not suddenly disappear and then reappear as products, and in most reactions only one or two bonds are broken and formed as the reaction proceeds. This pathway, or mechanism, denotes the order in which bonds are broken and formed, and the intermediate species involved. However, because we cannot see directly what happens at the molecular level during a reaction, we have to rely on indirect methods to determine what is going on. Even using modern spectroscopic techniques, discussed in more detail in the spectroscopy section, some species in reaction pathways may only be present for femto (\(10^{-15}\)) or atto (\(10^{-18}\)) seconds. Events on these time scales are difficult to study, and in fact much of the current cutting edge research in chemistry and physics is directed at detecting and characterizing such ephemeral molecular-level events. As we will see, information about how the reaction rate varies with concentration and temperature can give us fascinating chemical insights into reaction pathways.
Concentrations and Reaction Rates
As we have seen as the probability of collisions between reactant molecules increases, the rate of reaction increases. In order to get information about the reaction mechanism we need to know the exact relationship between concentrations and rates. This can be done using a number of different techniques and experimental set-ups. But before we do that, we need to go over a few more terms. Recall that the rate of the reaction is the change in concentration of reactant per unit time. If the time interval is measurable and real, the rate we get is called the average rate (over that time interval), as shown in the earlier graph. If we imagine that the time interval drops to 0, we get the instantaneous rate, which is the slope of the tangent to the concentration versus time curve at a given time (more calculus). The rate at the beginning of the reaction can be obtained by taking the tangent at the start of the reaction (\(t = 0\)). This initial rate is useful in many situations because as the reactants form products, these products can interfere with or inhibit the forward reaction. This is particularly true in biological systems, where a product may influence its own formation. For example, it can bind to a site on the enzyme that catalyzes the reaction. This type of interaction is common, and often inhibits the enzyme’s activity (a form of feedback regulation).
We can measure the initial rate for a reaction using different initial concentrations of reactants. Using an appropriate experimental design, we can figure out how the rate of the reaction varies with each reactant. For many common reactions, the relationship between the rate and the concentration is fairly straightforward. For example, in the reaction: \[\left(\mathrm{CH}_{3}\right)_{3} \mathrm{CBr}+{ }^{-} \mathrm{OH}+\mathrm{Na}^{+} \rightleftarrows\left(\mathrm{CH}_{3}\right)_{3} \mathrm{COH}+\mathrm{Br}^{-}+\mathrm{Na}^{+}\]
the rate is dependent only on the concentration of t-butyl bromide \(\left[\left(\mathrm{CH}_{3}\right)_{3}\mathrm{CBr}\right]\), not on the concentration of the sodium ion \(\left[\mathrm{Na}^{+}\right]\) or the hydroxide ion \(\left[{}^{-}\mathrm{OH}\right]\). “But why only the t-butyl bromide?” you might well ask. We will get to that point shortly, because it gives us some very interesting and important insights into the reaction mechanism. First, let us delve into a bit more background.
Because the rate is directly proportional to the \(\left[(\mathrm{CH}_{3})_{3}\mathrm{CBr}\right]\), we can write the relationship between rate and concentration as: \(\text {rate } \propto \left[\left(\mathrm{CH}_{3}\right)_{3} \mathrm{CBr}\right]\), or we can put in a constant (\(k\)) to make the equation: \[\text { rate }=k\left[\left(\mathrm{CH}_{3}\right)_{3} \mathrm{CBr}\right]\]
We could also write \[-\Delta\left[\left(\mathrm{CH}_{3}\right)_{3} \mathrm{CBr}\right] / \Delta \mathrm{t}=k\left[\left(\mathrm{CH}_{3}\right)_{3} \mathrm{CBr}\right] ,\]
or if we let the time interval drop to zero, \[-d\left[\left(\mathrm{CH}_{3}\right)_{3} \mathrm{CBr}\right] / dt=k\left[\left(\mathrm{CH}_{3}\right)_{3} \mathrm{CBr}\right] .\]
In all these forms, the equation is known as the rate equation for the reaction. The rate equation must be experimentally determined. It is worth noting that you cannot write down the rate equation just by considering the reaction equation. (Obviously, in this case, \({}^{-}\mathrm{OH}\) or \(\mathrm{Na}^{+}\) do not appear in the rate equation.) The constant (\(k\)) is known as the rate constant and is completely different from the equilibrium constant (\(\mathrm{K}_{eq}\)). The fact that they are both designated by \(k\) (one lower case and one upper case) is just one of those things we have to note and make sure not to confuse. A rate equation that only contains one concentration is called a first-order rate equation, and the units of the rate constant are 1/time.
Now, in contrast to the first-order reaction of methyl bromide and hydroxide, let us compare the reaction of methyl bromide with hydroxide:[8] \[\mathrm{CH}_{3} \mathrm{Br}+{ }^{-} \mathrm{OH}+\mathrm{Na}^{+} \rightleftarrows \mathrm{CH}_{3} \mathrm{OH}+\mathrm{Br}^{-}+\mathrm{Na}^{+} ,\]
For all intents and purposes, this reaction appears to be exactly the same as the one discussed on the previous page. That is, the bromine that was bonded to a carbon has been replaced by the oxygen of hydroxide.[9] However, if we run the experiments, we find that the reaction rate depends on both the methyl bromide concentration \(\left[\mathrm{CH}_{3}\mathrm{Br}\right]\) and on the hydroxide concentration \(\left[{}^{-}\mathrm{OH}\right]\). The rate equation is equal to \(\mathrm{k}\left[\mathrm{CH}_{3} \mathrm{Br}\right]\left[^{-}\mathrm{OH}\right]\). How can this be? Why the difference? Well, the first thing it tells us is that something different is going on at the molecular level; the mechanisms of these reactions are different.
Reactions that depend on the concentrations of two different reactants are called second-order reactions, and the units of \(k\) are different (you can figure out what they are by dimensional analysis). In general: \[\begin{aligned}
&\text { rate }= k[\mathrm{A}] \text { first order} \\
&\text { rate }=k[\mathrm{A}][\mathrm{B}] \text { second order (first order in} \mathrm{~A} \text { and first order in} \mathrm{~B}) \\
&\text { rate }=k[\mathrm{A}]^{2} \text { second order (in} \mathrm{~A}) \\
&\text { rate }=k[\mathrm{A}]^{2}[\mathrm{B}] \text { third order (second order in} \mathrm{~A} \text { and first order in} \mathrm{~B}). \\
\end{aligned}\]
There are a number of methods for determining the rate equation for a reaction. Here we will consider just two. One method is known as the method of initial rates. The initial rate of the reaction is determined for various different starting concentrations of reactants. Clearly, the experimental design is of paramount importance here. Let us say you are investigating our reaction \(\mathrm{A} + \mathrm{~B} \rightleftarrows 2\mathrm{AB}\). The rate may depend on \([\mathrm{A}]\) and/or \([\mathrm{B}]\). Therefore, the initial concentrations of \([\mathrm{A}]\) and \([\mathrm{B}]\) must be carefully controlled. If \([\mathrm{A}]\) is changed in a reaction trial, then \([\mathrm{B}]\) must be held constant, and vice versa (you cannot change both concentrations at the same time because you would not know how each one affects the rate).
The method of initial rates requires running the experiment multiple times using different starting concentrations. By contrast, the graphical method involves determining the rate equation from only one run of the reaction. This method requires the collection of a set of concentration versus time data (the same data that you would collect to determine the rates). Ideally we would like to manipulate the data so that we can obtain a linear equation (\(y = mx + b\)). For example, if we have a set of \([\mathrm{A}]\) versus time data for a reaction, and we assume the reaction is first order in \(\mathrm{A}\), then we can write the rate equation as: \(-d[\mathrm{A}] / dt=k[\mathrm{A}]\).
Now, if we separate the variables \([\mathrm{A}]\) and \(t\) to get: \(-d[\mathrm{A}] / [\mathrm{A}] = kt\). We can then integrate the equation over the time period \(t = 0\) to \(t = t\) to arrive at: \[\ln [\mathrm{A}]_{t}=-kt+[\mathrm{A}]_{0} .\]
link associated with the equation above.[10]
You will notice that this equation has the form of a straight line; if we plot our data (\(\ln [\mathrm{A}]\) versus \(t\)) and if the reaction is first order in \([\mathrm{A}]\), then we should get a straight line, where the slope of the line is \(–k\). We can do a similar analysis for a reaction that might be second order in \([\mathrm{A}]\): \[\text{rate } = k[\mathrm{A}]^{2} .\]
In this case, we can manipulate the rate equation and integrate to give the equation: \[1 /[\mathrm{A}]_{t}=kt+1 /[\mathrm{A}]_{0}\]
Therefore, plotting \(1/[\mathrm{A}]\) versus \(t\) would give a straight line, with a slope of \(k\), the rate constant. This method of analysis quickly becomes too complex for reactions with more than one reactant (in other words, reactions with rates that depend on both \([\mathrm{A}]\) and \([\mathrm{B}]\)), but you can look forward to that in your later studies!
| Order | Rate Law | Integrated Rate Law | Graph for Straight Line | Slope of Line |
| 0 | \(\text{rate } = k\) | \([\mathrm{A}]_{t} =-kt + [\mathrm{A}]_{0}\) | \([\mathrm{A}]\) vs. \(t\) | \(–k\) |
| 1 | \(\text{rate } = k[\mathrm{A}]\) | \(\ln [\mathrm{A}]_{t}=-kt+[\mathrm{A}]_{0}\) | \(\ln [\mathrm{A}]\) vs. \(t\) | \(–k\) |
| 2 | \(\text{rate } = k[\mathrm{A}]^{2}\) | \(1 /[\mathrm{A}]_{t}=kt+1 /[\mathrm{A}]_{0}\) | \(1/[\mathrm{A}]\) vs. \(t\) | \(k\) |
The two approaches (multiple runs with different initial conditions and the graphical method finding the best line to fit the data) provide us with the rate law. The question is, what does the rate law tell us about the mechanism? We will return to this question at the end of this chapter.
Questions to Answer
- It turns out that most simple reactions are first or second order. Can you think why?
- Design an experiment to determine the rate equation for a reaction \(2\mathrm{A} + \mathrm{B} \rightleftarrows \mathrm{C}\). Using the method of initial rates and a first experimental run using \(0.1-\mathrm{M}\) concentrations of all the reactants, outline the other sets of conditions you would use to figure out what that rate equation is.
- What is the minimum number of runs of the reaction that you would have to do?
- How would you determine the rate for each of your sets of conditions?
- Now imagine you have determined that this reaction \(2\mathrm{A} + \mathrm{B} \rightleftarrows \mathrm{C}\) does not depend on \([\mathrm{B}]\). Outline a graphical method you could use to determine the rate equation. What data would you have to collect? What would you do with it?
Questions for Later
- Why do you think it is that we cannot just write the rate equation from the reaction equation?
- Why do you think that the most common rate equations are second order?
Temperature and Reaction Rates
Temperature is another important factor when we consider reaction rates. This makes sense if you remember that the vast majority of reactions involve collisions and that the effects of collisions are influenced by how fast the colliding objects are moving. We know intuitively that heating things up tends to make things happen faster. For example, if you want something to cook faster you heat it to a higher temperature (and cooking, as we know, is just a series of chemical reactions). Why is this so? If we consider the reaction of hydrogen and oxygen, discussed in Chapter \(7\), which is a highly exothermic reaction—explosive, in fact. Yet a mixture of hydrogen and oxygen is quite stable unless energy is supplied, either by heating or a spark of electricity. The same is true of wood and molecular oxygen. The question is: What is the initial spark of energy being used for?
The answer lies within one of the principles that we have returned to over and over again: When atoms form bonds, the result is a more stable system, compared to the energy of non-bonded atoms. But not all bonds are equally stable; some are more stable than others. Nevertheless, energy is always required to disrupt a bond—any bond. If a reaction is to take place, then at least one of the bonds present in the reactants must be broken, and this requires energy.
Imagine two reactants approaching each other. As the reaction starts to occur, the first thing that happens is that at least one bond in a reactant molecule must start to break. It is the initial, partial-bond-breaking step that requires an input of energy from the molecule’s surroundings, and the amount of energy required and available will determine if the reaction occurs. If the amount of energy in the environment is not enough to begin the breaking of bonds in the reactants (for example, in the burning of wood, large amounts of energy are required for the initial bond breaking), then the reaction will not occur without an energy “push”. Wood does not just burst into flames (at least at standard temperatures)—and neither do humans.[11] The burning wood reaction, \(\text{wood } + \mathrm{O}_{2} \rightleftarrows \mathrm{H}_{2}\mathrm{O} + \mathrm{CO}_{2}\), does not occur under normal conditions, but if the temperature increases enough, the reaction starts. Once the reaction starts, however, the energy released from the formation of new bonds is sufficient to raise the local temperature and lead to the breaking of more bonds, the formation of new ones, and the release of more energy. As long as there is wood and oxygen available, the system behaves as a positive and self-sustaining feedback loop. The reaction will stop if one of the reactants becomes used up or the temperature is lowered.
It is the activation energy associated with reactions that is responsible for the stability of our world. For example, we live in an atmosphere of \(\sim 20 \%\) oxygen (\(\mathrm{O}_{2}\)). There are many molecules in our bodies and in our environment that can react with \(\mathrm{O}_{2}\). If there were no energy barriers to combustion (i.e., reaction with \(\mathrm{O}_{2}\)), we would burst into flames. Sadly, as Salem witches and others would have attested (if they could have), raise the temperature and we do burn. And once we start burning, it is hard to stop the reaction. As we have said before, combustion reactions are exothermic. Once they have produced enough thermal energy, the reaction doesn’t need that spark any more. But that initial spark needs the addition of energy (such as the kind provided by a detonator) for explosions to occur.

If we plot energy versus the progress of the reaction, we can get a picture of the energy changes that go on during the reaction. Remember that the reaction coordinate on the x-axis is not time; we have seen that reactions go backwards and forwards all the time. For a simple one-step reaction as shown in the figure, the highest point on the energy profile is called the transition state. It is not a stable entity and only exists on the timescale of molecular vibrations (femtoseconds). The energy change between the reactants and the transition state is called the activation energy. This is the energy that must be supplied to the reactants before the reaction can occur. This activation energy barrier is why, for example, we can mix hydrogen and oxygen and they will not explode until we supply a spark, and why we can pump gasoline in an atmosphere that contains oxygen, even though we know that gasoline and oxygen can also explode. The amount of energy that must be supplied to bring about a reaction is a function of the type of reaction, some reactions (acid base) have low activation energies and correspondingly high rates, and some (rusting) have high activation energies and low rates.
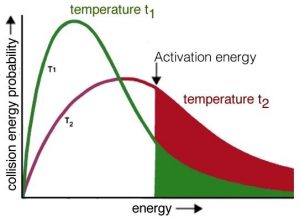
Now it should be easier to understand how increasing temperature increases the reaction rate—by increasing the average kinetic energy of the molecules in the environment. Recall that even though individual molecules have different kinetic energies, all of the different populations of molecules in a system have the same average kinetic energy. If we consider the effect of temperature on the Maxwell–Boltzmann distribution of kinetic energies, we see right away that at higher temperatures there are relatively more molecules with higher kinetic energy. Collisions between these high-energy molecules provide the energy needed to overcome the activation energy barrier, that is, the minimum energy required to start a chemical reaction. As the temperature rises, the probability of productive collisions between particles per unit time increases, thus increasing the reaction rate. At the same time, it is possible that raising the temperature will allow other reactions to occur (perhaps reactions we have not been considering). This is particularly likely if we are dealing with complex mixtures of different types of molecules.
The rate equation does not appear to contain a term for temperature, and typically we have to specify the temperature at which the rate is measured. However, because the rate changes with temperature, it must be the rate constant that changes. Sure enough, it has been determined experimentally that the rate constant is \(k\) can be described by the equation \[k=\mathrm{A}e^{-\mathrm{E}_{a} / \mathrm{RT}} ,\]
where \(k\) is the rate constant, \(\mahtrm{E_{a}\) is the activation energy, \(\mathrm{T}\) is the temperature, and \(\mathrm{R}\) and \(\mathrm{A}\) are constants.[12] This is known as the Arrhenius equation. As you can see, \(k\) is directly proportional to the temperature, and indirectly proportional to the activation energy \(\mathrm{E}_{a}\). The constant \(\mathrm{A}\) is sometimes called the frequency factor and has to do with the collision rate. \(\mathrm{A}\) changes depending on the specific type of reaction (unlike \(\mathrm{R}\), the gas constant, which does not change from reaction to reaction). One way of thinking about the rate constant is to consider it as a representation of the probability that a collision will lead to products: the larger the rate constant, the more frequently productive collisions occur and the faster the reaction.
The activation energy for a reaction also depends upon the type of reaction that is occurring. For example, a Brønsted–Lowry acid–base reaction has a very low activation energy barrier. In these reactions the only thing that is happening is that a proton is being transferred from one electronegative element to another: \[\mathrm{H-Cl}+\mathrm{H-O-H} \rightleftarrows \mathrm{Cl}^{-}+\mathrm{H}_{3} \mathrm{O}^{+}\]
(draw this out to better see what is happening).
The reaction is rapid because the \(\mathrm{Cl—H}\) bond is highly polarized and weak. In a sense, it is already partially broken. Also, these reactions usually take place in water, which interacts with and stabilizes the growing charges. Low-energy collisions with water molecules are sufficient to finish breaking the \(\mathrm{Cl—H}\) bond. We say that acid–base reactions like this are kinetically controlled because they occur upon mixing and do not require heating up or extra energy to proceed. Essentially all collisions involving the \(\mathrm{HCl}\) molecule provide sufficient energy to break the \(\mathrm{H—Cl}\) bond. This is also true for almost all proton-transfer reactions. However, for most other types of reactions, simply mixing the reactants is not enough. Energy must be supplied to the system to overcome this energy barrier, or we have to wait a long time for the reaction to occur. In fact, most organic reactions (those in which carbon is involved) are quite slow. Why the difference? The answer should be reasonably obvious. There is simply not enough energy in the vast majority of the collisions between molecules to break a \(\mathrm{C—H}\), \(\mathrm{C—C}\), \(\mathrm{C—N}\), or \(\mathrm{C—O}\) bond. If you take organic chemistry lab, you will discover that large portions of time are spent waiting as solutions are heated to make reactions happen faster. As we mentioned before, this is quite fortunate. As we mentioned before, this is quite fortunate, since we are (basically) organized by chance and natural selection, from collections of organic reactions. If these reactions occurred spontaneously and rapidly, we would fall apart and approach equilibrium (and equilibrium for living things means death!). You may already see the potential problem in all of this: it is generally not advisable to heat up a biological system, but we certainly need biological systems to undergo reactions. Biological systems need different reactions to proceed in different places and at different rates, without being heated up. For this, biological systems (and many other types of systems) use a wide range of catalysts, the topic of our next section.
Questions to Answer:
- When a reaction releases energy, where does the energy come from?
- There is a rule of thumb that increasing the temperature by \(10^{\circ}\mathrm{C}\) will double the rate for many reactions.
- What factor in the Arrhenius equation is always changing?
- Explain why the reaction rate increases when the temperature increases.