
2.3: Exploring Atomic Organization Using Spectroscopy
- Page ID
- 355151

\( \newcommand{\vecs}[1]{\overset { \scriptstyle \rightharpoonup} {\mathbf{#1}} } \)
\( \newcommand{\vecd}[1]{\overset{-\!-\!\rightharpoonup}{\vphantom{a}\smash {#1}}} \)
\( \newcommand{\id}{\mathrm{id}}\) \( \newcommand{\Span}{\mathrm{span}}\)
( \newcommand{\kernel}{\mathrm{null}\,}\) \( \newcommand{\range}{\mathrm{range}\,}\)
\( \newcommand{\RealPart}{\mathrm{Re}}\) \( \newcommand{\ImaginaryPart}{\mathrm{Im}}\)
\( \newcommand{\Argument}{\mathrm{Arg}}\) \( \newcommand{\norm}[1]{\| #1 \|}\)
\( \newcommand{\inner}[2]{\langle #1, #2 \rangle}\)
\( \newcommand{\Span}{\mathrm{span}}\)
\( \newcommand{\id}{\mathrm{id}}\)
\( \newcommand{\Span}{\mathrm{span}}\)
\( \newcommand{\kernel}{\mathrm{null}\,}\)
\( \newcommand{\range}{\mathrm{range}\,}\)
\( \newcommand{\RealPart}{\mathrm{Re}}\)
\( \newcommand{\ImaginaryPart}{\mathrm{Im}}\)
\( \newcommand{\Argument}{\mathrm{Arg}}\)
\( \newcommand{\norm}[1]{\| #1 \|}\)
\( \newcommand{\inner}[2]{\langle #1, #2 \rangle}\)
\( \newcommand{\Span}{\mathrm{span}}\) \( \newcommand{\AA}{\unicode[.8,0]{x212B}}\)
\( \newcommand{\vectorA}[1]{\vec{#1}} % arrow\)
\( \newcommand{\vectorAt}[1]{\vec{\text{#1}}} % arrow\)
\( \newcommand{\vectorB}[1]{\overset { \scriptstyle \rightharpoonup} {\mathbf{#1}} } \)
\( \newcommand{\vectorC}[1]{\textbf{#1}} \)
\( \newcommand{\vectorD}[1]{\overrightarrow{#1}} \)
\( \newcommand{\vectorDt}[1]{\overrightarrow{\text{#1}}} \)
\( \newcommand{\vectE}[1]{\overset{-\!-\!\rightharpoonup}{\vphantom{a}\smash{\mathbf {#1}}}} \)
\( \newcommand{\vecs}[1]{\overset { \scriptstyle \rightharpoonup} {\mathbf{#1}} } \)
\( \newcommand{\vecd}[1]{\overset{-\!-\!\rightharpoonup}{\vphantom{a}\smash {#1}}} \)
\(\newcommand{\avec}{\mathbf a}\) \(\newcommand{\bvec}{\mathbf b}\) \(\newcommand{\cvec}{\mathbf c}\) \(\newcommand{\dvec}{\mathbf d}\) \(\newcommand{\dtil}{\widetilde{\mathbf d}}\) \(\newcommand{\evec}{\mathbf e}\) \(\newcommand{\fvec}{\mathbf f}\) \(\newcommand{\nvec}{\mathbf n}\) \(\newcommand{\pvec}{\mathbf p}\) \(\newcommand{\qvec}{\mathbf q}\) \(\newcommand{\svec}{\mathbf s}\) \(\newcommand{\tvec}{\mathbf t}\) \(\newcommand{\uvec}{\mathbf u}\) \(\newcommand{\vvec}{\mathbf v}\) \(\newcommand{\wvec}{\mathbf w}\) \(\newcommand{\xvec}{\mathbf x}\) \(\newcommand{\yvec}{\mathbf y}\) \(\newcommand{\zvec}{\mathbf z}\) \(\newcommand{\rvec}{\mathbf r}\) \(\newcommand{\mvec}{\mathbf m}\) \(\newcommand{\zerovec}{\mathbf 0}\) \(\newcommand{\onevec}{\mathbf 1}\) \(\newcommand{\real}{\mathbb R}\) \(\newcommand{\twovec}[2]{\left[\begin{array}{r}#1 \\ #2 \end{array}\right]}\) \(\newcommand{\ctwovec}[2]{\left[\begin{array}{c}#1 \\ #2 \end{array}\right]}\) \(\newcommand{\threevec}[3]{\left[\begin{array}{r}#1 \\ #2 \\ #3 \end{array}\right]}\) \(\newcommand{\cthreevec}[3]{\left[\begin{array}{c}#1 \\ #2 \\ #3 \end{array}\right]}\) \(\newcommand{\fourvec}[4]{\left[\begin{array}{r}#1 \\ #2 \\ #3 \\ #4 \end{array}\right]}\) \(\newcommand{\cfourvec}[4]{\left[\begin{array}{c}#1 \\ #2 \\ #3 \\ #4 \end{array}\right]}\) \(\newcommand{\fivevec}[5]{\left[\begin{array}{r}#1 \\ #2 \\ #3 \\ #4 \\ #5 \\ \end{array}\right]}\) \(\newcommand{\cfivevec}[5]{\left[\begin{array}{c}#1 \\ #2 \\ #3 \\ #4 \\ #5 \\ \end{array}\right]}\) \(\newcommand{\mattwo}[4]{\left[\begin{array}{rr}#1 \amp #2 \\ #3 \amp #4 \\ \end{array}\right]}\) \(\newcommand{\laspan}[1]{\text{Span}\{#1\}}\) \(\newcommand{\bcal}{\cal B}\) \(\newcommand{\ccal}{\cal C}\) \(\newcommand{\scal}{\cal S}\) \(\newcommand{\wcal}{\cal W}\) \(\newcommand{\ecal}{\cal E}\) \(\newcommand{\coords}[2]{\left\{#1\right\}_{#2}}\) \(\newcommand{\gray}[1]{\color{gray}{#1}}\) \(\newcommand{\lgray}[1]{\color{lightgray}{#1}}\) \(\newcommand{\rank}{\operatorname{rank}}\) \(\newcommand{\row}{\text{Row}}\) \(\newcommand{\col}{\text{Col}}\) \(\renewcommand{\row}{\text{Row}}\) \(\newcommand{\nul}{\text{Nul}}\) \(\newcommand{\var}{\text{Var}}\) \(\newcommand{\corr}{\text{corr}}\) \(\newcommand{\len}[1]{\left|#1\right|}\) \(\newcommand{\bbar}{\overline{\bvec}}\) \(\newcommand{\bhat}{\widehat{\bvec}}\) \(\newcommand{\bperp}{\bvec^\perp}\) \(\newcommand{\xhat}{\widehat{\xvec}}\) \(\newcommand{\vhat}{\widehat{\vvec}}\) \(\newcommand{\uhat}{\widehat{\uvec}}\) \(\newcommand{\what}{\widehat{\wvec}}\) \(\newcommand{\Sighat}{\widehat{\Sigma}}\) \(\newcommand{\lt}{<}\) \(\newcommand{\gt}{>}\) \(\newcommand{\amp}{&}\) \(\definecolor{fillinmathshade}{gray}{0.9}\)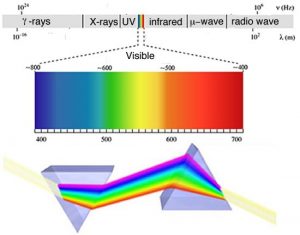
As we will often see, there are times when an old observation suddenly fits into and helps clarify a new way of thinking about a problem or process. In order to understand the behavior of electrons within atoms scientists brought together a number of such observations. The first observation has its roots in understanding the cause of rainbows. The scientific explanation of the rainbow is based on the fact that light of different wavelengths is bent through different angles (refracted) when it passes through an air–water interface. When sunlight passes through approximately spherical water droplets, it is refracted at the air–water interface, partially reflected (note the difference) from the backside of the water droplet, and then refracted again as it leaves the droplet. The underlying fact that makes rainbows possible is that sunlight is composed of photons with an essentially continuous distribution of visible wavelengths. Isaac Newton illustrated this nicely by using a pair of prisms to show that white light could be separated into light of many different colors by passing it through a prism and then recombined back into white light by passing it through a second prism. On the other hand, light of a single color remained that color, even after it passed through a second prism.
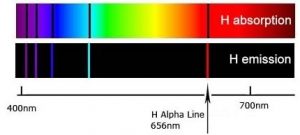
When a dense body, like the Sun or the filament of an incandescent light bulb, is heated, it emits light of many wavelengths (colors)—essentially all wavelengths in the visible range. However, when a sample of an element or mixture of elements is heated, for example in a flame provided by a Bunsen burner, it emits light of only very particular wavelengths. The different wavelengths present in the emitted light can be separated from one another using a prism to produce what is known as an emission spectra. When projected on a screen these appear as distinct, bright-colored lines, known emission lines. In a complementary manner, if white light, which consists of a continuous distribution of wavelengths of light, is passed through a cold gaseous element the same wavelengths that were previously emitted by the heated element will be absorbed, while all other wavelengths will pass through unaltered. By passing the light through a prism we can see which wavelengths of light have been absorbed by the gas. We call these dark areas “absorption” lines within the otherwise continuous spectrum. The emission and absorption wavelengths for each element the same and unique for each element. Emission and absorption phenomenon provide a method (spectroscopy) by which the absorbance or emission of specific wavelengths of light by can be is used to study the composition and properties of matter. Scientists used spectroscopic methods to identify helium, from the Greek “sun”, in the Sun before it was isolated on Earth.
In the 1800s, it became increasingly clear that each element, even the simplest, hydrogen, has a distinctive and often quite complex emission/absorption spectra. In 1855 Johann Balmer (1825-1898) calculated the position of the lines in the visible region. In 1888 Johannes Rydberg (1854-1919) extended those calculations to the entire spectrum. These calculations, however, were based on an empirical formula and it was unclear why this formula worked or what features of the atom it was based on—this made the calculations rather unsatisfying. Although useful, they provided no insight into the workings of atoms.
Making sense of spectra:
How do we make sense of these observations? Perhaps the most important clue is again the photoelectric effect; that is, the observation that illuminating materials with light can in some circumstances lead to the ejection of electrons. This suggests that it is the interactions between light and the electrons in atoms that are important. Using this idea and the evidence from the hydrogen spectra Niels Bohr (1885-1962) proposed a new model for the atom His first hypothesis was that the electrons within an atom can only travel along certain orbits at a fixed distance from the nucleus, each orbit corresponding to a specific energy. The second idea was that electrons can jump from one orbit to another, but this jump requires either the capture (absorption) or release (emission) of energy, in the form of a photon. An electron can move between orbits only if a photon of exactly the right amount of energy is absorbed (lower to higher) or emitted (higher to lower). Lower (more stable) orbits are often visualized as being closer to the nucleus whereas higher, less stable and more energetic orbits are further away. Only when enough energy is added in a single packet is the electron removed completely from the atom, leaving a positively-charged ion (an ion is an atom or molecule that has a different number of protons and electrons) and a free electron. Because the difference in energy between orbits is different in different types of atoms, moving electrons between different orbits requires photons carrying different amounts of energy (different wavelengths).
Bohr’s model worked well for hydrogen atoms; in fact, he could account for and accurately calculate the wavelengths for all of hydrogen’s observed emission/absorption lines. These calculations involved an integer quantum number that corresponded to the different energy levels of the orbits.[11] Unfortunately, this model was not able to predict the emission/absorption spectrum for any other element, including helium and certainly not for any molecule. Apparently Bohr was on the right track—because every element does have a unique spectrum and therefore electrons must be transitioning from one energy level to another—but his model was missing something important. It was not at all clear what restricted electrons to specific energy levels. What happens in atoms with more than one electron? Where are those electrons situated and what governs their behavior and interactions? It is worth remembering that even though the Bohr model of electrons orbiting the nucleus is often used as a visual representation of an atom, it is not correct. Electrons do not circle the nucleus in defined orbits. Bohr’s model only serves as an approximate visual model for appearance of an atom–it is not how electrons actually behave!
Questions to Answer
- If the intensity of a beam of light is related to the number of photons passing per second, how would you explain intensity using the model of light as a wave? What would change and what would stay the same?
- Why do we not worry about being constantly bombarded by radio waves (we are), but yet we guard our exposure to x rays?
- Draw a picture of what you imagine is happening during the photoelectric effect.
- Is the energy required to eject an electron the same for every metal?
Questions to Ponder
- Can you think of other scientific ideas that you find nonsensical? Be honest.
- How does the idea of an electron as a wave fit with your mental image of an atom?
- Where is the electron if it is a wave?
Questions for Later
- What trends might you expect in the energies required to eject an electron?
- Why do you think this phenomenon (the photoelectric effect) is most often seen with metals? What property of metals is being exploited here?
- What other kinds of materials might produce a similar effect?