
15.2: Instruments for Measuring Fluorescence and Phosphorescence
- Page ID
- 366515

\( \newcommand{\vecs}[1]{\overset { \scriptstyle \rightharpoonup} {\mathbf{#1}} } \)
\( \newcommand{\vecd}[1]{\overset{-\!-\!\rightharpoonup}{\vphantom{a}\smash {#1}}} \)
\( \newcommand{\id}{\mathrm{id}}\) \( \newcommand{\Span}{\mathrm{span}}\)
( \newcommand{\kernel}{\mathrm{null}\,}\) \( \newcommand{\range}{\mathrm{range}\,}\)
\( \newcommand{\RealPart}{\mathrm{Re}}\) \( \newcommand{\ImaginaryPart}{\mathrm{Im}}\)
\( \newcommand{\Argument}{\mathrm{Arg}}\) \( \newcommand{\norm}[1]{\| #1 \|}\)
\( \newcommand{\inner}[2]{\langle #1, #2 \rangle}\)
\( \newcommand{\Span}{\mathrm{span}}\)
\( \newcommand{\id}{\mathrm{id}}\)
\( \newcommand{\Span}{\mathrm{span}}\)
\( \newcommand{\kernel}{\mathrm{null}\,}\)
\( \newcommand{\range}{\mathrm{range}\,}\)
\( \newcommand{\RealPart}{\mathrm{Re}}\)
\( \newcommand{\ImaginaryPart}{\mathrm{Im}}\)
\( \newcommand{\Argument}{\mathrm{Arg}}\)
\( \newcommand{\norm}[1]{\| #1 \|}\)
\( \newcommand{\inner}[2]{\langle #1, #2 \rangle}\)
\( \newcommand{\Span}{\mathrm{span}}\) \( \newcommand{\AA}{\unicode[.8,0]{x212B}}\)
\( \newcommand{\vectorA}[1]{\vec{#1}} % arrow\)
\( \newcommand{\vectorAt}[1]{\vec{\text{#1}}} % arrow\)
\( \newcommand{\vectorB}[1]{\overset { \scriptstyle \rightharpoonup} {\mathbf{#1}} } \)
\( \newcommand{\vectorC}[1]{\textbf{#1}} \)
\( \newcommand{\vectorD}[1]{\overrightarrow{#1}} \)
\( \newcommand{\vectorDt}[1]{\overrightarrow{\text{#1}}} \)
\( \newcommand{\vectE}[1]{\overset{-\!-\!\rightharpoonup}{\vphantom{a}\smash{\mathbf {#1}}}} \)
\( \newcommand{\vecs}[1]{\overset { \scriptstyle \rightharpoonup} {\mathbf{#1}} } \)
\( \newcommand{\vecd}[1]{\overset{-\!-\!\rightharpoonup}{\vphantom{a}\smash {#1}}} \)
\(\newcommand{\avec}{\mathbf a}\) \(\newcommand{\bvec}{\mathbf b}\) \(\newcommand{\cvec}{\mathbf c}\) \(\newcommand{\dvec}{\mathbf d}\) \(\newcommand{\dtil}{\widetilde{\mathbf d}}\) \(\newcommand{\evec}{\mathbf e}\) \(\newcommand{\fvec}{\mathbf f}\) \(\newcommand{\nvec}{\mathbf n}\) \(\newcommand{\pvec}{\mathbf p}\) \(\newcommand{\qvec}{\mathbf q}\) \(\newcommand{\svec}{\mathbf s}\) \(\newcommand{\tvec}{\mathbf t}\) \(\newcommand{\uvec}{\mathbf u}\) \(\newcommand{\vvec}{\mathbf v}\) \(\newcommand{\wvec}{\mathbf w}\) \(\newcommand{\xvec}{\mathbf x}\) \(\newcommand{\yvec}{\mathbf y}\) \(\newcommand{\zvec}{\mathbf z}\) \(\newcommand{\rvec}{\mathbf r}\) \(\newcommand{\mvec}{\mathbf m}\) \(\newcommand{\zerovec}{\mathbf 0}\) \(\newcommand{\onevec}{\mathbf 1}\) \(\newcommand{\real}{\mathbb R}\) \(\newcommand{\twovec}[2]{\left[\begin{array}{r}#1 \\ #2 \end{array}\right]}\) \(\newcommand{\ctwovec}[2]{\left[\begin{array}{c}#1 \\ #2 \end{array}\right]}\) \(\newcommand{\threevec}[3]{\left[\begin{array}{r}#1 \\ #2 \\ #3 \end{array}\right]}\) \(\newcommand{\cthreevec}[3]{\left[\begin{array}{c}#1 \\ #2 \\ #3 \end{array}\right]}\) \(\newcommand{\fourvec}[4]{\left[\begin{array}{r}#1 \\ #2 \\ #3 \\ #4 \end{array}\right]}\) \(\newcommand{\cfourvec}[4]{\left[\begin{array}{c}#1 \\ #2 \\ #3 \\ #4 \end{array}\right]}\) \(\newcommand{\fivevec}[5]{\left[\begin{array}{r}#1 \\ #2 \\ #3 \\ #4 \\ #5 \\ \end{array}\right]}\) \(\newcommand{\cfivevec}[5]{\left[\begin{array}{c}#1 \\ #2 \\ #3 \\ #4 \\ #5 \\ \end{array}\right]}\) \(\newcommand{\mattwo}[4]{\left[\begin{array}{rr}#1 \amp #2 \\ #3 \amp #4 \\ \end{array}\right]}\) \(\newcommand{\laspan}[1]{\text{Span}\{#1\}}\) \(\newcommand{\bcal}{\cal B}\) \(\newcommand{\ccal}{\cal C}\) \(\newcommand{\scal}{\cal S}\) \(\newcommand{\wcal}{\cal W}\) \(\newcommand{\ecal}{\cal E}\) \(\newcommand{\coords}[2]{\left\{#1\right\}_{#2}}\) \(\newcommand{\gray}[1]{\color{gray}{#1}}\) \(\newcommand{\lgray}[1]{\color{lightgray}{#1}}\) \(\newcommand{\rank}{\operatorname{rank}}\) \(\newcommand{\row}{\text{Row}}\) \(\newcommand{\col}{\text{Col}}\) \(\renewcommand{\row}{\text{Row}}\) \(\newcommand{\nul}{\text{Nul}}\) \(\newcommand{\var}{\text{Var}}\) \(\newcommand{\corr}{\text{corr}}\) \(\newcommand{\len}[1]{\left|#1\right|}\) \(\newcommand{\bbar}{\overline{\bvec}}\) \(\newcommand{\bhat}{\widehat{\bvec}}\) \(\newcommand{\bperp}{\bvec^\perp}\) \(\newcommand{\xhat}{\widehat{\xvec}}\) \(\newcommand{\vhat}{\widehat{\vvec}}\) \(\newcommand{\uhat}{\widehat{\uvec}}\) \(\newcommand{\what}{\widehat{\wvec}}\) \(\newcommand{\Sighat}{\widehat{\Sigma}}\) \(\newcommand{\lt}{<}\) \(\newcommand{\gt}{>}\) \(\newcommand{\amp}{&}\) \(\definecolor{fillinmathshade}{gray}{0.9}\)Instrumentation
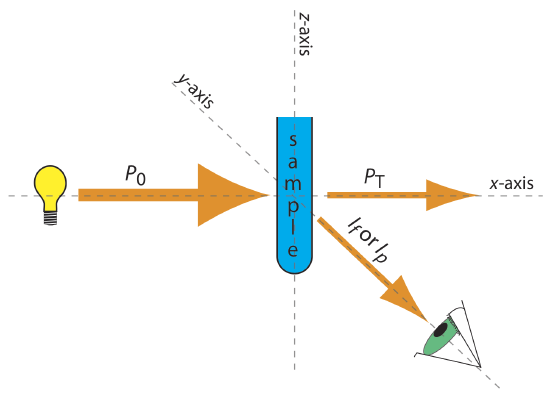
The basic instrumentation for monitoring fluorescence and phosphorescence—a source of radiation, a means of selecting a narrow band of radiation, and a detector—are the same as those for absorption spectroscopy. The unique demands of fluorescence and phosphorescence, however, require some modifications to the instrument designs discussed in earlier chapters: the filter photometer, the single-beam spectrophotometer, the double-beam spectrophotometer, and the diode array spectrometer. The most important difference is that the detector cannot be placed directly across from the source. Figure \(\PageIndex{1}\) shows why this is the case. If we place the detector along the source’s axis it receives both the transmitted source radiation, PT, and the fluorescent, If, or phosphorescent, Ip, radiation. Instead, we rotate the director and place it at 90o to the source.
Instruments for Measuring Fluorescence
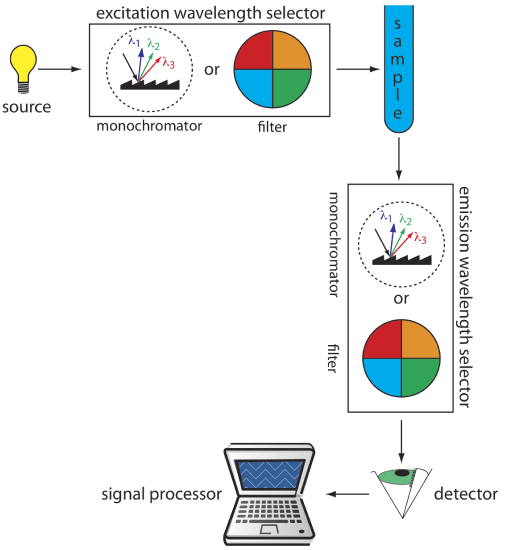
Figure \(\PageIndex{2}\) shows the basic design of an instrument for measuring fluorescence, which includes two wavelength selectors, one for selecting the source's excitation wavelength and one for selecting the analyte's emission wavelength. In a fluorometer the excitation and emission wavelengths are selected using absorption or interference filters. The excitation source for a fluorometer usually is a low-pressure Hg vapor lamp that provides intense emission lines distributed throughout the ultraviolet and visible region. When a monochromator is used to select the excitation and the emission wavelengths, the instrument is called a spectrofluorometer. With a monochromator the excitation source usually is a high-pressure Xe arc lamp, which has a continuous emission spectrum. Either instrumental design is appropriate for quantitative work, although only a spectrofluorometer can record an excitation or emission spectrum.
A Hg vapor lamp has emission lines at 254, 312, 365, 405, 436, 546, 577, 691, and 773 nm.
The sample cells for molecular fluorescence are similar to those for molecular absorption. Remote sensing using a fiber optic probe is possible using with either a fluorometer or spectrofluorometer. An analyte that is fluorescent is monitored directly. For an analyte that is not fluorescent, a suitable fluorescent probe molecule is incorporated into the tip of the fiber optic probe. The analyte’s reaction with the probe molecule leads to an increase or decrease in fluorescence.
Instruments for Measuring Phosphorescence
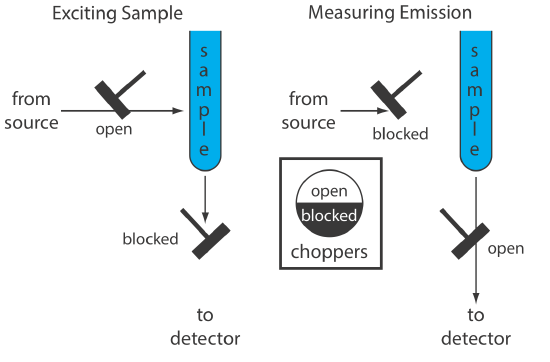
An instrument for molecular phosphorescence must discriminate between phosphorescence and fluorescence. Because the lifetime for fluorescence is shorter than that for phosphorescence, discrimination is achieved by incorporating a delay between exciting the sample and measuring the phosphorescent emission. Figure \(\PageIndex{3}\) shows how two out-of-phase choppers allow us to block fluorescent emission from reaching the detector when the sample is being excited and to prevent the source radiation from causing fluorescence when we are measuring the phosphorescent emission.
Because phosphorescence is such a slow process, we must prevent the excited state from relaxing by external conversion. One way this is accomplished is by dissolving the sample in a suitable organic solvent, usually a mixture of ethanol, isopentane, and diethylether. The resulting solution is frozen at liquid-N2 temperatures to form an optically clear solid. The solid matrix minimizes external conversion due to collisions between the analyte and the solvent. External conversion also is minimized by immobilizing the sample on a solid substrate, making possible room temperature measurements. One approach is to place a drop of a solution that contains the analyte on a small disc of filter paper. After drying the sample under a heat lamp, the sample is placed in the spectrofluorometer for analysis. Other solid substrates include silica gel, alumina, sodium acetate, and sucrose. This approach is particularly useful for the analysis of thin layer chromatography plates.