
6.2: Fragmentation
- Page ID
- 374828

\( \newcommand{\vecs}[1]{\overset { \scriptstyle \rightharpoonup} {\mathbf{#1}} } \)
\( \newcommand{\vecd}[1]{\overset{-\!-\!\rightharpoonup}{\vphantom{a}\smash {#1}}} \)
\( \newcommand{\dsum}{\displaystyle\sum\limits} \)
\( \newcommand{\dint}{\displaystyle\int\limits} \)
\( \newcommand{\dlim}{\displaystyle\lim\limits} \)
\( \newcommand{\id}{\mathrm{id}}\) \( \newcommand{\Span}{\mathrm{span}}\)
( \newcommand{\kernel}{\mathrm{null}\,}\) \( \newcommand{\range}{\mathrm{range}\,}\)
\( \newcommand{\RealPart}{\mathrm{Re}}\) \( \newcommand{\ImaginaryPart}{\mathrm{Im}}\)
\( \newcommand{\Argument}{\mathrm{Arg}}\) \( \newcommand{\norm}[1]{\| #1 \|}\)
\( \newcommand{\inner}[2]{\langle #1, #2 \rangle}\)
\( \newcommand{\Span}{\mathrm{span}}\)
\( \newcommand{\id}{\mathrm{id}}\)
\( \newcommand{\Span}{\mathrm{span}}\)
\( \newcommand{\kernel}{\mathrm{null}\,}\)
\( \newcommand{\range}{\mathrm{range}\,}\)
\( \newcommand{\RealPart}{\mathrm{Re}}\)
\( \newcommand{\ImaginaryPart}{\mathrm{Im}}\)
\( \newcommand{\Argument}{\mathrm{Arg}}\)
\( \newcommand{\norm}[1]{\| #1 \|}\)
\( \newcommand{\inner}[2]{\langle #1, #2 \rangle}\)
\( \newcommand{\Span}{\mathrm{span}}\) \( \newcommand{\AA}{\unicode[.8,0]{x212B}}\)
\( \newcommand{\vectorA}[1]{\vec{#1}} % arrow\)
\( \newcommand{\vectorAt}[1]{\vec{\text{#1}}} % arrow\)
\( \newcommand{\vectorB}[1]{\overset { \scriptstyle \rightharpoonup} {\mathbf{#1}} } \)
\( \newcommand{\vectorC}[1]{\textbf{#1}} \)
\( \newcommand{\vectorD}[1]{\overrightarrow{#1}} \)
\( \newcommand{\vectorDt}[1]{\overrightarrow{\text{#1}}} \)
\( \newcommand{\vectE}[1]{\overset{-\!-\!\rightharpoonup}{\vphantom{a}\smash{\mathbf {#1}}}} \)
\( \newcommand{\vecs}[1]{\overset { \scriptstyle \rightharpoonup} {\mathbf{#1}} } \)
\(\newcommand{\longvect}{\overrightarrow}\)
\( \newcommand{\vecd}[1]{\overset{-\!-\!\rightharpoonup}{\vphantom{a}\smash {#1}}} \)
\(\newcommand{\avec}{\mathbf a}\) \(\newcommand{\bvec}{\mathbf b}\) \(\newcommand{\cvec}{\mathbf c}\) \(\newcommand{\dvec}{\mathbf d}\) \(\newcommand{\dtil}{\widetilde{\mathbf d}}\) \(\newcommand{\evec}{\mathbf e}\) \(\newcommand{\fvec}{\mathbf f}\) \(\newcommand{\nvec}{\mathbf n}\) \(\newcommand{\pvec}{\mathbf p}\) \(\newcommand{\qvec}{\mathbf q}\) \(\newcommand{\svec}{\mathbf s}\) \(\newcommand{\tvec}{\mathbf t}\) \(\newcommand{\uvec}{\mathbf u}\) \(\newcommand{\vvec}{\mathbf v}\) \(\newcommand{\wvec}{\mathbf w}\) \(\newcommand{\xvec}{\mathbf x}\) \(\newcommand{\yvec}{\mathbf y}\) \(\newcommand{\zvec}{\mathbf z}\) \(\newcommand{\rvec}{\mathbf r}\) \(\newcommand{\mvec}{\mathbf m}\) \(\newcommand{\zerovec}{\mathbf 0}\) \(\newcommand{\onevec}{\mathbf 1}\) \(\newcommand{\real}{\mathbb R}\) \(\newcommand{\twovec}[2]{\left[\begin{array}{r}#1 \\ #2 \end{array}\right]}\) \(\newcommand{\ctwovec}[2]{\left[\begin{array}{c}#1 \\ #2 \end{array}\right]}\) \(\newcommand{\threevec}[3]{\left[\begin{array}{r}#1 \\ #2 \\ #3 \end{array}\right]}\) \(\newcommand{\cthreevec}[3]{\left[\begin{array}{c}#1 \\ #2 \\ #3 \end{array}\right]}\) \(\newcommand{\fourvec}[4]{\left[\begin{array}{r}#1 \\ #2 \\ #3 \\ #4 \end{array}\right]}\) \(\newcommand{\cfourvec}[4]{\left[\begin{array}{c}#1 \\ #2 \\ #3 \\ #4 \end{array}\right]}\) \(\newcommand{\fivevec}[5]{\left[\begin{array}{r}#1 \\ #2 \\ #3 \\ #4 \\ #5 \\ \end{array}\right]}\) \(\newcommand{\cfivevec}[5]{\left[\begin{array}{c}#1 \\ #2 \\ #3 \\ #4 \\ #5 \\ \end{array}\right]}\) \(\newcommand{\mattwo}[4]{\left[\begin{array}{rr}#1 \amp #2 \\ #3 \amp #4 \\ \end{array}\right]}\) \(\newcommand{\laspan}[1]{\text{Span}\{#1\}}\) \(\newcommand{\bcal}{\cal B}\) \(\newcommand{\ccal}{\cal C}\) \(\newcommand{\scal}{\cal S}\) \(\newcommand{\wcal}{\cal W}\) \(\newcommand{\ecal}{\cal E}\) \(\newcommand{\coords}[2]{\left\{#1\right\}_{#2}}\) \(\newcommand{\gray}[1]{\color{gray}{#1}}\) \(\newcommand{\lgray}[1]{\color{lightgray}{#1}}\) \(\newcommand{\rank}{\operatorname{rank}}\) \(\newcommand{\row}{\text{Row}}\) \(\newcommand{\col}{\text{Col}}\) \(\renewcommand{\row}{\text{Row}}\) \(\newcommand{\nul}{\text{Nul}}\) \(\newcommand{\var}{\text{Var}}\) \(\newcommand{\corr}{\text{corr}}\) \(\newcommand{\len}[1]{\left|#1\right|}\) \(\newcommand{\bbar}{\overline{\bvec}}\) \(\newcommand{\bhat}{\widehat{\bvec}}\) \(\newcommand{\bperp}{\bvec^\perp}\) \(\newcommand{\xhat}{\widehat{\xvec}}\) \(\newcommand{\vhat}{\widehat{\vvec}}\) \(\newcommand{\uhat}{\widehat{\uvec}}\) \(\newcommand{\what}{\widehat{\wvec}}\) \(\newcommand{\Sighat}{\widehat{\Sigma}}\) \(\newcommand{\lt}{<}\) \(\newcommand{\gt}{>}\) \(\newcommand{\amp}{&}\) \(\definecolor{fillinmathshade}{gray}{0.9}\)Fragmentation
Although the molecular ion is useful for identification, it does not provide any structural information about an unknown. The structural information is obtained from the fragmentation patterns of the mass spectrum. Identifying an unknown without analyzing the fragmentation patterns is like putting together a jigsaw puzzle without the picture. Fragmentation patterns are often complex, but they fit together like pieces of the puzzle to identify the structure of the molecule.
After a molecule is ionized, the molecular ion retains the excess ionization energy. If this excess energy is greater than the energy required to break a chemical bond, the molecule can fragment. The fragmentation processes are typically categorized as direct cleavage where a single bond is broken or rearrangement where bonds are broken and created simultaneously (Figure \(\PageIndex{1}\) ).
- Electron Ionization: ABCD + e- → ABCD+• + 2e-
- Fragmentation:
- Direct Cleavage ABCD+• → AB+ + CD•
- Rearrangement ABCD+• → AD+• + B=C
The molecular ion formed by electron ionization is an odd electron ion, a radical species with an unpaired electron. These ions are formed by removing a lone pair electron or a bonding electron from a molecule during ionization. For example, water is ionized by removing a non-bonding electron from oxygen to produces \(\mathrm{H}_{2} \mathrm{O}^{+1}\). This is an example of an odd electron ion. Odd electron ions have an even mass to charge value. The exception to this is if the ion has an odd number of nitrogen atoms. Calculate the mass to charge value for some molecular ions to verify this statement.
When a molecular ion fragments by direct cleavage a single bond is broken to produce two fragments. This usually separates the charge and the radical of the molecular ion. Direct cleavage produces an even electron ion, AB+, and a neutral odd electron radical, CD•. The even electron ion is detected at an odd mass to charge value (assuming no nitrogen) and since the radical is a neutral fragment it is not observed in the mass spectrum. Even electron ions have all paired electrons. An example of this was shown in the mass spectrum of acetone where the molecular ion, CH3–CO–CH3+•, fragments to form CO–CH3+ - an even electron ion observed at an 43 m/z. The radical CH3• has an odd mass but since it is neutral this fragment is not observed in the mass spectrum. It is possible for the charge and radical species to switch. As a result, cleavage of CH3–CO–CH3+• can also form CH3+ which is an even electron ion observed at 15 m/z, an odd mass. The radical formed by this cleavage, CO–CH3•, would not be observed. In the mass spectrum of acetone the 43 m/z peak is much larger than the 15 m/z peak, so the formation of CO–CH3+ at 43 m/z is clearly favored. When you are interpreting mass spectra look for possible cleavage fragments but keep in mind that either or both of the fragments may be observed in the mass spectrum.
Rearrangements are more complex reactions that involve both making and breaking bonds. These reactions are thermodynamically favorable because they require less energy. However they also require a concerted mechanism that is not as kinetically favorable when compared to a simple cleavage reaction. Rearrangement ions are easily identified because they are observed as odd electron ions with an even m/z value. These fragments often provide important clues about the location and identity of certain functional groups. Rearrangements are discussed in more detail in the next section.
The mass spectra of 4 different \(\mathrm{C}_{4} \mathrm{H}_{10} \mathrm{O}\) isomers are shown in Figures 16 - 19. These spectra show how cleavage patterns help to identify the structure of a compound. It is important to remember that determining the molecular formula is just the first step in interpretation of mass spectra.
1-Butanol
At this point get a piece of scratch paper, draw a Lewis dot structure for 1-butanol, find the mass of the molecular ion, break some bonds and find the mass of some possible fragments. Then look to see which of these fragments are observed in the mass spectrum. This exercise will take some time, but the practice will help you learn how to interpret mass spectra. After you have some possibilities, take a look at Figure \(\PageIndex{2}\) and see what you can find.
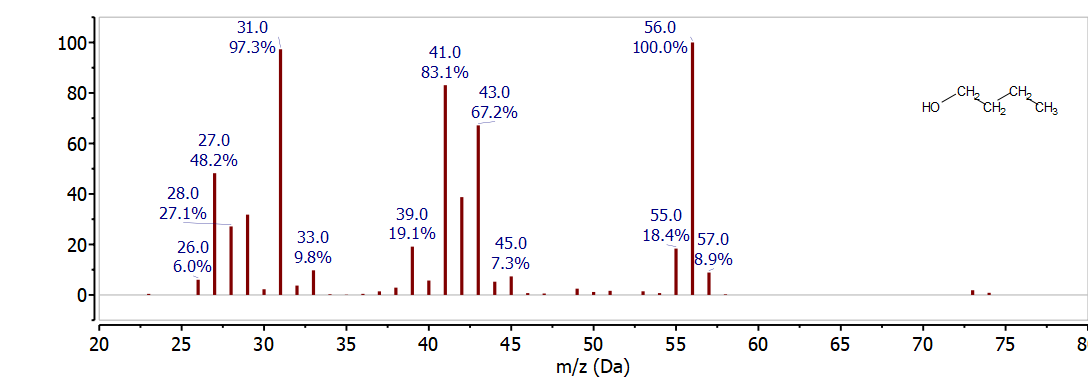
For 1-butanol the molecular ion should be observed at 74 m/z (4x12 + 10x1 + 1x16 = 74). There is a very small peak at this location, which is not unusual alcohols - and many other compound classes. If you look at the mass spectra for a large number of alcohols you will notice that they often show little or no molecular ion intensity. This makes interpreting their spectra challenging and IR spectra - which very clearly show OH functional groups - compliment mass spectra by helping to identify these functional groups. If you know from the IR that a compound is an alcohol you can be careful about identifying the molecular ion, knowing that it may not be observed.
Next look at possible cleavage fragments from the molecular ion. One possibility is loss of a hydrogen to give 73 m/z. There is a small peak at 73 m/z in the mass spectrum - that indicates that this fragmentation is possible but it is is not common. The same is also true for loss of OH• - which is observed with a small peak at 57 m/z (74 - 17). The next loss is alpha-clevage, breaking the C-C bond next to the OH functional group, to form CH2OH+, observed at 31 m/z (CH2OH+) or the compliment, CH3CH2CH2+, observed at 43 m/z. Since the charge could be retained by either fragment both are observed in the spectrum. Alpha-cleavage is a common fragmentation pattern for alcohols, so observing a peak at 31 m/z is useful for identifying primary alcohols.
The 1-butanol spectrum also has a major peak at 56 m/z. This is an even mass ion so it is not formed by breaking a single bond. Looking at the loss from the molecular ion to this fragment (74 - 56 = 18) is a clue to the identity. Alcohols often undergo loss of water (H2O - 18 m/z, so 56 m/z is a likely peak for 1-butanol. This rearrangement is favorable because water is very stable and the resulting radical ion, CH2=CH-CH2-CH3+, has the same structure as an alkene. Rearrangements are much more likely when they create a stable species. The other significant peak in this mass spectrum is at 41 m/z. It is not possible to get this mass from breaking a single bond so it must also involve some sort of rearrangement. It is not unusual for fragmentation and loss of H2 to occur so this ion could be formed by alpha-cleavage followed by H2 loss. Since H2 is an intact molecule, this fragmentation is energetically favorable although it also requires some rearrangement.
2-Butanol
The next spectrum to examine is 2-butanol. Before looking at the mass spectrum draw the Lewis dot structure for 2-butanol and determine the mass of the possible alpha-cleavage fragments. Then compare your results with the spectrum in Figure \(\PageIndex{3}\).

Since 2-butanol has the same molecular formula as 1-butanol, C4H10O, it also has the same molecular ion at 74 m/z. The molecular ion is not seen in Figure 17 but there are several very informative fragment ions observed in the mass spectrum. From the analysis of 1-butanol, it is reasonable to look for alpha cleavage fragments. Since this is a secondary alcohol, there are two possible alpha-cleavage locations for 2-butanol. Alpha-cleavage could result in loss of CH3• or C2H5• to produce ions observed at 59 m/z (74 - 15) and 45 m/z (74 - 29) respectively. Both of these peaks are observed in Figure 17 and their high intensity clearly distinguish this mass spectrum from 1-butanol. The compliment ions, CH3+ or C2H5+ are observed at 15 m/z and 29 m/z but are not particularly useful for identification since they are present in almost all organic mass spectra.
2-Methyl-1-Propanol
The next spectrum to examine is 2-methyl-1-propanol. Before looking at the mass spectrum in Figure \(\PageIndex{4}\), draw the Lewis dot structure for 2-methyl-1-propanol and determine the mass of the possible alpha cleavage fragments. Then compare what you find with the spectrum below.
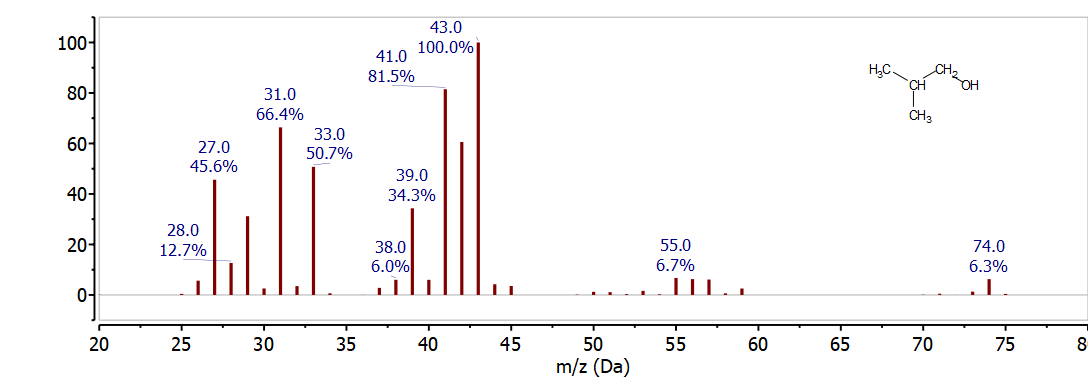
Since 2-methyl-1-propanol has the same molecular formula as 1-butanol and 2-butanol, C4H10O, it also has the same molecular ion at 74 m/z. Although the molecular ion at 74 m/z was not readily observed in the previous two spectra, it is clearly seen for 2-methyl-1-propanol in Figure 18. Based on the discussion of the previous two spectra we should also look for alpha cleavage fragments. Based on the structure for 2-methyl-1-propanol alpha-cleavage would result in loss of C3H7• to form CH2OH+ which is observed at 31 m/z and is characteristic of a primary alcohol. The complement ion C3H7+ at 43 m/z is also observed in Figure 18. Since the C3H7+ at 43 m/z is a secondary carbocation it is more stable than the C3H7+ ion formed from the fragmentation of 1-butanol. As a result the peak at 43 m/z is the base peak in the spectum of 2-methyl-1-propanol. The relative intensity of peaks like this is very important for distinguishing the mass spectra of similar compounds. You can also compare the relative intensity of the peaks at 31 m/z and 43 m/z in the spectra of 1-butanol and 2-methyl-1-propanol.
2-Methyl-2-Propanol
The next spectrum to examine is 2-methyl-2-propanol. Before looking at the mass spectrum draw the Lewis dot structure for 2-methyl-2-propanol and determine the mass of the possible alpha cleavage fragments. Then compare what you find with the spectrum in Figure \(\PageIndex{5}\).

The molecular ion is not observed for 2-methyl-1-propanol in Figure 19. However, the alpha-cleavage peak showing loss of CH3• at 59 m/z is the base peak and is far more abundant than any other ion in the spectrum. There are two reasons for this, the first is that there are three different locations in the structure where alpha-cleavage results in loss of CH3•. This alone would increase the probability of forming 59 m/z but the additional consideration is that the C3H7O+ carbocation produced by alpha-cleavage is a tertiary carbocation. As a result it is much more stable and therefore less likely to undergo further fragmentation.
C4H10O Summary
It is clear from the spectra shown in Figures 16-19 that the mass spectra for these four different C4H10O structures are readily distinguished based on the alpha-cleavage patterns. Learning common fragmentation patterns for different functional groups is very helpful for identifying unknowns and for distinguishing the spectra for similar compounds.
Toluene
The mass spectrum for toluene is shown in Figure \(\PageIndex{6}\). Given the stability of aromatic compounds it should not be surprising that the molecular ion at 92 m/z has a high intensity. The base peak observed at 91 m/z is interesting because loss of H• is not typically this intense. It turns out that the tropylium ion, C7H7+, is also aromatic and so this fragment is very stable and often has a high intensity.
