
12.6: Other Forms of Liquid Chromatography
- Page ID
- 5598

\( \newcommand{\vecs}[1]{\overset { \scriptstyle \rightharpoonup} {\mathbf{#1}} } \)
\( \newcommand{\vecd}[1]{\overset{-\!-\!\rightharpoonup}{\vphantom{a}\smash {#1}}} \)
\( \newcommand{\id}{\mathrm{id}}\) \( \newcommand{\Span}{\mathrm{span}}\)
( \newcommand{\kernel}{\mathrm{null}\,}\) \( \newcommand{\range}{\mathrm{range}\,}\)
\( \newcommand{\RealPart}{\mathrm{Re}}\) \( \newcommand{\ImaginaryPart}{\mathrm{Im}}\)
\( \newcommand{\Argument}{\mathrm{Arg}}\) \( \newcommand{\norm}[1]{\| #1 \|}\)
\( \newcommand{\inner}[2]{\langle #1, #2 \rangle}\)
\( \newcommand{\Span}{\mathrm{span}}\)
\( \newcommand{\id}{\mathrm{id}}\)
\( \newcommand{\Span}{\mathrm{span}}\)
\( \newcommand{\kernel}{\mathrm{null}\,}\)
\( \newcommand{\range}{\mathrm{range}\,}\)
\( \newcommand{\RealPart}{\mathrm{Re}}\)
\( \newcommand{\ImaginaryPart}{\mathrm{Im}}\)
\( \newcommand{\Argument}{\mathrm{Arg}}\)
\( \newcommand{\norm}[1]{\| #1 \|}\)
\( \newcommand{\inner}[2]{\langle #1, #2 \rangle}\)
\( \newcommand{\Span}{\mathrm{span}}\) \( \newcommand{\AA}{\unicode[.8,0]{x212B}}\)
\( \newcommand{\vectorA}[1]{\vec{#1}} % arrow\)
\( \newcommand{\vectorAt}[1]{\vec{\text{#1}}} % arrow\)
\( \newcommand{\vectorB}[1]{\overset { \scriptstyle \rightharpoonup} {\mathbf{#1}} } \)
\( \newcommand{\vectorC}[1]{\textbf{#1}} \)
\( \newcommand{\vectorD}[1]{\overrightarrow{#1}} \)
\( \newcommand{\vectorDt}[1]{\overrightarrow{\text{#1}}} \)
\( \newcommand{\vectE}[1]{\overset{-\!-\!\rightharpoonup}{\vphantom{a}\smash{\mathbf {#1}}}} \)
\( \newcommand{\vecs}[1]{\overset { \scriptstyle \rightharpoonup} {\mathbf{#1}} } \)
\( \newcommand{\vecd}[1]{\overset{-\!-\!\rightharpoonup}{\vphantom{a}\smash {#1}}} \)
\(\newcommand{\avec}{\mathbf a}\) \(\newcommand{\bvec}{\mathbf b}\) \(\newcommand{\cvec}{\mathbf c}\) \(\newcommand{\dvec}{\mathbf d}\) \(\newcommand{\dtil}{\widetilde{\mathbf d}}\) \(\newcommand{\evec}{\mathbf e}\) \(\newcommand{\fvec}{\mathbf f}\) \(\newcommand{\nvec}{\mathbf n}\) \(\newcommand{\pvec}{\mathbf p}\) \(\newcommand{\qvec}{\mathbf q}\) \(\newcommand{\svec}{\mathbf s}\) \(\newcommand{\tvec}{\mathbf t}\) \(\newcommand{\uvec}{\mathbf u}\) \(\newcommand{\vvec}{\mathbf v}\) \(\newcommand{\wvec}{\mathbf w}\) \(\newcommand{\xvec}{\mathbf x}\) \(\newcommand{\yvec}{\mathbf y}\) \(\newcommand{\zvec}{\mathbf z}\) \(\newcommand{\rvec}{\mathbf r}\) \(\newcommand{\mvec}{\mathbf m}\) \(\newcommand{\zerovec}{\mathbf 0}\) \(\newcommand{\onevec}{\mathbf 1}\) \(\newcommand{\real}{\mathbb R}\) \(\newcommand{\twovec}[2]{\left[\begin{array}{r}#1 \\ #2 \end{array}\right]}\) \(\newcommand{\ctwovec}[2]{\left[\begin{array}{c}#1 \\ #2 \end{array}\right]}\) \(\newcommand{\threevec}[3]{\left[\begin{array}{r}#1 \\ #2 \\ #3 \end{array}\right]}\) \(\newcommand{\cthreevec}[3]{\left[\begin{array}{c}#1 \\ #2 \\ #3 \end{array}\right]}\) \(\newcommand{\fourvec}[4]{\left[\begin{array}{r}#1 \\ #2 \\ #3 \\ #4 \end{array}\right]}\) \(\newcommand{\cfourvec}[4]{\left[\begin{array}{c}#1 \\ #2 \\ #3 \\ #4 \end{array}\right]}\) \(\newcommand{\fivevec}[5]{\left[\begin{array}{r}#1 \\ #2 \\ #3 \\ #4 \\ #5 \\ \end{array}\right]}\) \(\newcommand{\cfivevec}[5]{\left[\begin{array}{c}#1 \\ #2 \\ #3 \\ #4 \\ #5 \\ \end{array}\right]}\) \(\newcommand{\mattwo}[4]{\left[\begin{array}{rr}#1 \amp #2 \\ #3 \amp #4 \\ \end{array}\right]}\) \(\newcommand{\laspan}[1]{\text{Span}\{#1\}}\) \(\newcommand{\bcal}{\cal B}\) \(\newcommand{\ccal}{\cal C}\) \(\newcommand{\scal}{\cal S}\) \(\newcommand{\wcal}{\cal W}\) \(\newcommand{\ecal}{\cal E}\) \(\newcommand{\coords}[2]{\left\{#1\right\}_{#2}}\) \(\newcommand{\gray}[1]{\color{gray}{#1}}\) \(\newcommand{\lgray}[1]{\color{lightgray}{#1}}\) \(\newcommand{\rank}{\operatorname{rank}}\) \(\newcommand{\row}{\text{Row}}\) \(\newcommand{\col}{\text{Col}}\) \(\renewcommand{\row}{\text{Row}}\) \(\newcommand{\nul}{\text{Nul}}\) \(\newcommand{\var}{\text{Var}}\) \(\newcommand{\corr}{\text{corr}}\) \(\newcommand{\len}[1]{\left|#1\right|}\) \(\newcommand{\bbar}{\overline{\bvec}}\) \(\newcommand{\bhat}{\widehat{\bvec}}\) \(\newcommand{\bperp}{\bvec^\perp}\) \(\newcommand{\xhat}{\widehat{\xvec}}\) \(\newcommand{\vhat}{\widehat{\vvec}}\) \(\newcommand{\uhat}{\widehat{\uvec}}\) \(\newcommand{\what}{\widehat{\wvec}}\) \(\newcommand{\Sighat}{\widehat{\Sigma}}\) \(\newcommand{\lt}{<}\) \(\newcommand{\gt}{>}\) \(\newcommand{\amp}{&}\) \(\definecolor{fillinmathshade}{gray}{0.9}\)At the beginning of Section 12.5, we noted that there are several different types of solute/stationary phase interactions in liquid chromatography. In Section 12.5 we limited our discussion to liquid–liquid chromatography. In this section we turn our attention to liquid chromatography techniques in which partitioning occurs by liquid–solid adsorption, ion-exchange, and size exclusion.
12.6.1 Liquid-Solid Adsorption Chromatography
In liquid–solid adsorption chromatography (LSC) the column packing also serves as the stationary phase. In Tswett’s original work the stationary phase was finely divided CaCO3, but modern columns employ porous 3–10 μm particles of silica or alumina. Because the stationary phase is polar, the mobile phase is usually a nonpolar or moderately polar solvent. Typical mobile phases include hexane, isooctane, and methylene chloride. The usual order of elution—from shorter to longer retention times—is
olefins < aromatic hydrocarbons < ethers < esters, aldehydes, ketones < alcohols, amines < amide < carboxylic acids
Nonpolar stationary phases, such as charcoal-based absorbents, also may be used. For most samples, liquid–solid chromatography does not offer any special advantages over liquid–liquid chromatography. One exception is the analysis of isomers, where LLC excels.
12.6.2 Ion-Exchange Chromatography
In ion-exchange chromatography (IEC) the stationary phase is a cross-linked polymer resin, usually divinylbenzene cross-linked polystyrene, with covalently attached ionic functional groups (see Figure 12.52 and Table 12.7). The counterions to these fixed charges are mobile and can be displaced by ions that compete more favorably for the exchange sites. Ion-exchange resins are divided into four categories: strong acid cation exchangers; weak acid cation exchangers; strong base anion exchangers; and weak base anion exchangers.
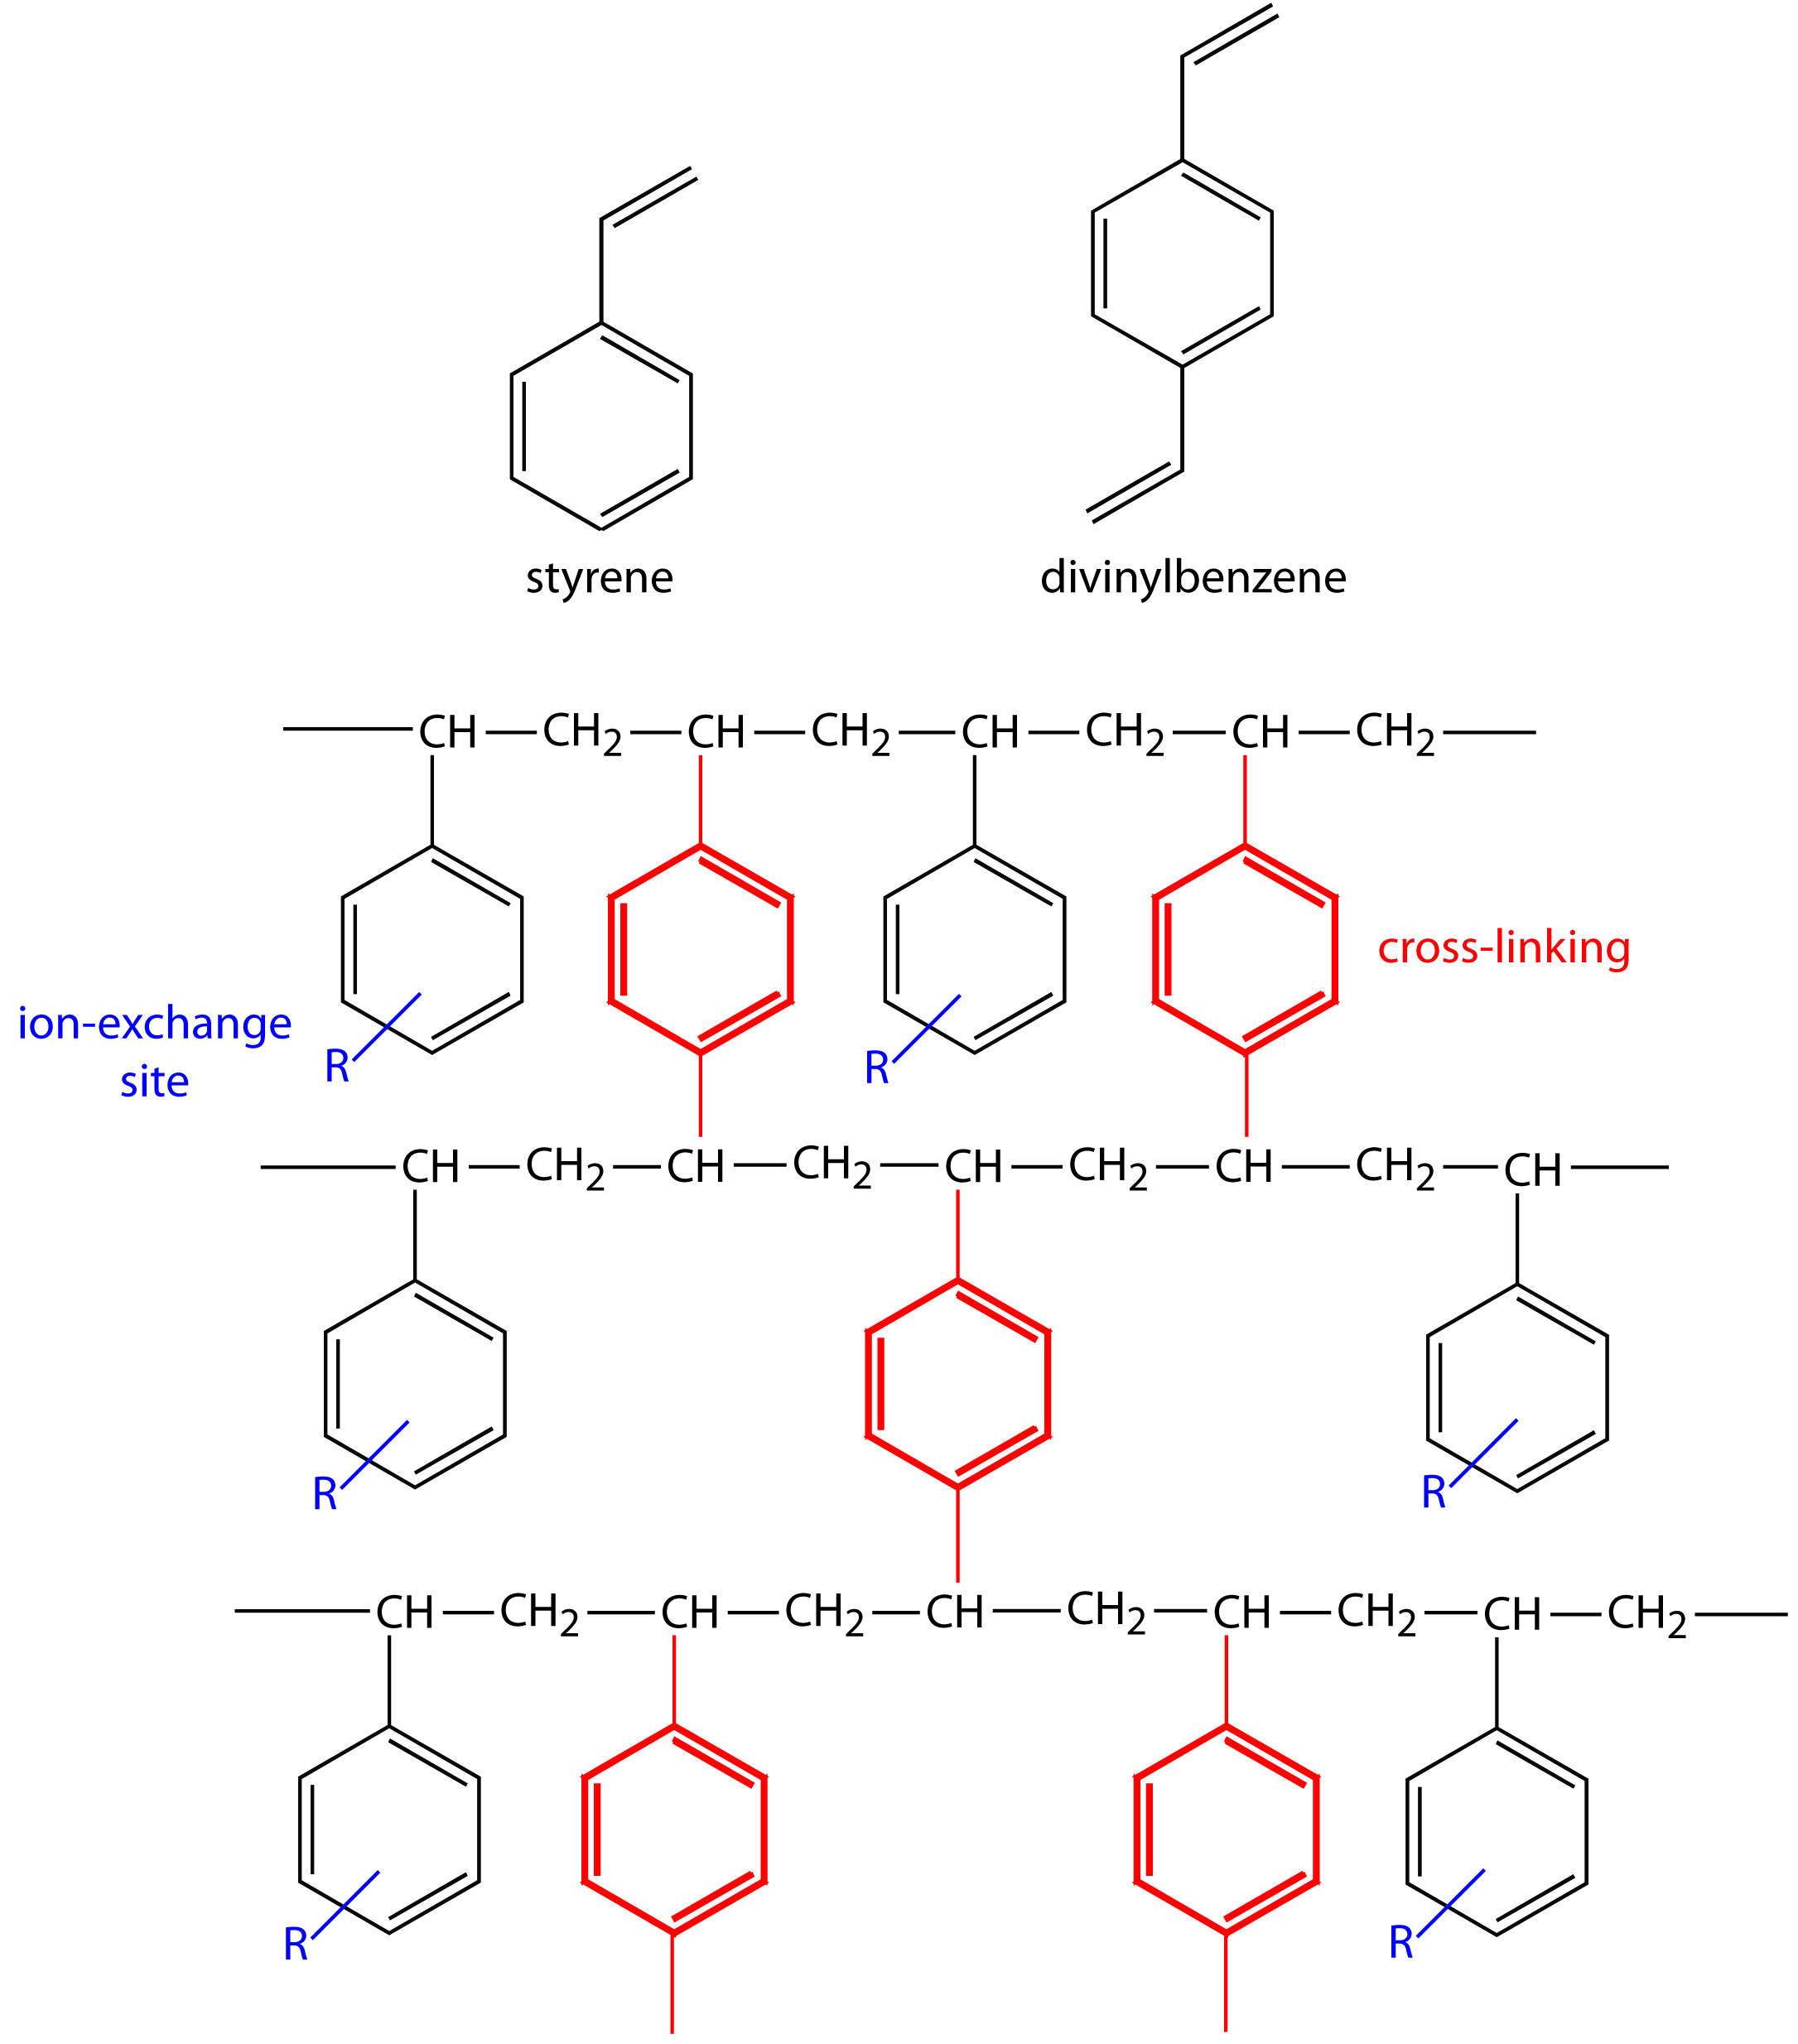
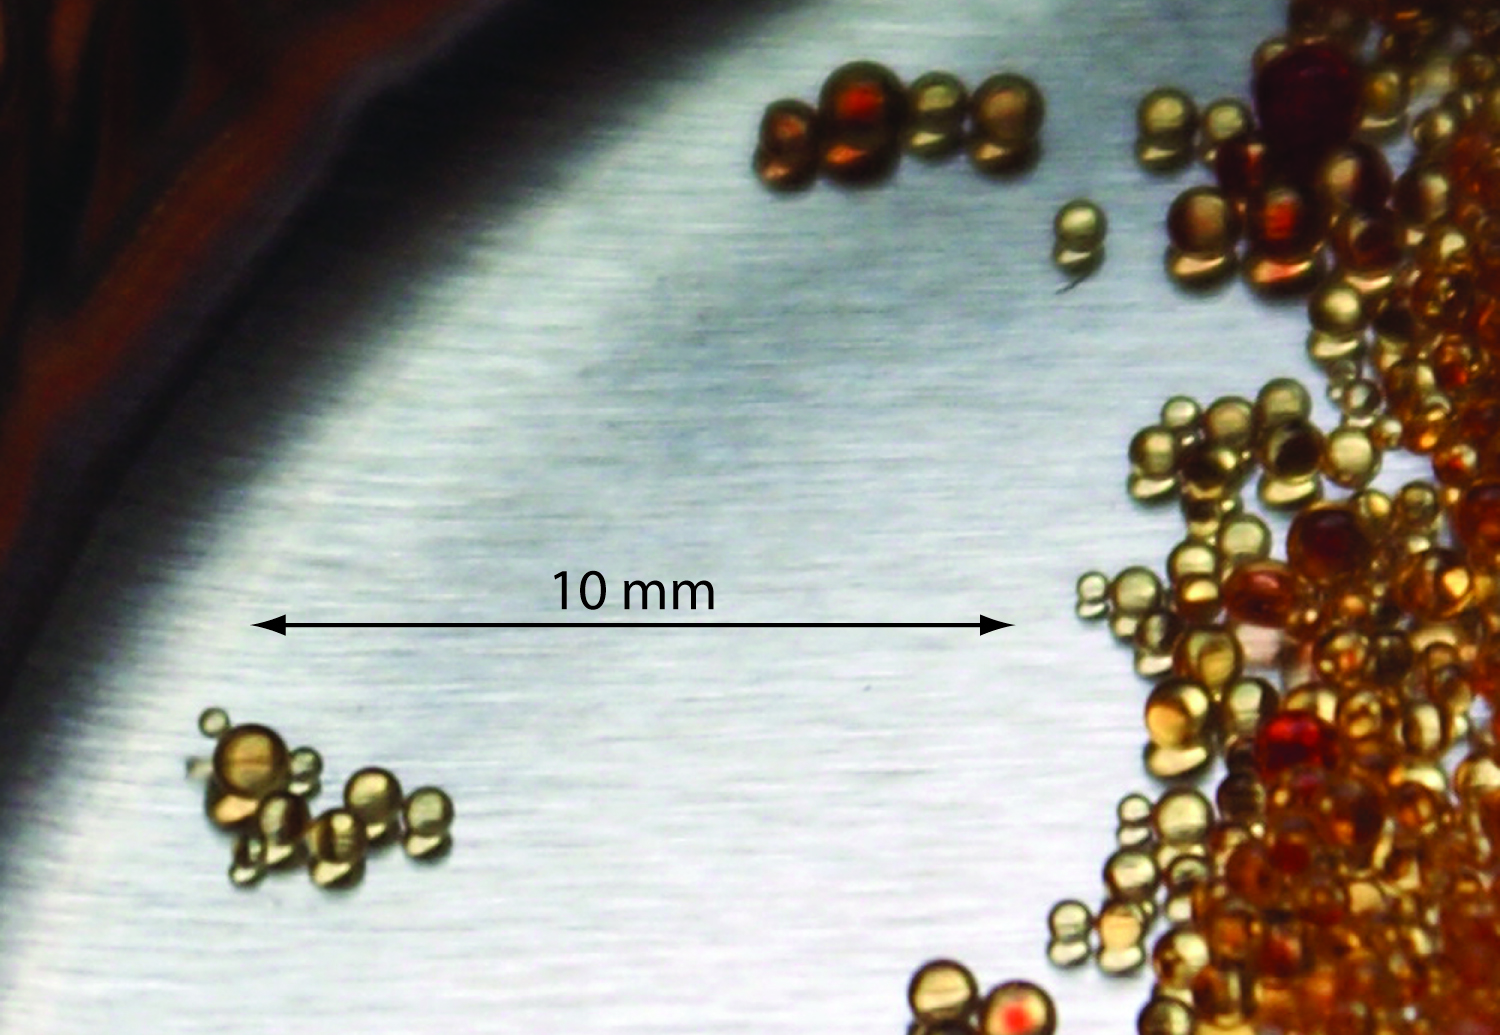
Figure 12.52 Structures of styrene, divinylbenzene, and a styrene–divinylbenzene co-polymer modified for use as an ion-exchange resin. The ion-exchange sites, indicated by R and shown in blue, are mostly in the para position and are not necessarily bound to all styrene units. The cross-linking is shown in red. The photo shows an example of the polymer beads. These beads are approximately 0.30–0.85 mm in diameter. Resins for use in ion-exchange chromatography are typically 5–11 μm in diameter.
| Type | Functional group (R) | Examples |
|---|---|---|
| strong acid cation exchanger | sulfonic acid | –SO3– –CH2CH2SO3– |
| weak acid cation exchanger | carboxylic acid | –COO– –CH2COO– |
| strong base anion exchanger | quaternary amine | –CH2N(CH3)3+ –CH2CH2N(CH2CH3)3+ |
| weak base anion exchanger | amine | –NH3+ –CH2CH2NH(CH2CH3)2+ |
Strong acid cation exchangers include a sulfonic acid functional group that retains it anionic form—and thus its capacity for ion-exchange—in strongly acidic solutions. The functional groups for a weak acid cation exchanger, however, become fully protonated at pH levels less then 4 and lose their exchange capacity. The strong base anion exchangers include a quaternary amine, which retains a positive charge even in strongly basic solutions. Weak base anion exchangers remain protonated only at pH levels that are moderately basic. Under more basic conditions a weak base anion exchanger loses a proton and its exchange capacity.
The ion-exchange reaction of a monovalent cation, M+, at a strong acid exchange site is
\[\ce{−SO3- H+}(s) + \ce{M+}(aq) ⇋ \ce{−SO3- M+}(s) + \ce{H+}(aq)\]
The equilibrium constant for this ion-exchange reaction, which we call the selectivity coefficient, K, is
\[K = \mathrm{\dfrac{\left\{\ce{−SO3-} M^+\right\} [H^+]}{\left\{\ce{−SO3-} H^+\right\} [M^+]}}\tag{12.29}\]
where we use brackets { } to indicate a surface concentration instead of a solution concentration.
We don’t usually think about a solid’s concentration. There is a good reason for this. In most cases, a solid’s concentration is a constant. If you break a piece of chalk into two parts, for example, the mass and the volume retain the same proportion. When we consider an ion binding to a reactive site on the solid’s surface, however, the fraction of sites that are bound, and thus the concentration of bound sites, can take on any value between 0 and some maximum value that is proportional to the density of reactive sites.
Rearranging equation 12.29 shows us that the distribution ratio, D, for the exchange reaction
\[D = \mathrm{\dfrac{amount\: of\: M^+\: in\: the\: stationary\: phase}{amount\: of\: M^+\: in\: the\: mobile\: phase}}\]
\[D = \dfrac{\left\{\ce{−SO3- M+}\right\}}{[\ce{M+}]} = K × \dfrac{\left\{\ce{−SO3- H+}\right\}}{[\ce{H+}]}\tag{12.30}\]
is a function of the concentration of H+ and, therefore, the pH of the mobile phase.
An ion-exchange resin’s selectivity is somewhat dependent on whether it includes strong or weak exchange sites and on the extent of cross-linking. The latter is particularly important as it controls the resin’s permeability, and, therefore, the accessibility of exchange sites. An approximate order of selectivity for a typical strong acid cation exchange resin, in order of decreasing D, is
Al3+ > Ba2+ > Pb2+ > Ca2+ > Ni2+ > Cd2+ > Cu2+ > Co2+ > Zn2+ > Mg2+ > Ag+ > K+ > NH4+ > Na+ > H+ > Li+
Note that highly charged ions bind more strongly than ions of lower charge, and that for ions of similar charge, those with a smaller hydrated radius (see Table 6.2 in Chapter 6), or that are more polarizable, bind more strongly. For a strong base anion exchanger the general elution order is
SO42– > I– > HSO4– > NO3– > > Br– > NO2– > Cl– > HCO3– > CH3COO– > OH– > F–
Again, ions of higher charge and of smaller hydrated radius bind more strongly than ions with a lower charge and a larger hydrated radius.
The mobile phase in IEC is usually an aqueous buffer, the pH and ionic composition of which determines a solute’s retention time. Gradient elutions are possible in which the mobile phase’s ionic strength or pH is changed with time. For example, an IEC separation of cations might use a dilute solution of HCl as the mobile phase. Increasing the concentration of HCl speeds the elution rate for more strongly retained cations because the higher concentration of H+ allows it to compete more successfully for the ion-exchange sites.
Note
From equation 12.30, a cation’s distribution ratio, D, becomes smaller when the concentration of H+ in the mobile phase increases.
An ion-exchange resin is incorporated into an HPLC column either as 5–11 μm porous polymer beads or by coating the resin on porous silica particles. Columns typically are 250 mm in length with internal diameters ranging from 2–5 mm.
Measuring the conductivity of the mobile phase as it elutes from the column is a universal detector for cationic and anionic analytes. Because the mobile phase contains a high concentration of ions—a mobile phase of dilute HCl, for example, contains significant concentrations of H+ and Cl–—we need a method for detecting the analytes in the presence of a significant background conductivity.
To minimize the mobile phase’s contribution to conductivity an ion-suppressor column is placed between the analytical column and the detector. This column selectively removes mobile phase ions without removing solute ions. For example, in cation-exchange chromatography using a dilute solution of HCl as the mobile phase, the suppressor column contains a strong base anion-exchange resin. The exchange reaction
\[\ce{H+}(aq) + \ce{Cl-}(aq) + \ce{Resin+OH-}(s) ⇋ \ce{Resin+Cl-}(s) + \ce{H2O}(l)\]
replaces the mobile phase ions H+ and Cl– with H2O. A similar process is used in anion-exchange chromatography where the suppressor column contains a cation-exchange resin. If the mobile phase is a solution of Na2CO3, the exchange reaction
\[\ce{2Na+}(aq) + \ce{CO3^2-}(aq) + \ce{2Resin- H+}(s) ⇋ \ce{2Resin- Na+}(s) + \ce{H2CO3}(aq)\]
replaces a strong electrolyte, Na2CO3, with a weak electrolyte, H2CO3.
Ion-suppression is necessary when the mobile phase contains a high concentration of ions. Single-column ion chromatography, in which an ion-suppressor column is not needed, is possible if the concentration of ions in the mobile phase is small. Typically the stationary phase is a resin with a low capacity for ion-exchange and the mobile phase is a very dilute solution of methane sulfonic acid for cationic analytes, or potassium benzoate or potassium hydrogen phthalate for anionic analytes. Because the background conductivity is sufficiently small, it is possible to monitor a change in conductivity as the analytes elute from the column.
A UV/Vis absorbance detector can also be used if the analytes absorb ultraviolet or visible radiation. Alternatively, we can detect indirectly analytes that do not absorb in the UV/Vis if the mobile phase contains a UV/Vis absorbing species. In this case, when a solute band passes through the detector, a decrease in absorbance is measured at the detector.
Ion-exchange chromatography is an important technique for the analysis of anions and cations in water. For example, an ion-exchange chromatographic analysis for the anions F–, Cl–, Br–, NO2–, NO3–, PO43–, and SO42– takes approximately 15 minutes (Figure 12.53). A complete analysis of the same set of anions by a combination of potentiometry and spectrophotometry requires 1–2 days. Ion-exchange chromatography also has been used for the analysis of proteins, amino acids, sugars, nucleotides, pharmaceuticals, consumer products, and clinical samples.
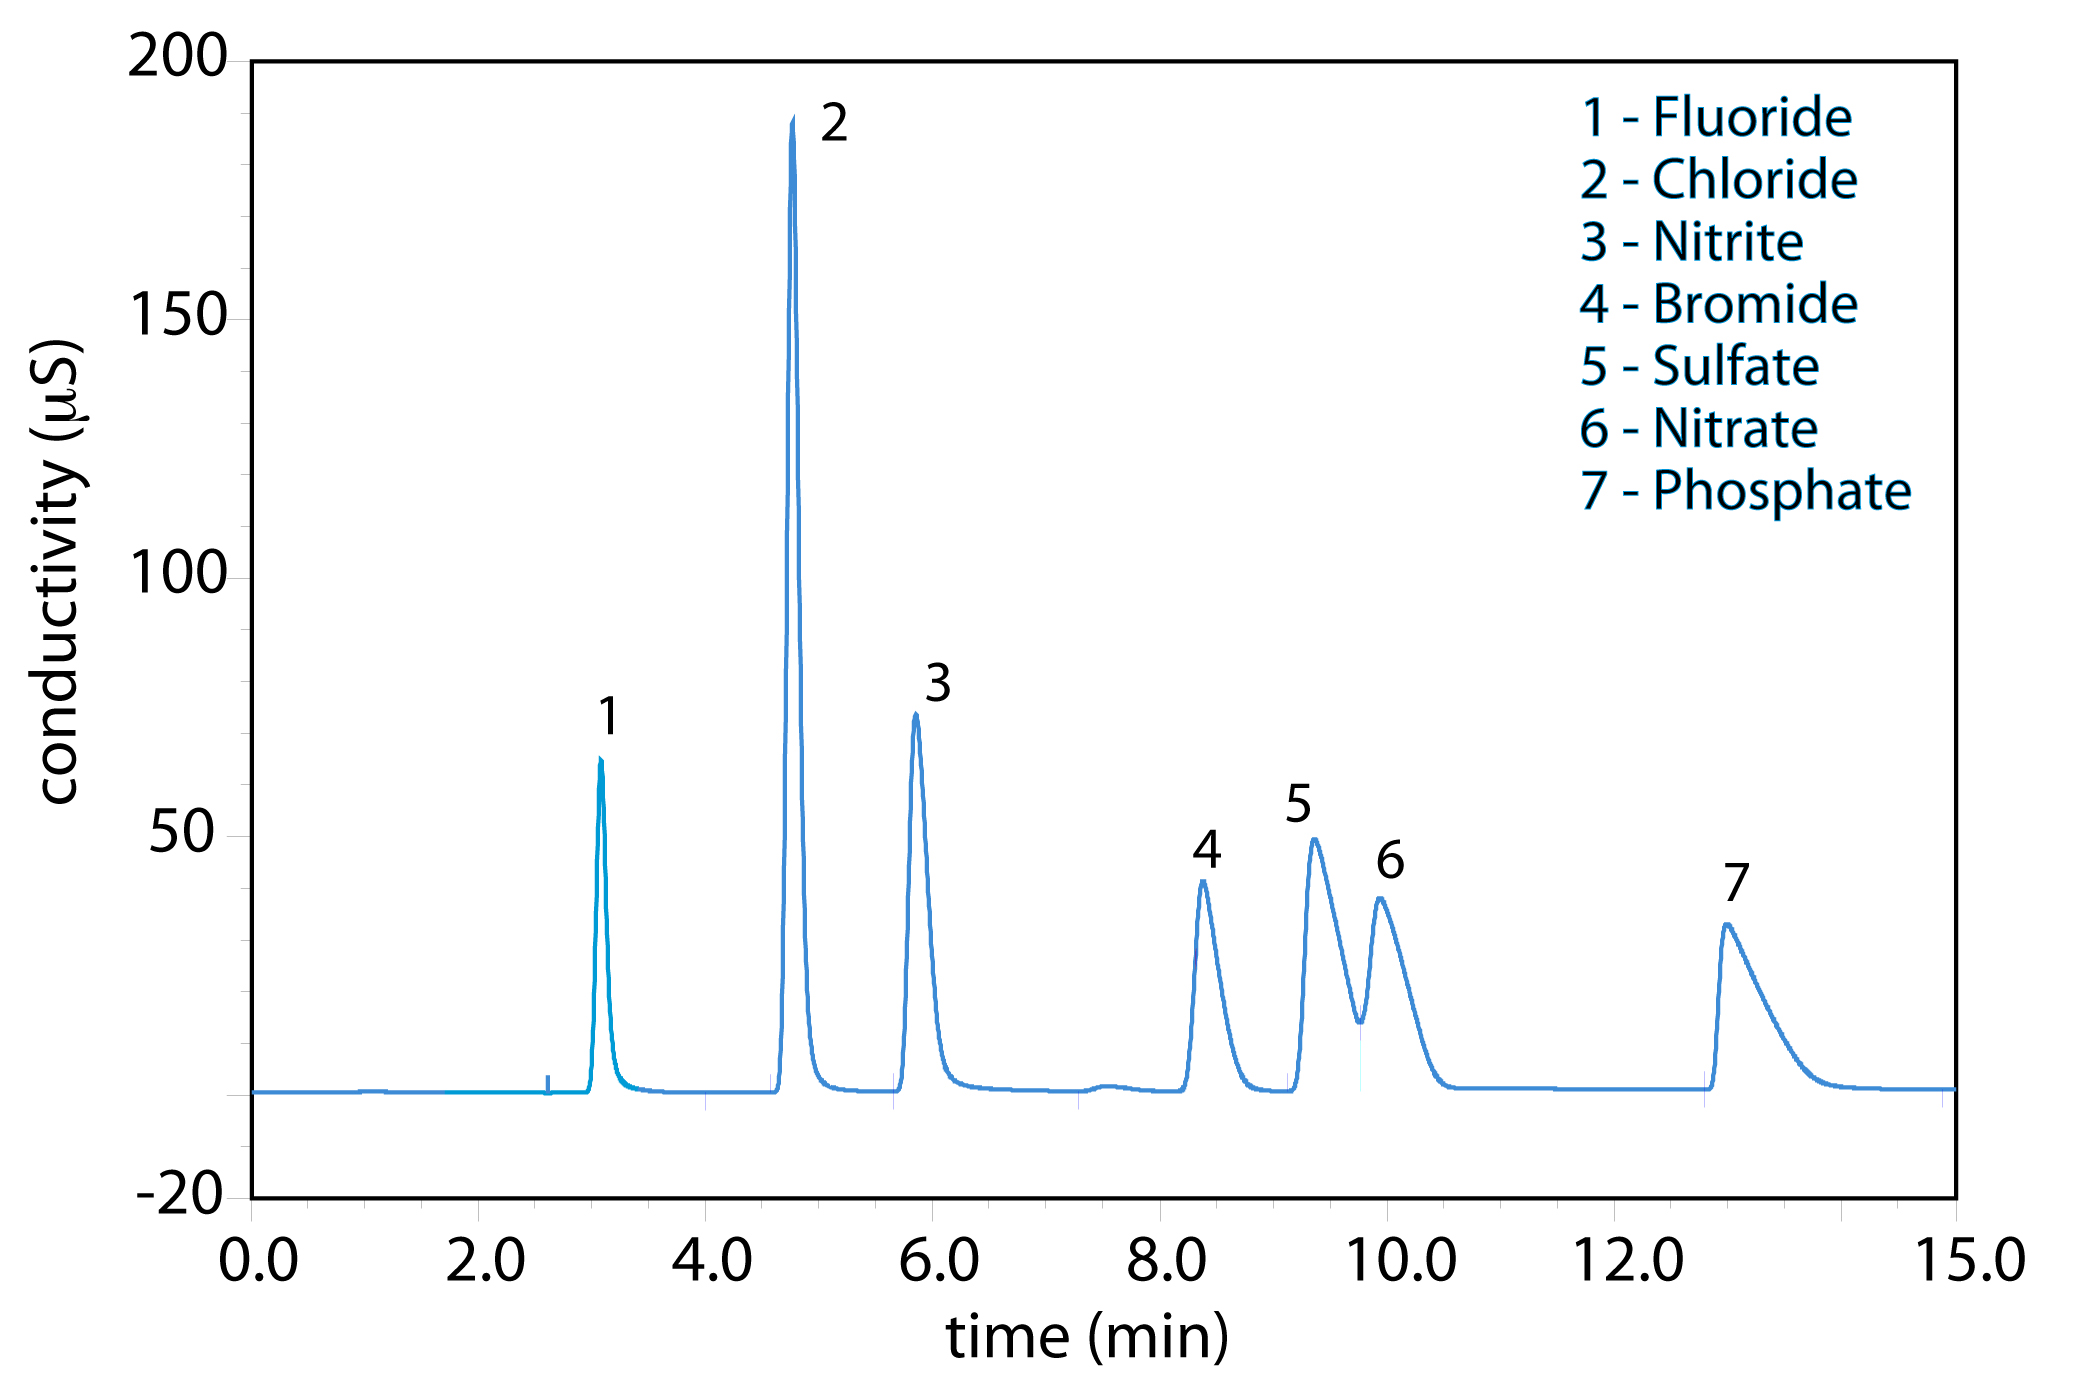
Figure 12.53 Ion-exchange chromatographic analysis of water from Big Walnut Creek in Putnam County, Indiana. Data provided by Jeanette Pope, Department of Geosciences, DePauw University.
12.6.3 Size-Exclusion Chromatography
We have considered two classes of micron-sized stationary phases in this section: silica particles and cross-linked polymer resin beads. Both materials are porous, with pore sizes ranging from approximately 5–400 nm for silica particles, and from 5 nm to 100 μm for divinylbenzene cross-linked polystyrene resins. In size-exclusion chromatography—which also is known by the terms molecular-exclusion or gel permeation chromatography—the separation of solutes depends upon their ability to enter into the pores of the stationary phase. Smaller solutes spend proportionally more time within the pores and take longer to elute from the column.
A stationary phase’s size selectivity extends over a finite range. All solutes significantly smaller than the pores move through the column’s entire volume and elute simultaneously, with a retention volume, Vr, of
\[V_\ce{r} = V_\ce{i} + V_\ce{o}\tag{12.31}\]
where Vi is the volume of mobile phase occupying the stationary phase’s pore space, and Vo is volume of mobile phase in the remainder of the column. The largest solute for which equation 12.31 holds is the column’s inclusion limit, or permeation limit. Those solutes that are too large to enter the pores elute simultaneously with an retention volume of
\[V_\ce{r} = V_\ce{o}\tag{12.32}\]
Equation 12.32 defines the column’s exclusion limit.
For a solute whose size is between the inclusion limit and the exclusion limit, the amount of time it spends in the stationary phase’s pore space is proportional to its size. The retention volume for these solutes is
\[V_\ce{r} = V_\ce{o} + DV_\ce{i}\tag{12.33}\]
where D is the solute’s distribution ratio, which ranges from 0 at the exclusion limit, to 1 at the inclusion limit. Equation 12.33 assumes that size-exclusion is the only interaction between the solute and the stationary phase that affects the separation. For this reason, stationary phases using silica particles are deactivated as described earlier, and polymer resins are synthesized without exchange sites.
Size-exclusion chromatography provides a rapid means for separating larger molecules, including polymers and biomolecules. A stationary phase for proteins consisting of particles with 30 nm pores has an inclusion limit of 7500 g/mol and an exclusion limit of 1.2 × 10⁶ g/mol. Mixtures containing proteins spanning a wider range of molecular weights can be separated by joining together in series several columns with different inclusion and exclusion limits.
Another important application of size-exclusion chromatography is the estimation of a solute’s molecular weight (MW). Calibration curves are prepared using a series of standards of known molecular weight and measuring each standard’s retention volume. As shown in Figure 12.54, a plot of log(MW) versus Vr is roughly linear between the exclusion limit and the inclusion limit. Because a solute’s retention volume is influenced by both its size and its shape, a reasonably accurate estimation of molecular weight is possible only if the standards are carefully chosen to minimize the effect of shape.
Size-exclusion chromatography can be carried out using conventional HPLC instrumentation, replacing the HPLC column with an appropriate size-exclusion column. A UV/Vis detector is the most common means for obtaining the chromatogram.
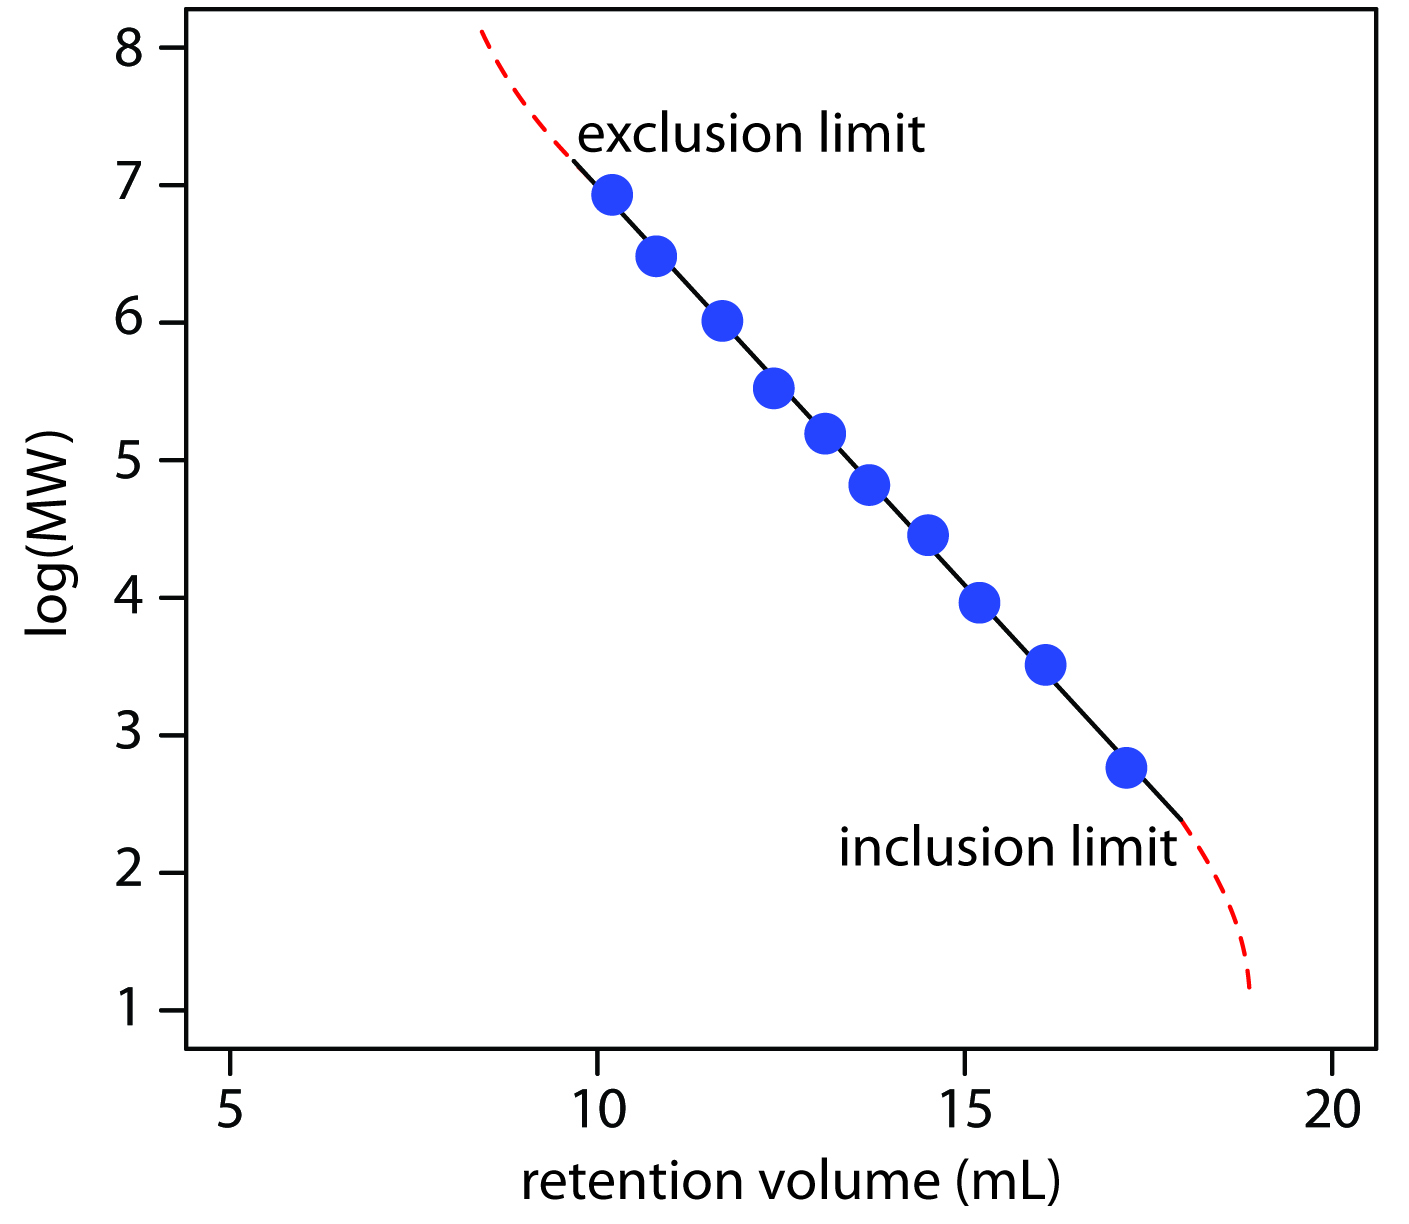
Figure 12.54 Calibration curve for the determination of molecular weight by size-exclusion chromatography. The data shown here are adapted from Rouessac, F.; Rouessac, A. Chemical Analysis: Modern Instrumentation Methods and Techniques, Wiley: Chichester, England, 2004, p 141.
12.6.4 Supercritical Fluid Chromatography
Although there are many analytical applications of gas chromatography and liquid chromatography, they can not separate and analyze all types of samples. Capillary column GC can separate complex mixtures with excellent resolution and short analysis times. Its application is limited, however, to volatile analytes or to analytes made volatile by a suitable derivatization reaction. Liquid chromatography can separate a wider range of solutes than GC, but the most commonly used detectors—UV, fluorescence, and electrochemical—have poorer detection limits and smaller linear ranges than GC detectors, and are not as nearly universal in their selectivity.
For some samples, supercritical fluid chromatography (SFC) provides a useful alternative to gas chromatography and liquid chromatography. The mobile phase in supercritical fluid chromatography is a gas held at a temperature and pressure that exceeds its critical point (Figure 12.55). Under these conditions the mobile phase is neither a gas nor a liquid. Instead, the mobile phase is a supercritical fluid.
Note
Click here to see an interesting video demonstration of supercritical fluids from Nottingham Science City at the University of Nottingham.

Figure 12.55 Phase diagram showing the combinations of temperature and pressure for which a compound is in its solid state, its liquid state, and its gas state. For pressures and temperatures above the compound’s critical point, the compound is a supercritical fluid with properties intermediate between a gas and a liquid.
The properties of a supercritical fluid, as shown in Table 12.8, are intermediate between those of a gas and a liquid. Specifically, the viscosity of a supercritical fluid is similar to that for a gas, which means we can move a supercritical fluid can move through a capillary or a packed column without the high pressures needed in HPLC. Analysis time and resolution, although not as good as in GC, are usually better than in conventional HPLC. The density of a supercritical fluid is much closer to that of a liquid, which explains why supercritical fluids are good solvents. The mobile phase in SFC, therefore, behaves more like the liquid mobile phase in HPLC than the gaseous mobile phase in GC.
phase |
density (g cm–3) |
viscosity (g cm–1 s–1) |
diffusion coefficient (cm2 s–1) |
|---|---|---|---|
| gas | ≈ 10–3 | ≈ 10–4 | ≈ 0.1 |
| supercritical fluid | ≈ 0.1–1 | ≈ 10–4–10–3 | ≈ 10–4–10–3 |
| liquid | ≈ 1 | ≈ 10–2 | < 10–5 |
The most common mobile phase for supercritical fluid chromatography is CO2. Its low critical temperature, 3oC, and critical pressure, 72.9 atm, are relatively easy to achieve and maintain. Although supercritical CO2 is a good solvent for nonpolar organics, it is less useful for polar solutes. The addition of an organic modifier, such as methanol, improves the mobile phase’s elution strength. Other common mobile phases and their critical temperatures and pressures are listed in Table 12.9.
| compound | critical temperature (oC) | critical pressure (atm) |
|---|---|---|
| carbon dioxide | 31.3 | 72.9 |
| ethane | 32.4 | 48.3 |
| nitrous oxide | 36.5 | 71.4 |
| ammonia | 132.3 | 111.3 |
| diethyl ether | 193.6 | 36.3 |
| isopropanol | 235.3 | 47.0 |
| methanol | 240.5 | 78.9 |
| ethanol | 243.4 | 63.0 |
| water | 374.4 | 226.8 |
The instrumentation for supercritical fluid chromatography is essentially the same as that for a standard HPLC. The only important additions are a heated oven for the column and a pressure restrictor downstream from the column to maintain the critical pressure. Gradient elutions are accomplished by changing the applied pressure over time. The resulting change in the mobile phase’s density affects its solvent strength. Detection can be accomplished using standard GC detectors or HPLC detectors. Supercritical fluid chromatography has found many applications in the analysis of polymers, fossil fuels, waxes, drugs, and food products.