
13.5: Acid/Base Titration
- Page ID
- 45386

\( \newcommand{\vecs}[1]{\overset { \scriptstyle \rightharpoonup} {\mathbf{#1}} } \)
\( \newcommand{\vecd}[1]{\overset{-\!-\!\rightharpoonup}{\vphantom{a}\smash {#1}}} \)
\( \newcommand{\dsum}{\displaystyle\sum\limits} \)
\( \newcommand{\dint}{\displaystyle\int\limits} \)
\( \newcommand{\dlim}{\displaystyle\lim\limits} \)
\( \newcommand{\id}{\mathrm{id}}\) \( \newcommand{\Span}{\mathrm{span}}\)
( \newcommand{\kernel}{\mathrm{null}\,}\) \( \newcommand{\range}{\mathrm{range}\,}\)
\( \newcommand{\RealPart}{\mathrm{Re}}\) \( \newcommand{\ImaginaryPart}{\mathrm{Im}}\)
\( \newcommand{\Argument}{\mathrm{Arg}}\) \( \newcommand{\norm}[1]{\| #1 \|}\)
\( \newcommand{\inner}[2]{\langle #1, #2 \rangle}\)
\( \newcommand{\Span}{\mathrm{span}}\)
\( \newcommand{\id}{\mathrm{id}}\)
\( \newcommand{\Span}{\mathrm{span}}\)
\( \newcommand{\kernel}{\mathrm{null}\,}\)
\( \newcommand{\range}{\mathrm{range}\,}\)
\( \newcommand{\RealPart}{\mathrm{Re}}\)
\( \newcommand{\ImaginaryPart}{\mathrm{Im}}\)
\( \newcommand{\Argument}{\mathrm{Arg}}\)
\( \newcommand{\norm}[1]{\| #1 \|}\)
\( \newcommand{\inner}[2]{\langle #1, #2 \rangle}\)
\( \newcommand{\Span}{\mathrm{span}}\) \( \newcommand{\AA}{\unicode[.8,0]{x212B}}\)
\( \newcommand{\vectorA}[1]{\vec{#1}} % arrow\)
\( \newcommand{\vectorAt}[1]{\vec{\text{#1}}} % arrow\)
\( \newcommand{\vectorB}[1]{\overset { \scriptstyle \rightharpoonup} {\mathbf{#1}} } \)
\( \newcommand{\vectorC}[1]{\textbf{#1}} \)
\( \newcommand{\vectorD}[1]{\overrightarrow{#1}} \)
\( \newcommand{\vectorDt}[1]{\overrightarrow{\text{#1}}} \)
\( \newcommand{\vectE}[1]{\overset{-\!-\!\rightharpoonup}{\vphantom{a}\smash{\mathbf {#1}}}} \)
\( \newcommand{\vecs}[1]{\overset { \scriptstyle \rightharpoonup} {\mathbf{#1}} } \)
\(\newcommand{\longvect}{\overrightarrow}\)
\( \newcommand{\vecd}[1]{\overset{-\!-\!\rightharpoonup}{\vphantom{a}\smash {#1}}} \)
\(\newcommand{\avec}{\mathbf a}\) \(\newcommand{\bvec}{\mathbf b}\) \(\newcommand{\cvec}{\mathbf c}\) \(\newcommand{\dvec}{\mathbf d}\) \(\newcommand{\dtil}{\widetilde{\mathbf d}}\) \(\newcommand{\evec}{\mathbf e}\) \(\newcommand{\fvec}{\mathbf f}\) \(\newcommand{\nvec}{\mathbf n}\) \(\newcommand{\pvec}{\mathbf p}\) \(\newcommand{\qvec}{\mathbf q}\) \(\newcommand{\svec}{\mathbf s}\) \(\newcommand{\tvec}{\mathbf t}\) \(\newcommand{\uvec}{\mathbf u}\) \(\newcommand{\vvec}{\mathbf v}\) \(\newcommand{\wvec}{\mathbf w}\) \(\newcommand{\xvec}{\mathbf x}\) \(\newcommand{\yvec}{\mathbf y}\) \(\newcommand{\zvec}{\mathbf z}\) \(\newcommand{\rvec}{\mathbf r}\) \(\newcommand{\mvec}{\mathbf m}\) \(\newcommand{\zerovec}{\mathbf 0}\) \(\newcommand{\onevec}{\mathbf 1}\) \(\newcommand{\real}{\mathbb R}\) \(\newcommand{\twovec}[2]{\left[\begin{array}{r}#1 \\ #2 \end{array}\right]}\) \(\newcommand{\ctwovec}[2]{\left[\begin{array}{c}#1 \\ #2 \end{array}\right]}\) \(\newcommand{\threevec}[3]{\left[\begin{array}{r}#1 \\ #2 \\ #3 \end{array}\right]}\) \(\newcommand{\cthreevec}[3]{\left[\begin{array}{c}#1 \\ #2 \\ #3 \end{array}\right]}\) \(\newcommand{\fourvec}[4]{\left[\begin{array}{r}#1 \\ #2 \\ #3 \\ #4 \end{array}\right]}\) \(\newcommand{\cfourvec}[4]{\left[\begin{array}{c}#1 \\ #2 \\ #3 \\ #4 \end{array}\right]}\) \(\newcommand{\fivevec}[5]{\left[\begin{array}{r}#1 \\ #2 \\ #3 \\ #4 \\ #5 \\ \end{array}\right]}\) \(\newcommand{\cfivevec}[5]{\left[\begin{array}{c}#1 \\ #2 \\ #3 \\ #4 \\ #5 \\ \end{array}\right]}\) \(\newcommand{\mattwo}[4]{\left[\begin{array}{rr}#1 \amp #2 \\ #3 \amp #4 \\ \end{array}\right]}\) \(\newcommand{\laspan}[1]{\text{Span}\{#1\}}\) \(\newcommand{\bcal}{\cal B}\) \(\newcommand{\ccal}{\cal C}\) \(\newcommand{\scal}{\cal S}\) \(\newcommand{\wcal}{\cal W}\) \(\newcommand{\ecal}{\cal E}\) \(\newcommand{\coords}[2]{\left\{#1\right\}_{#2}}\) \(\newcommand{\gray}[1]{\color{gray}{#1}}\) \(\newcommand{\lgray}[1]{\color{lightgray}{#1}}\) \(\newcommand{\rank}{\operatorname{rank}}\) \(\newcommand{\row}{\text{Row}}\) \(\newcommand{\col}{\text{Col}}\) \(\renewcommand{\row}{\text{Row}}\) \(\newcommand{\nul}{\text{Nul}}\) \(\newcommand{\var}{\text{Var}}\) \(\newcommand{\corr}{\text{corr}}\) \(\newcommand{\len}[1]{\left|#1\right|}\) \(\newcommand{\bbar}{\overline{\bvec}}\) \(\newcommand{\bhat}{\widehat{\bvec}}\) \(\newcommand{\bperp}{\bvec^\perp}\) \(\newcommand{\xhat}{\widehat{\xvec}}\) \(\newcommand{\vhat}{\widehat{\vvec}}\) \(\newcommand{\uhat}{\widehat{\uvec}}\) \(\newcommand{\what}{\widehat{\wvec}}\) \(\newcommand{\Sighat}{\widehat{\Sigma}}\) \(\newcommand{\lt}{<}\) \(\newcommand{\gt}{>}\) \(\newcommand{\amp}{&}\) \(\definecolor{fillinmathshade}{gray}{0.9}\)Make sure you thoroughly understand the following essential concepts:
- Sketch out a plot representing the titration of a strong monoprotic acid by a strong base, or of a strong base titrated by a strong acid. Identify the equivalence point and explain its significance.
- On the plot referred to above, draw a similar plot that would correspond to the same system at a higher or lower concentration.
- Sketch out a plot representing the titration of a weak monoprotic acid by a strong base, or of a weak base titrated by a strong acid. Identify the equivalence point and half-equivalence points.
- Explain what an acid-base indicator is, and how it works.
- When solutions of some polyprotic acids are titrated with strong base, not all of the equivalence points can be observed. Explain the most common reasons for this.
- Calculate the molarity of a monoprotic acid HA whose titration endpoint occurs after V ml of strong base of a given concentration has been added.
The objective of an acid-base titration is to determine \(C_a\), the nominal concentration of acid in the solution. In its simplest form, titration is carried out by measuring the volume of the solution of strong base required to complete the reaction
\[\ce{H_nA + n OH- → n A- + n H_2O} \label{0-1}\]
in which \(n\) is the number of replaceable hydrogens in the acid. The point at which this reaction is just complete is known as the equivalence point. This is to be distinguished from the end point, which is the value we observe experimentally. A replaceable hydrogen atom (sometimes called an "acidic" hydrogen) is one that can be donated to a strong base — that is, to an OH– ion. Thus in acetic acid HCOOH, only the hydrogen in the carboxyl group is considered "replaceable".
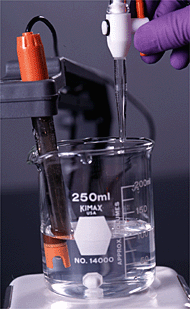
What we actually measure, of course, is the volume of titrant delivered by the burette. Learning to properly control the stopcock at the bottom of the burette usually requires some instruction and practice, as does the reading of the volume. For highly precise work, the concentration of the titrant itself must be determined in a separate experiment known as "standardization".
Understanding Titration Curves
A plot showing the pH of the solution as a function of the quantity of base added is known as a titration curve. These plots can be constructed by plotting the pH as a function of either the volume of base added, or the equivalent fraction \(ƒ\) which is simply the number of moles of base added per mole of acid present in the solution. In most of the titration curves illustrated in this section, we plot pH as a function of \(ƒ\). It's worth taking some time to thoroughly familiarize yourself with the general form of a titration curve such as the one shown below, in which a weak acid HA is titrated with a strong base, typically sodium hydroxide.
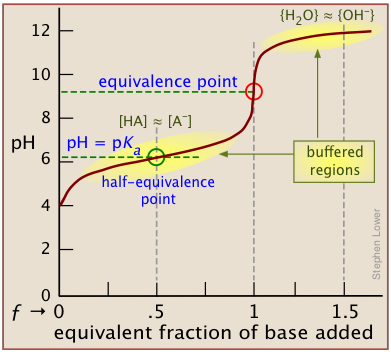
The equivalence point occurs at the pH at which the equivalent fraction ƒ of base added is unity. At this point, the reaction
\[HA + OH^– → AB^– + H_2O \label{1-1}\]
is stoichiometrically complete; a solution initially containing n moles of a monoprotic acid HA will now be identical to one containing the same number of moles of the conjugate base A–. At the half-equivalence point ƒ = 0.5, the concentrations of the conjugate species are identical: [HA] = [A–]. This, of course corresponds to a buffer solution (hence the relatively flat part of the curve) whose pH is the same as pKa.
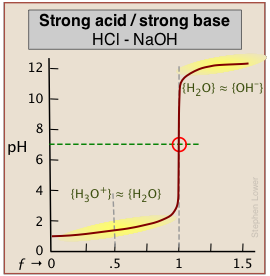
As base is added beyond ƒ = 1, the pH begins to level off, suggesting that another buffered system has come into play. In this case it involves the solvent (water) and hydroxide ion: {H2O} ≈ {OH-}.
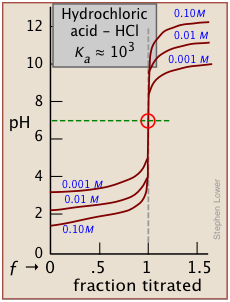
A similar effect is seen at the low-pH side of the curve when a strong acid is titrated, as in the plot for the titration of HCl below. In this case, the buffering is due to {H3O+) ≈ {H2O}.
How can this be? Surely, the concentration of OH–, even when the pH approaches 14, cannot be anything like that of [H2O] which will be about 55.5 M in most solutions! This fine point (along with the mention of H2O/OH– buffering) is rarely mentioned in elementary courses because the theory behind it involves some rather esoteric elements of solution thermodynamics. However, in case you are curious, note that the curly brackets in {H2O} ≈ {OH–} denote activities, not concentrations. And by convention the activity of a pure liquid (H2O in this case) is unity. At a pH of around 12, pOH = 2, [OH–] = .01. At this rather high ion concentration, {OH–} will be somewhat smaller than this, but the two activities will be similar enough to produce the buffering effect we observe.
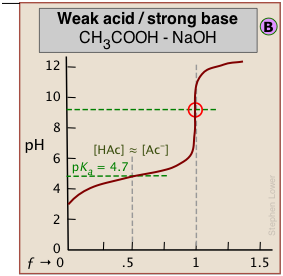
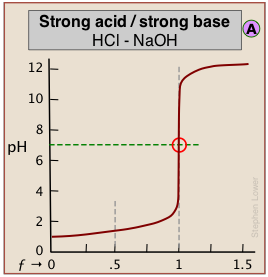
The pH of the solution at its equivalence point will be 7 if we are titrating a strong acid with strong base, as in HCl + NaOH → H2O + NaCl. However, if the acid is weak, as in the above plot, the solution will be alkaline. This pH can be calculated from Cb and Kb in a manner exactly analogous to that used for calculating the pH of a solution of a weak acid in water.
It is important to understand that the equivalent fraction ƒ of base that must be added to reach the equivalence point is independent of the strength of the acid and of its concentration in the solution. The whole utility of titration as a means of quantitative analysis rests on this independence; we are in all cases measuring only the total number of moles of “acidic” hydrogens in the sample undergoing titration.
Acid and base strengths determine the shape of the curve
Although the strength of an acid has no effect on the location of the equivalence point, it does affect the shape of the titration curve and can be estimated on a plot of the curve.

The weaker the acid being titrated, the higher the initial pH (at ƒ=0), and the smaller will be the vertical height of the plot near the equivalence point. As we shall see later, this can make it difficult to locate the equivalence point if the acid is extremely weak.
Estimating the acid strength
As shown in plot  above, the pKa of a weak acid can be estimated by noting the pH that corresponds to the half-titration point ƒ = 0.5. Recalling that the pH is controlled by the ratio of conjugate species concentrations
\[pH = pK_a + \log \dfrac{[A^]}{[HA]} \label{1-2}\]
it will be apparent that this equation reduces to pH = pKa when the titration is half complete (that is, when [HA] = [A–]), the pH of the solution will be identical to the pKa of the acid. This equation does not work for strong acids owing to the strong buffering that occurs at the very low pH at which ƒ = 0.5.
As indicated here, the buffering has nothing to do with the acid HCl itself (which does not exist as such in water), but rather with its dissociation products H3O+ and OH–, "the strongest acid and base that can exist in water."
Monoprotic titration curves
The following two principles govern the detailed shape of a titration curve:
- The stronger the acid or base, the greater will be the slope of the curve near the equivalence point;
- The weaker the acid or base, the greater will the deviation of the pH from neutrality at the equivalence point.
It is important to understand the reasons for these two relations. The second is the simplest to explain. Titration of an acid HA with a base such as NaOH results in a solution of NaA; that is, a solution of the conjugate base A–. Being a base, it will react with water to yield an excess of hydroxide ions, leaving a slightly alkaline solution. Titration of a weak base with an acid will have the opposite effect.
The extent of the jump in the pH at the equivalence point is determined by a combination of factors. In the case of a weak acid, for example, the initial pH is likely to be higher, so the titration curve starts higher. Further, the weaker the acid, the stronger will be its conjugate base, so the higher will be the pH at the equivalence point. These two factors raise the bottom part of the titration curve. The upper extent of the curve is of course limited by the concentration and strength of the titrant.
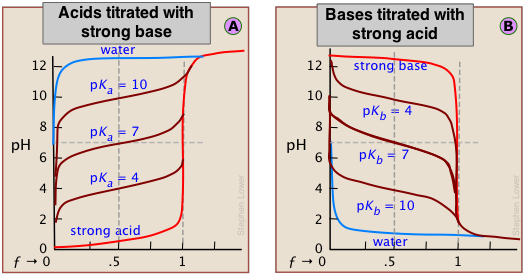
These principles are clearly evident in the above plots for the titrations of acids and bases having various strengths. Notice the blue curves that represent the titration of pure water (a very weak acid) with strong acid or base.
Monoprotic titration curve gallery

When both the titrant and sample are "strong", we get long vertical plots at ƒ = 1. Adding even half a drop of titrant can take us across the equivalence point!
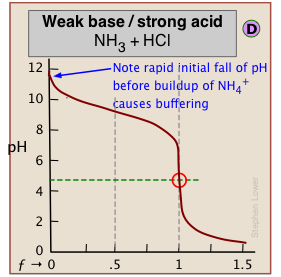
When one of the reactants is weak, the pH changes rapidly at first until buffering sets in.
← In (C), the onset of H2O/OH- buffering near ƒ=1 makes the equivalence point more difficult to locate.
"Weak/weak" titrations tend to be problematic as the buffered regions move closer to ƒ=1. The equivalence point pH of 7 in these examples reflects the near-equality of pKa and pKb of the reactants.

Dealing with very weak acids
It can be difficult to reliably detect the equivalence point in the titration of boric acid (pKa = 9.3) or of other similarly weak acids from the shape of the titration curve*. *An interesting student laboratory experiment that employs an auxiliary reagent (mannitol) to make boric acid stronger and thus more readily titratable was described in J. Chem Ed. 2012, 89, 767-770.
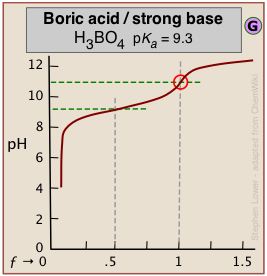
The problem here is that aqueous solutions are buffered against pH change at very low and very high pH ranges. An extreme example occurs in the titration of pure water with a strong acid or base. At these extremes of pH the concentrations of H3O+ and of OH– are sufficiently great that a competing buffer system (either H3O+/H2O or H2O/OH–, depending on whether the solution is highly acidic or highly alkaline) comes into play.
Why we usually use a "strong" titrant
The above plots clearly show that the most easily-detectable equivalence points occur when an acid with is titrated with a strong base such as sodium hydroxide (or a base is titrated with a strong acid.)
In practice, many of the titrations carried out in research, industry, and clinical practice involve mixtures of more than one acid. Examples include natural waters, physiological fluids, fruit juices, wine making, brewing, and industrial effluents. For titrating these kinds of samples, the use of anything other than a strong titrant presents the possibility that the titrant may be weaker than one or more of the "stronger" components in the sample, in which case it would be incapable of titrating these components to completion.
In terms of proton-free energies, the proton source (the acidic titrant) would be unable to deliver an equivalent quantity of protons to the (stronger) component of the mixture.
Polyprotic acids
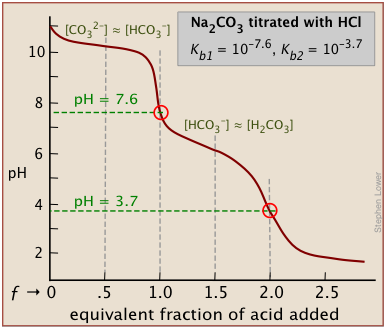
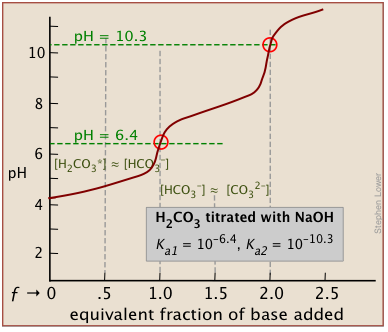
There will be as many equivalence points as there are replaceable hydrogens in an acid. Thus in the extremely important carbonate system, equivalence points are seen at both ƒ=1 and ƒ=2:
In general, there are two requirements for a clearly discernible jump in the pH to occur in a polyprotic titration:
- The successive Ka's must differ by several orders of magnitude;
- The pH of the equivalence point must not be very high or very low.
Separation of successive equilibrium constants
The effect of the first point is seen by comparing the titration curves of two diprotic acids, sulfurous and succinic. The appearance of only one equivalence point in the latter is a consequence of the closeness of the first and second acid dissociation constants. The pKa's of sulfurous acid (below, left) are sufficiently far apart that its titration curve can be regarded as the superposition of those for two independent monoprotic acids having the corresponding Ka's. This reflects the fact that the two acidic –OH groups are connected to the same central atom, so that the local negative charge that remains when HSO3– is formed acts to suppress the second dissociation step.
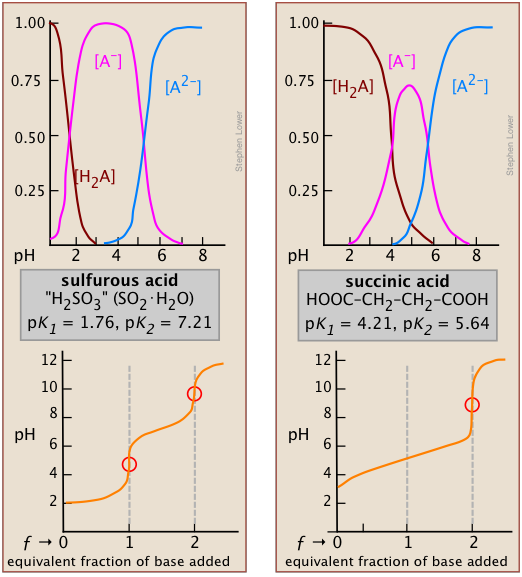
*It can be shown that in the limit of large n, the ratio of K1/K2 for a symmetrical dicarboxylic acid HOOC-(CH2)n- COOH converges to a value of 4.
In succinic acid, the two –COOH groups are physically more separated and thus tend to dissociate independently*. Inspection of the species distribution curves for succinic acid (above, right) reveals that the fraction of the ampholyte HA can never exceed 75 percent. That is, there is no pH at which the reaction H2A → HA– + H+ can be said to be “complete” while at the same time the second step HA– → A2– + H+ has occurred to only a negligible extent. Thus the rise in the pH that would normally be expected as HA is produced will be prevented by consumption of OH– in the second step which will be well underway at that point; only when all steps are completed and hydroxide ion is no longer being consumed will the pH rise.
Two other examples of polyprotic acids whose titration curves do not reveal all of the equivalence points are sulfuric and phosphoric acids. Owing to the leveling effect, the apparent Ka1 of H2SO4 is so close to Ka2 = 0.01 that the effect is the same as in succinic acid, so only the second equivalence point is detected.
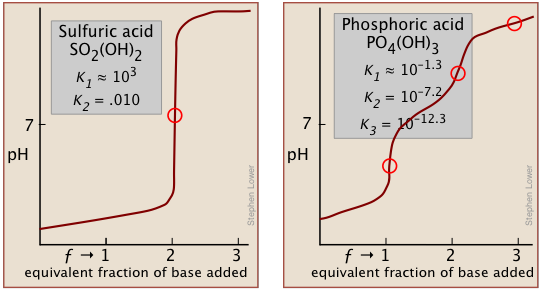
In phosphoric acid, the third equivalence point (for HPO42–) is obscured by H2O-OH– buffering as explained previously.
Detection of the equivalence point
Whether or not the equivalence point is revealed by a distinct "break" in the titration curve, it will correspond to a unique hydrogen ion concentration which can be calculated in advance. There are many ways of determining the equivalence point of an acid-base titration.
Indicators
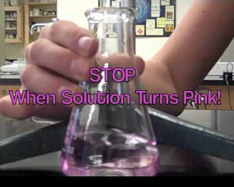
Don't overshoot the equiv point!
The traditional method of detecting the equivalence point has been to employ an indicator dye, which is a second acid-base system in which the protonated and deprotonated forms differ in color, and whose pKa is close to the pH expected at the equivalence point. If the acid being titrated is not a strong one, it is important to keep the indicator concentration as low as possible in order to prevent its own consumption of OH– from distorting the titration curve.
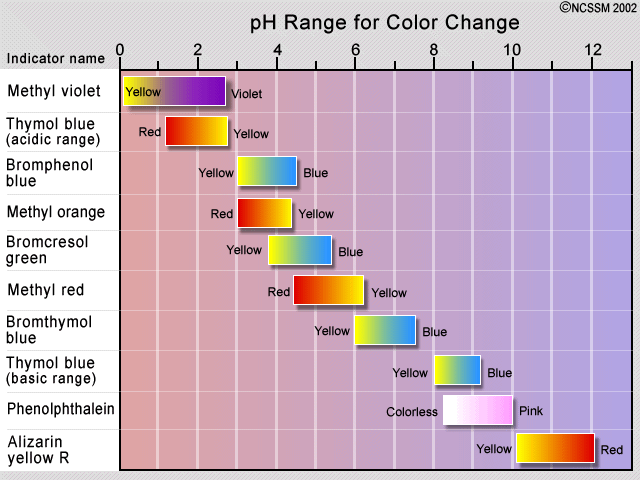
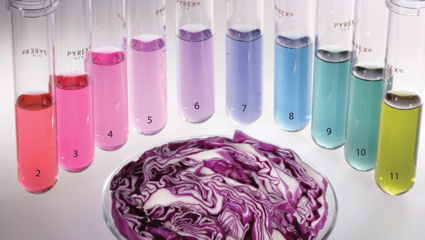
The observed color change of an indicator does not take place sharply, but occurs over a range of about 1.5 to 2 pH units. Indicators are therefore only useful in the titration of acids and bases that are sufficiently strong to show a definite break in the titration curve. Some plants contain coloring agents that can act as natural pH indicators. These include cabbage (shown), beets, and hydrangea flowers.
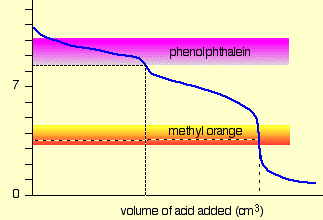
For a strong acid - strong base titration, almost any indicator can be used, although phenolphthalein is most commonly employed. For titrations involving weak acids or bases, as in the acid titration of sodium carbonate solution shown here, the indicator should have a pK close to that of the substance being titrated.
When titrating a polyprotic acid or base, multiple indicators are required if more than one equivalence point is to be seen. The pKas of phenolphthalein and methyl orange are 9.3 and 3.7, respectively.
Potentiometry: Use a pH meter
The pH meter detects the voltage produced when the H+ ions in the solution displace Na+ ions from a thin glass membrane that is dipped into the solution.
A more modern way of finding an equivalence point is to follow the titration by means of a pH meter. Because it involves measuring the electrical potential difference between two electrodes, this method is known as potentiometry. Until around 1980, pH meters were too expensive for regular use in student laboratories, but this has changed; potentiometry is now the standard tool for determining equivalence points.
Improved plotting methods
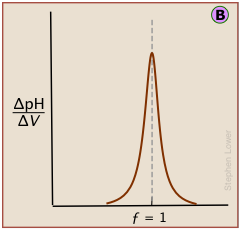
Plotting the pH after each volume increment of titrant has been added can yield a titration curve as detailed as desired, but there are better ways of locating the equivalence point. The most common of these is to take the first or second derivatives of the plot: d(pH)/dV or d2(pH)/dV2 (of course, for finite increments of pH and volume, these terms would be expressed as Δ(pH)/ΔV and Δ2(pH)/ΔV2 .)
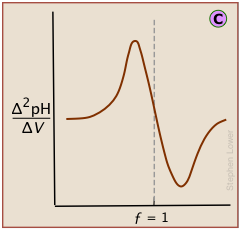
A second-derivative curve locates the inflection point by finding where the rate at which the pH changes is zero.
The differential plot, showing rate-of-change of pH against titrant volume, locates the inflection point which is also the equivalence point
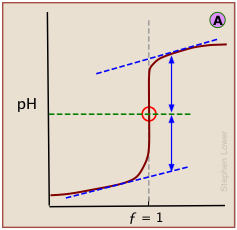
In a standard plot of pH-vs-volume of titrant added, the inflection point is located visually as half-way along the steepest part of the curve.
The idealized plots shown above are unlikely to be seen in practice. When the titration is carried out manually, the titrant is added in increments, so even the simple titration curve ![]() must be constructed from points subject to uncertainties in volume measurement and pH (especially if the latter is visually estimated by color change of an indicator.)
must be constructed from points subject to uncertainties in volume measurement and pH (especially if the latter is visually estimated by color change of an indicator.)
If this data is then converted to differential form, these uncertainties add a certain amount of "noise" to the data.
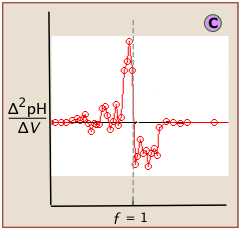
A second-derivative plot uses pH readings on both sides of the equivalence point, making it easier to locate in the presence of noise.
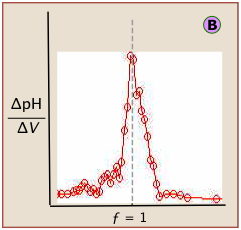
Locating the equivalence point depends very strongly on correct reading of only one or two pH readings near the top of the plot.
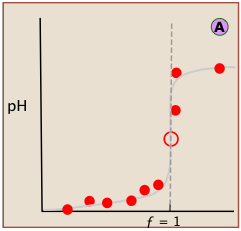
A simple curve, plotted from a small number of pH readings, will not always unambiguously locate the equivalence point.
The "noise" in differential plots can usually be minimized by keeping the titrant and analyte concentrations above 10–3 M.
Some other ways of following a titration
Monitoring the pH by means of an indicator or by potentiometry as described above are the standard ways of detecting the equivalence point of a titration. However, we have already seen that in certain cases involving polyprotic acids or bases, some of the equivalence points are obscured by their close proximity to others, or by the buffering that occurs near the extremes of the pH range. Similar problems can arise when the solution to be titrated contains several different acids, as often happens when fluids connected with industrial processes must be monitored.
Take the temperature!
Acid-base neutralization reactions HA + B → A– + BH+ are always exothermic; when protons fall from their level in the acid to that in the base, most of the free energy drop gets released as heat. If the acid and base are both strong (i.e., totally dissociated), the enthalpy of neutralization for the reaction
\[\ce{H3O+ + OH- → 2 H2O}\]
is -68 kJ mol–1.
See this Wikipedia page for more on thermometric titrations, including many examples. Note also the video on this topic in the "Videos" section near the end of this page.
- Thermometric titrations are not limited to acid-base determinations; they can also be used to follow precipitation-, complex formation-, and oxidation-reduction reactions.
- They can be used with polyprotic acids or bases, and with mixtures containing more than one acid or base.
- They are able to follow acid-base titrations that must be carried out in non-aqueous solvents, where other titration methods are not possible.
A typical thermometric titration curve consists of two branches, beginning with a steep rise in temperature as the titrant being added reacts with the analyte, liberating heat. Once the equivalence point is reached, the rise quickly diminishes as heat production stops. Then, as the mixture begins to cool, the plot assumes a negative slope.
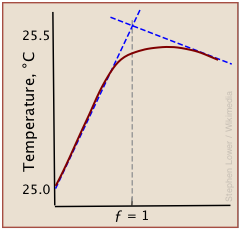
Although a rough indication of the equivalence point can be estimated by extrapolating the linear parts of the curve (blue dashed lines), the differential methods described above are generally preferred.
Follow the electrolytic conductance
Acids and bases are electrolytes, meaning that their solutions conduct electric current. The conductivity of such solutions depends on the concentrations of the ions, and to a lesser extent, on the nature of the particular ions. Any chemical reaction in which there is a change in the total quantity of ions in the solution can usually be followed by monitoring the conductance. Acid-base titrations fall into this category. Consider, for example, the titration of hydrochloric acid with sodium hydroxide. This can be described by the equation
\[\ce{H^{+} + Cl^{–} + Na^{+} + OH^{–} → H2O + Na^{+} + Cl^{–}} \label{2-1}\]
which shows that two of the four species of ions being combined disappear at the equivalence point. During the course of the titration, the conductance of the solution falls as H+ and Cl– ions are consumed. At the equivalence point the conductance passes through a minimum, and then rises as continued addition of titrant adds more Na+ and OH– ions to the solution.
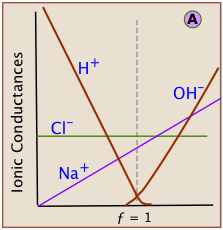
Each kind of ion makes its own contribution to the solution conductivity. If we could observe the contribution of each ion separately, see that the slopes for H+ and OH– are much greater. This reflects the much greater conductivities of these ions owing to their uniquely rapid movement through the solution by hopping across water molecules.
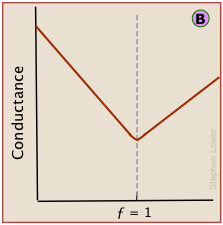
However, because the conductances of individual ions cannot be observed directly, conductance measurements always register the total conductances of all ions in the solution. The change in conductance that is actually observed during the titration of HCl by sodium hydroxide is the sum of the ionic conductances shown above.
For most ordinary acid-base titrations, conductimetry rarely offers any special advantage over regular volumetric analysis using indicators or potentiometry. This is especially true if the acid being titrated is weak; if the pKa is much below 2, the rising salt line (Na+ when titrating with NaOH) will overwhelm the fall in the contribution the small amount of H+ makes to the conductance, thus preventing any minimum in the total conductance curve from being seen.
However, in some special cases such as those illustrated below, conductimetry is the only method capable of yielding useful results.
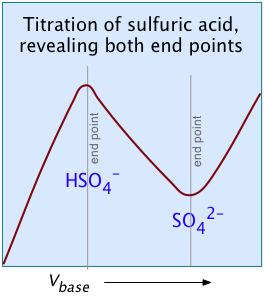
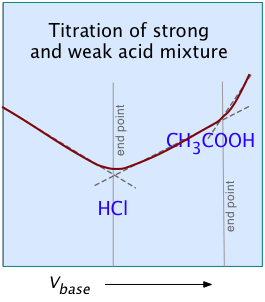
These examples illustrate two unique capabilities of conductimetric titrations: (left) Titration of a mixture of two acids and (right) Titration of a strong polyprotic acid →
Because pure H2SO2 is a neutral molecule, it makes no contribution to the conductance, which rises to a maximum at the equivalence point.
Automating the process
In four years of college lab sessions, many Chemistry majors will likely carry out fewer than a dozen titrations. However, in the real world, time is money, and long gone are the days when technicians were employed full time just to titrate multiple samples in such enterprises as breweries, food processing (such as blending of canned orange juice), clinical labs, and biochemical research.
Titration calculations
A titration is carried out by adding a sufficient volume \Vo of the titrant solution to a known volume \Vt of the solution being titrated. This addition continues until the end point is reached. The end point is our experimental approximation of the equivalence point at which the acid-base reaction is stoichiometrically complete (ƒ = 1). The quantity we actually measure at the end point is the volume V_ep of titrant delivered to the solution undergoing titration.
The solution being titrated is often referred to as the analyte (the substance being "analyzed") or, less commonly, as the titrand. We shall employ the latter term in what follows.
In a simple titration of a monoprotic acid HA by a base B, the equivalence point corresponds to completion of the reaction
\[\ce{HA + B → A^{–} + BH^{+} }\label{3-1}\]
where equimolar quantities of HA and B have been combined; that is,
MHA = MB (where M represents the number of moles.)
Recall that the number of moles is given by the product of the volume and concentration:
L × mol L–1 = mol,
mL x mMol ml–1 = mmol.
Because we are measuring the volume of titrant rather than the number of moles, we need to use its concentration to link the two quantities. So if we are titrating the base B with acid HA, the end point is reached when a volume V of HA has been added. The number of moles of HA we have added at the end point is given by the product of its volume and concentration
\[M_{HA} = V_{HA} \times C_{HA} \label{3-2}\]
And because the reaction \ref{3-1} is now complete, MHA = MB ; thus, at the end point of any monoprotic titration,
\[V_{HA} C_{HA} = V_B C_B \label{3-3}\]
Equation \ref{3-3} is important! In any titration, both the volume and the concentration of the titrant are known, so the unknown concentration is easily calculated.
In titrations carried out in the laboratory, the titrant is delivered by a burette that is usually calibrated in milliliters, so it is more convenient to express MHA in millimoles and CHA in millimoles/mL (mMol ml–1); note that the latter is numerically the same as moles/L.
50.0 mL of 0.100 M hydrochloric acid is titrated with 0.200 M sodium hydroxide. What volume of NaOH solution will have been added at the equivalence point?
Solution
First, find the number of moles of HCl in the titrand:
\[\begin{align*} M_{\ce{HCl}} &= C_{\ce{HCl}} \times V_{\ce{HCl}} \\[4pt] &= (0.100\, mMol\, mL^{–1}) \times (50.0\, mL) \\[4pt] &= 5.0 \,mMol\,\ce{HCl} \end{align*}\]
This same number of moles of NaOH must be delivered by the burette in order to reach the equivalence point (i.e., MNaOH = 5.0 mMol.)
The volume of NaOH solution MNaOH required is
VNaOH = (MNaOH / CNaOH ) = (5.0 mMol) / (0.200 mMol/mL) = 25 mL