
9.2: Equilibrium Constants
- Page ID
- 441043

\( \newcommand{\vecs}[1]{\overset { \scriptstyle \rightharpoonup} {\mathbf{#1}} } \)
\( \newcommand{\vecd}[1]{\overset{-\!-\!\rightharpoonup}{\vphantom{a}\smash {#1}}} \)
\( \newcommand{\dsum}{\displaystyle\sum\limits} \)
\( \newcommand{\dint}{\displaystyle\int\limits} \)
\( \newcommand{\dlim}{\displaystyle\lim\limits} \)
\( \newcommand{\id}{\mathrm{id}}\) \( \newcommand{\Span}{\mathrm{span}}\)
( \newcommand{\kernel}{\mathrm{null}\,}\) \( \newcommand{\range}{\mathrm{range}\,}\)
\( \newcommand{\RealPart}{\mathrm{Re}}\) \( \newcommand{\ImaginaryPart}{\mathrm{Im}}\)
\( \newcommand{\Argument}{\mathrm{Arg}}\) \( \newcommand{\norm}[1]{\| #1 \|}\)
\( \newcommand{\inner}[2]{\langle #1, #2 \rangle}\)
\( \newcommand{\Span}{\mathrm{span}}\)
\( \newcommand{\id}{\mathrm{id}}\)
\( \newcommand{\Span}{\mathrm{span}}\)
\( \newcommand{\kernel}{\mathrm{null}\,}\)
\( \newcommand{\range}{\mathrm{range}\,}\)
\( \newcommand{\RealPart}{\mathrm{Re}}\)
\( \newcommand{\ImaginaryPart}{\mathrm{Im}}\)
\( \newcommand{\Argument}{\mathrm{Arg}}\)
\( \newcommand{\norm}[1]{\| #1 \|}\)
\( \newcommand{\inner}[2]{\langle #1, #2 \rangle}\)
\( \newcommand{\Span}{\mathrm{span}}\) \( \newcommand{\AA}{\unicode[.8,0]{x212B}}\)
\( \newcommand{\vectorA}[1]{\vec{#1}} % arrow\)
\( \newcommand{\vectorAt}[1]{\vec{\text{#1}}} % arrow\)
\( \newcommand{\vectorB}[1]{\overset { \scriptstyle \rightharpoonup} {\mathbf{#1}} } \)
\( \newcommand{\vectorC}[1]{\textbf{#1}} \)
\( \newcommand{\vectorD}[1]{\overrightarrow{#1}} \)
\( \newcommand{\vectorDt}[1]{\overrightarrow{\text{#1}}} \)
\( \newcommand{\vectE}[1]{\overset{-\!-\!\rightharpoonup}{\vphantom{a}\smash{\mathbf {#1}}}} \)
\( \newcommand{\vecs}[1]{\overset { \scriptstyle \rightharpoonup} {\mathbf{#1}} } \)
\(\newcommand{\longvect}{\overrightarrow}\)
\( \newcommand{\vecd}[1]{\overset{-\!-\!\rightharpoonup}{\vphantom{a}\smash {#1}}} \)
\(\newcommand{\avec}{\mathbf a}\) \(\newcommand{\bvec}{\mathbf b}\) \(\newcommand{\cvec}{\mathbf c}\) \(\newcommand{\dvec}{\mathbf d}\) \(\newcommand{\dtil}{\widetilde{\mathbf d}}\) \(\newcommand{\evec}{\mathbf e}\) \(\newcommand{\fvec}{\mathbf f}\) \(\newcommand{\nvec}{\mathbf n}\) \(\newcommand{\pvec}{\mathbf p}\) \(\newcommand{\qvec}{\mathbf q}\) \(\newcommand{\svec}{\mathbf s}\) \(\newcommand{\tvec}{\mathbf t}\) \(\newcommand{\uvec}{\mathbf u}\) \(\newcommand{\vvec}{\mathbf v}\) \(\newcommand{\wvec}{\mathbf w}\) \(\newcommand{\xvec}{\mathbf x}\) \(\newcommand{\yvec}{\mathbf y}\) \(\newcommand{\zvec}{\mathbf z}\) \(\newcommand{\rvec}{\mathbf r}\) \(\newcommand{\mvec}{\mathbf m}\) \(\newcommand{\zerovec}{\mathbf 0}\) \(\newcommand{\onevec}{\mathbf 1}\) \(\newcommand{\real}{\mathbb R}\) \(\newcommand{\twovec}[2]{\left[\begin{array}{r}#1 \\ #2 \end{array}\right]}\) \(\newcommand{\ctwovec}[2]{\left[\begin{array}{c}#1 \\ #2 \end{array}\right]}\) \(\newcommand{\threevec}[3]{\left[\begin{array}{r}#1 \\ #2 \\ #3 \end{array}\right]}\) \(\newcommand{\cthreevec}[3]{\left[\begin{array}{c}#1 \\ #2 \\ #3 \end{array}\right]}\) \(\newcommand{\fourvec}[4]{\left[\begin{array}{r}#1 \\ #2 \\ #3 \\ #4 \end{array}\right]}\) \(\newcommand{\cfourvec}[4]{\left[\begin{array}{c}#1 \\ #2 \\ #3 \\ #4 \end{array}\right]}\) \(\newcommand{\fivevec}[5]{\left[\begin{array}{r}#1 \\ #2 \\ #3 \\ #4 \\ #5 \\ \end{array}\right]}\) \(\newcommand{\cfivevec}[5]{\left[\begin{array}{c}#1 \\ #2 \\ #3 \\ #4 \\ #5 \\ \end{array}\right]}\) \(\newcommand{\mattwo}[4]{\left[\begin{array}{rr}#1 \amp #2 \\ #3 \amp #4 \\ \end{array}\right]}\) \(\newcommand{\laspan}[1]{\text{Span}\{#1\}}\) \(\newcommand{\bcal}{\cal B}\) \(\newcommand{\ccal}{\cal C}\) \(\newcommand{\scal}{\cal S}\) \(\newcommand{\wcal}{\cal W}\) \(\newcommand{\ecal}{\cal E}\) \(\newcommand{\coords}[2]{\left\{#1\right\}_{#2}}\) \(\newcommand{\gray}[1]{\color{gray}{#1}}\) \(\newcommand{\lgray}[1]{\color{lightgray}{#1}}\) \(\newcommand{\rank}{\operatorname{rank}}\) \(\newcommand{\row}{\text{Row}}\) \(\newcommand{\col}{\text{Col}}\) \(\renewcommand{\row}{\text{Row}}\) \(\newcommand{\nul}{\text{Nul}}\) \(\newcommand{\var}{\text{Var}}\) \(\newcommand{\corr}{\text{corr}}\) \(\newcommand{\len}[1]{\left|#1\right|}\) \(\newcommand{\bbar}{\overline{\bvec}}\) \(\newcommand{\bhat}{\widehat{\bvec}}\) \(\newcommand{\bperp}{\bvec^\perp}\) \(\newcommand{\xhat}{\widehat{\xvec}}\) \(\newcommand{\vhat}{\widehat{\vvec}}\) \(\newcommand{\uhat}{\widehat{\uvec}}\) \(\newcommand{\what}{\widehat{\wvec}}\) \(\newcommand{\Sighat}{\widehat{\Sigma}}\) \(\newcommand{\lt}{<}\) \(\newcommand{\gt}{>}\) \(\newcommand{\amp}{&}\) \(\definecolor{fillinmathshade}{gray}{0.9}\)By the end of this section, you will be able to:
- Derive reaction quotients from chemical equations
- Calculate values of reaction quotients and equilibrium constants
- Relate the magnitude of an equilibrium constant to properties of the chemical system
- Describe the ways in which an equilibrium system can be stressed
- Predict the response of a stressed equilibrium using Le Chatelier’s principle
The status of a reversible reaction is conveniently assessed by evaluating its reaction quotient (Q). For a reversible reaction described by
\[ m \mathrm{A}+n \mathrm{B} \rightleftharpoons x \mathrm{C} + y \mathrm{D} \]
the reaction quotient is derived directly from the stoichiometry of the balanced equation where the subscript c denotes the use of molar concentrations in the expression as
\[ Q_c=\frac{[\mathrm{C}]^x[\mathrm{D}]^y}{[\mathrm{A}]^m[\mathrm{B}]^n} \]
Example
Writing Reaction Quotient Expressions
Write the concentration-based reaction quotient expression for each of the following reactions:(a)
(b)
(c)
Solution
(a) \( Q_c=\frac{[\mathrm{O_3}]^2}{[\mathrm{O_2}]^3} \)
(b) \( Q_c=\frac{[\mathrm{NH_3}]^2}{[\mathrm{N_2}] [\mathrm{H_2}]^3} \)
(c) \( Q_c=\frac{[\mathrm{NO_2}]^4 [\mathrm{H_2O}]^6}{[\mathrm{NH_3}]^4 [\mathrm{O_2}]^7} \)
Check Your Learning
Write the concentration-based reaction quotient expression for each of the following reactions:(a)
(b)
(c)
Answer:
(a) \(Q_c=\frac{[\mathrm{SO_3}]^2 }{[\mathrm{SO_2}]^2 [\mathrm{O_2}]} \)
(b) \( Q_c=\frac{[\mathrm{C_2H_4}]^2 }{[\mathrm{C_4H_8}]} \)
(c) \( Q_c=\frac{[\mathrm{CO_2}]^8 [\mathrm{H_2O}]^{10}}{[\mathrm{C_4H_10}]^2 [\mathrm{O_2}]^{13}} \)
The numerical value of Q varies as a reaction proceeds towards equilibrium; therefore, it can serve as a useful indicator of the reaction’s status. To illustrate this point, consider the oxidation of sulfur dioxide:
Two different experimental scenarios are depicted in Figure \(\PageIndex{1}\) , one in which this reaction is initiated with a mixture of reactants only, SO2 and O2, and another that begins with only product, SO3. For the reaction that begins with a mixture of reactants only, Q is initially equal to zero:
\[ Q_c=\frac{\left[\mathrm{SO}_3\right]^2}{\left[\mathrm{SO}_2\right]^2\left[\mathrm{O}_2\right]}=\frac{0^2}{\left[\mathrm{SO}_2\right]^2\left[\mathrm{O}_2\right]}= 0 \]
As the reaction proceeds toward equilibrium in the forward direction, reactant concentrations decrease (as does the denominator of Qc), product concentration increases (as does the numerator of Qc), and the reaction quotient consequently increases. When equilibrium is achieved, the concentrations of reactants and product remain constant, as does the value of Qc.
If the reaction begins with only product present, the value of Qc is initially undefined (immeasurably large, or infinite):
\[ Q_c=\frac{\left[\mathrm{SO}_3\right]^2}{\left[\mathrm{SO}_2\right]^2\left[\mathrm{O}_2\right]}=\frac{[\mathrm{SO}_3]}{0}=\infty \]In this case, the reaction proceeds toward equilibrium in the reverse direction. The product concentration and the numerator of Qc decrease with time, the reactant concentrations and the denominator of Qc increase, and the reaction quotient consequently decreases until it becomes constant at equilibrium.
The constant value of Q exhibited by a system at equilibrium is called the equilibrium constant, K:
\[ K \equiv q ~ at ~ equlibrium \] Comparison of the data plots in Figure \(\PageIndex{1}\) shows that both experimental scenarios resulted in the same value for the equilibrium constant. This is a general observation for all equilibrium systems, known as the law of mass action: At a given temperature, the reaction quotient for a system at equilibrium is constant.
Example
Evaluating a Reaction Quotient
Gaseous nitrogen dioxide forms dinitrogen tetroxide according to this equation:When 0.10 mol NO2 is added to a 1.0-L flask at 25 °C, the concentration changes so that at equilibrium, [NO2] = 0.016 M and [N2O4] = 0.042 M.
(a) What is the value of the reaction quotient before any reaction occurs?
(b) What is the value of the reaction quotent when the system reacheconstant for the reaction?
Solution
As for all equilibrium calculations in this text, use the simplified equations for Q and K and disregard any concentration or pressure units, as noted previously in this section.(a) Before any product is formed, and [N2O4] = 0 M. Thus,
(b) At equilibrium, The reaction quotient is 1.6 102.
Check Your Learning
For the reaction the concentrations at equilibrium are [SO2] = 0.90 M, [O2] = 0.35 M, and [SO3] = 1.1 M. What is the value of the reaction quotient at equlibrium?Answer:
Qc = 4.3
By its definition, the reaction quotient at equilibrium is called the equilibrium constant. the magnitude of an equilibrium constant explicitly reflects the composition of a reaction mixture at equilibrium, and it may be interpreted with regard to the extent of the forward reaction. A reaction exhibiting a large equilibrium constant will reach equilibrium when most of the reactant has been converted to product, whereas a small equilibrium constant indicates the reaction achieves equilibrium after very little reactant has been converted. It’s important to keep in mind that the magnitude of the equilibrium constant does not indicate how rapidly or slowly equilibrium will be reached. Some equilibria are established so quickly as to be nearly instantaneous, and others so slowly that no perceptible change is observed over the course of days, years, or longer.
The equilibrium constant for a reaction can be used to predict the behavior of mixtures containing its reactants and/or products. As demonstrated by the sulfur dioxide oxidation process described above, a chemical reaction will proceed in whatever direction is necessary to achieve equilibrium. Comparing Q to the equilibrium constant for an equilibrium system of interest allows prediction of what reaction (forward or reverse), if any, will occur.
To further illustrate this important point, consider the reversible reaction shown below, Kc is the symbol for the equilibrium constant:
The bar charts in Figure \(\PageIndex{2}\) represent changes in reactant and product concentrations for three different reaction mixtures. The reaction quotients for mixtures 1 and 3 are initially lesser than the reaction’s equilibrium constant, so each of these mixtures will experience a net forward reaction to achieve equilibrium. The reaction quotient for mixture 2 is initially greater than the equilibrium constant, so this mixture will proceed in the reverse direction until equilibrium is established.
Example
Predicting the Direction of Reaction
Given here are the starting concentrations of reactants and products for three experiments involving this reaction:Determine in which direction the reaction proceeds as it goes to equilibrium in each of the three experiments shown.
| Reactants/Products | Experiment 1 | Experiment 2 | Experiment 3 |
|---|---|---|---|
| [CO]i | 0.020 M | 0.011 M | 0.0094 M |
| [H2O]i | 0.020 M | 0.0011 M | 0.0025 M |
| [CO2]i | 0.0040 M | 0.037 M | 0.0015 M |
| [H2]i | 0.0040 M | 0.046 M | 0.0076 M |
Solution
Experiment 1:Qc < Kc (0.040 < 0.64)
The reaction will proceed in the forward direction.
Experiment 2:
Qc > Kc (140 > 0.64)
The reaction will proceed in the reverse direction.
Experiment 3:
Qc < Kc (0.48 < 0.64)
The reaction will proceed in the forward direction.
Check Your Learning
Calculate the reaction quotient and determine the direction in which each of the following reactions will proceed to reach equilibrium.(a) A 1.00-L flask containing 0.0500 mol of NO(g), 0.0155 mol of Cl2(g), and 0.500 mol of NOCl:
(b) A 5.0-L flask containing 17 g of NH3, 14 g of N2, and 12 g of H2:
(c) A 2.00-L flask containing 230 g of SO3(g):
Answer:
(a) Qc = 6.45 103, forward. (b) Qc = 0.23, reverse. (c) Qc = 0, forward.
Predicting the Direction of a Reversible Reaction
As we saw in the previous section, reactions proceed in both directions (reactants go to products and products go to reactants). We can tell a reaction is at equilibrium if the reaction quotient (\(Q\)) is equal to the equilibrium constant (K). We next address what happens when a system at equilibrium is disturbed so that \(Q\) is no longer equal to \(K\). If a system at equilibrium is subjected to a perturbance or stress (such as a change in concentration) the position of equilibrium changes. Since this stress affects the concentrations of the reactants and the products, the value of \(Q\) will no longer equal the value of \(K\). To re-establish equilibrium, the system will either shift toward the products (if \(Q < K\)) or the reactants (if \(Q > K\)) until \(Q\) returns to the same value as \(K\).
This process is described by Le Chatelier's principle: When a chemical system at equilibrium is disturbed, it returns to equilibrium by counteracting the disturbance. As described in the previous paragraph, the disturbance causes a change in \(Q\); the reaction will shift to re-establish \(Q = K\).
Le Chatelier's principle can be used to predict changes in equilibrium concentrations when a system that is at equilibrium is subjected to a stress. However, if we have a mixture of reactants and products that have not yet reached equilibrium, the changes necessary to reach equilibrium may not be so obvious. In such a case, we can compare the values of Q and K for the system to predict the changes.
A chemical system at equilibrium can be temporarily shifted out of equilibrium by adding or removing one or more of the reactants or products. The concentrations of both reactants and products then undergo additional changes to return the system to equilibrium.
The stress on the system in Figure \(\PageIndex{3}\) is the reduction of the equilibrium concentration of SCN− (lowering the concentration of one of the reactants would cause Q to be larger than K). As a consequence, Le Chatelier's principle leads us to predict that the concentration of Fe(SCN)2+ should decrease, increasing the concentration of SCN− part way back to its original concentration, and increasing the concentration of Fe3+ above its initial equilibrium concentration.
The effect of a change in concentration on a system at equilibrium is illustrated further by the equilibrium of this chemical reaction:
\[\ce{H}_{2(g)}+\ce{I}_{2(g)} \rightleftharpoons \ce{2HI}_{(g)} \label{13.4.1a} \]
\[K_c=\mathrm{50.0 \; at\; 400°C} \label{13.4.1b} \]
The numeric values for this example have been determined experimentally. A mixture of gases at 400 °C with \(\mathrm{[H_2] = [I_2]} = 0.221\; M\) and \(\ce{[HI]} = 1.563 \;M\) is at equilibrium; for this mixture, \(Q_c = K_c = 50.0\). If \(\ce{H_2}\) is introduced into the system so quickly that its concentration doubles before it begins to react (new \(\ce{[H_2]} = 0.442\; M\)), the reaction will shift so that a new equilibrium is reached, at which
- \(\ce{[H_2]} = 0.374\; M\),
- \(\ce{[I_2]} = 0.153\; M\), and
- \(\ce{[HI]} = 1.692\; M\).
This gives:
\[Q_c=\mathrm{\dfrac{[HI]^2}{[H_2][I_2]}}=\dfrac{(1.692)^2}{(0.374)(0.153)}=50.0=K_c \label{13.4.2} \]
We have stressed this system by introducing additional \(\ce{H_2}\). The stress is relieved when the reaction shifts to the right, using up some (but not all) of the excess \(\ce{H_2}\), reducing the amount of uncombined \(\ce{I_2}\), and forming additional \(\ce{HI}\).
Effect of Change in Pressure on Equilibrium
Sometimes we can change the position of equilibrium by changing the pressure of a system. However, changes in pressure have a measurable effect only in systems in which gases are involved, and then only when the chemical reaction produces a change in the total number of gas molecules in the system. An easy way to recognize such a system is to look for different numbers of moles of gas on the reactant and product sides of the equilibrium. While evaluating pressure (as well as related factors like volume), it is important to remember that equilibrium constants are defined with regard to concentration (for \(K_c\)) or partial pressure (for \(K_P\)). Some changes to total pressure, like adding an inert gas that is not part of the equilibrium, will change the total pressure but not the partial pressures of the gases in the equilibrium constant expression. Thus, addition of a gas not involved in the equilibrium will not perturb the equilibrium.
As we increase the pressure of a gaseous system at equilibrium, either by decreasing the volume of the system or by adding more of one of the components of the equilibrium mixture, we introduce a stress by increasing the partial pressures of one or more of the components. In accordance with Le Chatelier's principle, a shift in the equilibrium that reduces the total number of molecules per unit of volume will be favored because this relieves the stress. The reverse reaction would be favored by a decrease in pressure.
Consider what happens when we increase the pressure on a system in which \(\ce{NO}\), \(\ce{O_2}\), and \(\ce{NO_2}\) are at equilibrium:
\[\ce{2NO (g) + O2(g) \rightleftharpoons 2NO2(g)} \label{13.4.3} \]
The formation of additional amounts of \(\ce{NO2}\) decreases the total number of molecules in the system because each time two molecules of \(\ce{NO_2}\) form, a total of three molecules of \(\ce{NO}\) and \(\ce{O_2}\) are consumed. This reduces the total pressure exerted by the system and reduces, but does not completely relieve, the stress of the increased pressure. On the other hand, a decrease in the pressure on the system favors decomposition of \(\ce{NO_2}\) into \(\ce{NO}\) and \(\ce{O_2}\), which tends to restore the pressure.
Now consider this reaction:
\[\ce{N2 (g) + O2 (g) \rightleftharpoons 2NO (g)} \label{13.4.4} \]
Because there is no change in the total number of molecules in the system during reaction, a change in pressure does not favor either formation or decomposition of gaseous nitrogen monoxide.
Effect of Change in Temperature on Equilibrium
Changing concentration or pressure perturbs an equilibrium because the reaction quotient is shifted away from the equilibrium value. Changing the temperature of a system at equilibrium has a different effect: A change in temperature actually changes the value of the equilibrium constant. However, we can qualitatively predict the effect of the temperature change by treating it as a stress on the system and applying Le Chatelier's principle.
When hydrogen reacts with gaseous iodine, heat is evolved.
\[\ce{H2(g) + I2(g) \rightleftharpoons 2HI(g) } \;\;\ ΔH=\mathrm{−9.4\;kJ\;(exothermic)} \label{13.4.5} \]
Because this reaction is exothermic, we can write it with heat as a product.
\[\ce{H2(g) + I2(g) \rightleftharpoons 2HI(g)} + \text{heat} \label{13.4.6} \]
Increasing the temperature of the reaction increases the internal energy of the system. Thus, increasing the temperature has the effect of increasing the amount of one of the products of this reaction. The reaction shifts to the left to relieve the stress, and there is an increase in the concentration of \(\ce{H2}\) and \(\ce{I2}\) and a reduction in the concentration of \(\ce{HI}\). Lowering the temperature of this system reduces the amount of energy present, favors the production of heat, and favors the formation of hydrogen iodide.
When we change the temperature of a system at equilibrium, the equilibrium constant for the reaction changes. Lowering the temperature in the \(\ce{HI}\) system increases the equilibrium constant: At the new equilibrium the concentration of \(\ce{HI}\) has increased and the concentrations of \(\ce{H2}\) and \(\ce{I2}\) decreased. Raising the temperature decreases the value of the equilibrium constant, from 67.5 at 357 °C to 50.0 at 400 °C.
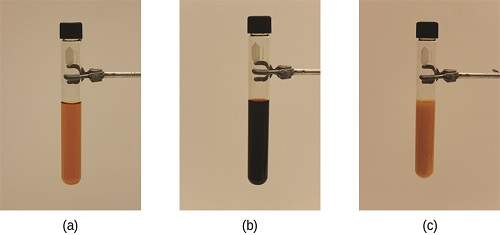
Temperature affects the equilibrium between \(\ce{NO_2}\) and \(\ce{N_2O_4}\) in this reaction
\[\ce{N2O4(g) \rightleftharpoons 2NO2(g)}\;\;\; ΔH=\mathrm{57.20\; kJ} \label{13.4.7} \]
The positive ΔH value tells us that the reaction is endothermic and could be written
\[\text{heat}+\ce{N2O4(g) \rightleftharpoons 2NO2(g)} \label{13.4.8} \]
At higher temperatures, the gas mixture has a deep brown color, indicative of a significant amount of brown \(\ce{NO_2}\) molecules. If, however, we put a stress on the system by cooling the mixture (withdrawing energy), the equilibrium shifts to the left to supply some of the energy lost by cooling. The concentration of colorless \(\ce{N_2O_4}\) increases, and the concentration of brown \(\ce{NO_2}\) decreases, causing the brown color to fade.
Catalysts Do Not Affect Equilibrium
As we learned during our study of kinetics, a catalyst can speed up the rate of a reaction. Though this increase in reaction rate may cause a system to reach equilibrium more quickly (by speeding up the forward and reverse reactions), a catalyst has no effect on the value of an equilibrium constant nor on equilibrium concentrations.
The interplay of changes in concentration or pressure, temperature, and the lack of an influence of a catalyst on a chemical equilibrium is illustrated in the industrial synthesis of ammonia from nitrogen and hydrogen according to the equation
\[\ce{N2(g) + 3H2(g) \rightleftharpoons 2NH3(g)} \label{13.4.9} \]
A large quantity of ammonia is manufactured by this reaction. Each year, ammonia is among the top 10 chemicals, by mass, manufactured in the world. About 2 billion pounds are manufactured in the United States each year. Ammonia plays a vital role in our global economy. It is used in the production of fertilizers and is, itself, an important fertilizer for the growth of corn, cotton, and other crops. Large quantities of ammonia are converted to nitric acid, which plays an important role in the production of fertilizers, explosives, plastics, dyes, and fibers, and is also used in the steel industry.
Haber was born in Breslau, Prussia (presently Wroclaw, Poland) in December 1868. He went on to study chemistry and, while at the University of Karlsruhe, he developed what would later be known as the Haber process: the catalytic formation of ammonia from hydrogen and atmospheric nitrogen under high temperatures and pressures.
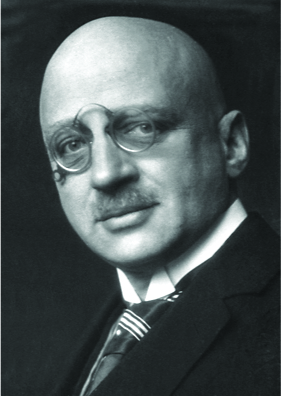
For this work, Haber was awarded the 1918 Nobel Prize in Chemistry for synthesis of ammonia from its elements. The Haber process was a boon to agriculture, as it allowed the production of fertilizers to no longer be dependent on mined feed stocks such as sodium nitrate.
\[\ce{N2(g) + 3H2(g) \rightleftharpoons 2NH3(g)} \nonumber \]
Currently, the annual production of synthetic nitrogen fertilizers exceeds 100 million tons and synthetic fertilizer production has increased the number of humans that arable land can support from 1.9 persons per hectare in 1908 to 4.3 in 2008. The availability of nitrogen is a strong limiting factor to the growth of plants. Despite accounting for 78% of air, diatomic nitrogen (\(\ce{N_2}\)) is nutritionally unavailable due the tremendous stability of the nitrogen-nitrogen triple bond. For plants to use atmospheric nitrogen, the nitrogen must be converted to a more bioavailable form (this conversion is called nitrogen fixation).
In addition to his work in ammonia production, Haber is also remembered by history as one of the fathers of chemical warfare. During World War I, he played a major role in the development of poisonous gases used for trench warfare. Regarding his role in these developments, Haber said, “During peace time a scientist belongs to the World, but during war time he belongs to his country.”1 Haber defended the use of gas warfare against accusations that it was inhumane, saying that death was death, by whatever means it was inflicted. He stands as an example of the ethical dilemmas that face scientists in times of war and the double-edged nature of the sword of science.
Like Haber, the products made from ammonia can be multifaceted. In addition to their value for agriculture, nitrogen compounds can also be used to achieve destructive ends. Ammonium nitrate has also been used in explosives, including improvised explosive devices. Ammonium nitrate was one of the components of the bomb used in the attack on the Alfred P. Murrah Federal Building in downtown Oklahoma City on April 19, 1995.
Summary
Systems at equilibrium can be disturbed by changes to temperature, concentration, and, in some cases, volume and pressure; volume and pressure changes will disturb equilibrium if the number of moles of gas is different on the reactant and product sides of the reaction. The system's response to these disturbances is described by Le Chatelier's principle: The system will respond in a way that counteracts the disturbance. Not all changes to the system result in a disturbance of the equilibrium. Adding a catalyst affects the rates of the reactions but does not alter the equilibrium, and changing pressure or volume will not significantly disturb systems with no gases or with equal numbers of moles of gas on the reactant and product side.
| Disturbance | Observed Change as Equilibrium is Restored | Direction of Shift | Effect on K |
|---|---|---|---|
| reactant added | added reactant is partially consumed | toward products | none |
| product added | added product is partially consumed | toward reactants | none |
| decrease in volume/increase in gas pressure | pressure decreases | toward side with fewer moles of gas | none |
| increase in volume/decrease in gas pressure | pressure increases | toward side with more moles of gas | none |
| temperature increase | heat is absorbed | toward products for endothermic, toward reactants for exothermic | changes |
| temperature decrease | heat is given off | toward reactants for endothermic, toward products for exothermic | changes |
Footnotes
- Herrlich, P. “The Responsibility of the Scientist: What Can History Teach Us About How Scientists Should Handle Research That Has the Potential to Create Harm?” EMBO Reports 14 (2013): 759–764.
Glossary
- equilibrium
- state of a reversible reaction in which the forward and reverse processes occur at equal rates
- equilibrium constant (K)
- value of the reaction quotient for a system at equilibrium; may be expressed using concentrations (Kc) or partial pressures (Kp)
- heterogeneous equilibria
- equilibria in which reactants and products occupy two or more different phases
- homogeneous equilibria
- equilibria in which all reactants and products occupy the same phase
- law of mass action
- when a reversible reaction has attained equilibrium at a given temperature, the reaction quotient remains constant
- Le Châtelier’s principle
- an equilibrium subjected to stress will shift in a way to counter the stress and re-establish equilibrium
- reaction quotient (Q)
- mathematical function describing the relative amounts of reactants and products in a reaction mixture; may be expressed in terms of concentrations (Qc) or pressures (Qp)
- reversible reaction
- chemical reaction that can proceed in both the forward and reverse directions under given conditions