
5.1: Gas Pressure
- Page ID
- 360599

\( \newcommand{\vecs}[1]{\overset { \scriptstyle \rightharpoonup} {\mathbf{#1}} } \)
\( \newcommand{\vecd}[1]{\overset{-\!-\!\rightharpoonup}{\vphantom{a}\smash {#1}}} \)
\( \newcommand{\dsum}{\displaystyle\sum\limits} \)
\( \newcommand{\dint}{\displaystyle\int\limits} \)
\( \newcommand{\dlim}{\displaystyle\lim\limits} \)
\( \newcommand{\id}{\mathrm{id}}\) \( \newcommand{\Span}{\mathrm{span}}\)
( \newcommand{\kernel}{\mathrm{null}\,}\) \( \newcommand{\range}{\mathrm{range}\,}\)
\( \newcommand{\RealPart}{\mathrm{Re}}\) \( \newcommand{\ImaginaryPart}{\mathrm{Im}}\)
\( \newcommand{\Argument}{\mathrm{Arg}}\) \( \newcommand{\norm}[1]{\| #1 \|}\)
\( \newcommand{\inner}[2]{\langle #1, #2 \rangle}\)
\( \newcommand{\Span}{\mathrm{span}}\)
\( \newcommand{\id}{\mathrm{id}}\)
\( \newcommand{\Span}{\mathrm{span}}\)
\( \newcommand{\kernel}{\mathrm{null}\,}\)
\( \newcommand{\range}{\mathrm{range}\,}\)
\( \newcommand{\RealPart}{\mathrm{Re}}\)
\( \newcommand{\ImaginaryPart}{\mathrm{Im}}\)
\( \newcommand{\Argument}{\mathrm{Arg}}\)
\( \newcommand{\norm}[1]{\| #1 \|}\)
\( \newcommand{\inner}[2]{\langle #1, #2 \rangle}\)
\( \newcommand{\Span}{\mathrm{span}}\) \( \newcommand{\AA}{\unicode[.8,0]{x212B}}\)
\( \newcommand{\vectorA}[1]{\vec{#1}} % arrow\)
\( \newcommand{\vectorAt}[1]{\vec{\text{#1}}} % arrow\)
\( \newcommand{\vectorB}[1]{\overset { \scriptstyle \rightharpoonup} {\mathbf{#1}} } \)
\( \newcommand{\vectorC}[1]{\textbf{#1}} \)
\( \newcommand{\vectorD}[1]{\overrightarrow{#1}} \)
\( \newcommand{\vectorDt}[1]{\overrightarrow{\text{#1}}} \)
\( \newcommand{\vectE}[1]{\overset{-\!-\!\rightharpoonup}{\vphantom{a}\smash{\mathbf {#1}}}} \)
\( \newcommand{\vecs}[1]{\overset { \scriptstyle \rightharpoonup} {\mathbf{#1}} } \)
\(\newcommand{\longvect}{\overrightarrow}\)
\( \newcommand{\vecd}[1]{\overset{-\!-\!\rightharpoonup}{\vphantom{a}\smash {#1}}} \)
\(\newcommand{\avec}{\mathbf a}\) \(\newcommand{\bvec}{\mathbf b}\) \(\newcommand{\cvec}{\mathbf c}\) \(\newcommand{\dvec}{\mathbf d}\) \(\newcommand{\dtil}{\widetilde{\mathbf d}}\) \(\newcommand{\evec}{\mathbf e}\) \(\newcommand{\fvec}{\mathbf f}\) \(\newcommand{\nvec}{\mathbf n}\) \(\newcommand{\pvec}{\mathbf p}\) \(\newcommand{\qvec}{\mathbf q}\) \(\newcommand{\svec}{\mathbf s}\) \(\newcommand{\tvec}{\mathbf t}\) \(\newcommand{\uvec}{\mathbf u}\) \(\newcommand{\vvec}{\mathbf v}\) \(\newcommand{\wvec}{\mathbf w}\) \(\newcommand{\xvec}{\mathbf x}\) \(\newcommand{\yvec}{\mathbf y}\) \(\newcommand{\zvec}{\mathbf z}\) \(\newcommand{\rvec}{\mathbf r}\) \(\newcommand{\mvec}{\mathbf m}\) \(\newcommand{\zerovec}{\mathbf 0}\) \(\newcommand{\onevec}{\mathbf 1}\) \(\newcommand{\real}{\mathbb R}\) \(\newcommand{\twovec}[2]{\left[\begin{array}{r}#1 \\ #2 \end{array}\right]}\) \(\newcommand{\ctwovec}[2]{\left[\begin{array}{c}#1 \\ #2 \end{array}\right]}\) \(\newcommand{\threevec}[3]{\left[\begin{array}{r}#1 \\ #2 \\ #3 \end{array}\right]}\) \(\newcommand{\cthreevec}[3]{\left[\begin{array}{c}#1 \\ #2 \\ #3 \end{array}\right]}\) \(\newcommand{\fourvec}[4]{\left[\begin{array}{r}#1 \\ #2 \\ #3 \\ #4 \end{array}\right]}\) \(\newcommand{\cfourvec}[4]{\left[\begin{array}{c}#1 \\ #2 \\ #3 \\ #4 \end{array}\right]}\) \(\newcommand{\fivevec}[5]{\left[\begin{array}{r}#1 \\ #2 \\ #3 \\ #4 \\ #5 \\ \end{array}\right]}\) \(\newcommand{\cfivevec}[5]{\left[\begin{array}{c}#1 \\ #2 \\ #3 \\ #4 \\ #5 \\ \end{array}\right]}\) \(\newcommand{\mattwo}[4]{\left[\begin{array}{rr}#1 \amp #2 \\ #3 \amp #4 \\ \end{array}\right]}\) \(\newcommand{\laspan}[1]{\text{Span}\{#1\}}\) \(\newcommand{\bcal}{\cal B}\) \(\newcommand{\ccal}{\cal C}\) \(\newcommand{\scal}{\cal S}\) \(\newcommand{\wcal}{\cal W}\) \(\newcommand{\ecal}{\cal E}\) \(\newcommand{\coords}[2]{\left\{#1\right\}_{#2}}\) \(\newcommand{\gray}[1]{\color{gray}{#1}}\) \(\newcommand{\lgray}[1]{\color{lightgray}{#1}}\) \(\newcommand{\rank}{\operatorname{rank}}\) \(\newcommand{\row}{\text{Row}}\) \(\newcommand{\col}{\text{Col}}\) \(\renewcommand{\row}{\text{Row}}\) \(\newcommand{\nul}{\text{Nul}}\) \(\newcommand{\var}{\text{Var}}\) \(\newcommand{\corr}{\text{corr}}\) \(\newcommand{\len}[1]{\left|#1\right|}\) \(\newcommand{\bbar}{\overline{\bvec}}\) \(\newcommand{\bhat}{\widehat{\bvec}}\) \(\newcommand{\bperp}{\bvec^\perp}\) \(\newcommand{\xhat}{\widehat{\xvec}}\) \(\newcommand{\vhat}{\widehat{\vvec}}\) \(\newcommand{\uhat}{\widehat{\uvec}}\) \(\newcommand{\what}{\widehat{\wvec}}\) \(\newcommand{\Sighat}{\widehat{\Sigma}}\) \(\newcommand{\lt}{<}\) \(\newcommand{\gt}{>}\) \(\newcommand{\amp}{&}\) \(\definecolor{fillinmathshade}{gray}{0.9}\)- Define the property of pressure
- Define and convert among the units of pressure measurements
- Describe the operation of common tools for measuring gas pressure
- Calculate pressure from manometer data
The earth’s atmosphere exerts a pressure, as does any other gas. Although we do not normally notice atmospheric pressure, we are sensitive to pressure changes—for example, when your ears “pop” during take-off and landing while flying, or when you dive underwater. Gas pressure is caused by the force exerted by gas molecules colliding with the surfaces of objects (Figure \(\PageIndex{1}\)). Although the force of each collision is very small, any surface of appreciable area experiences a large number of collisions in a short time, which can result in a high pressure. In fact, normal air pressure is strong enough to crush a metal container when not balanced by equal pressure from inside the container.
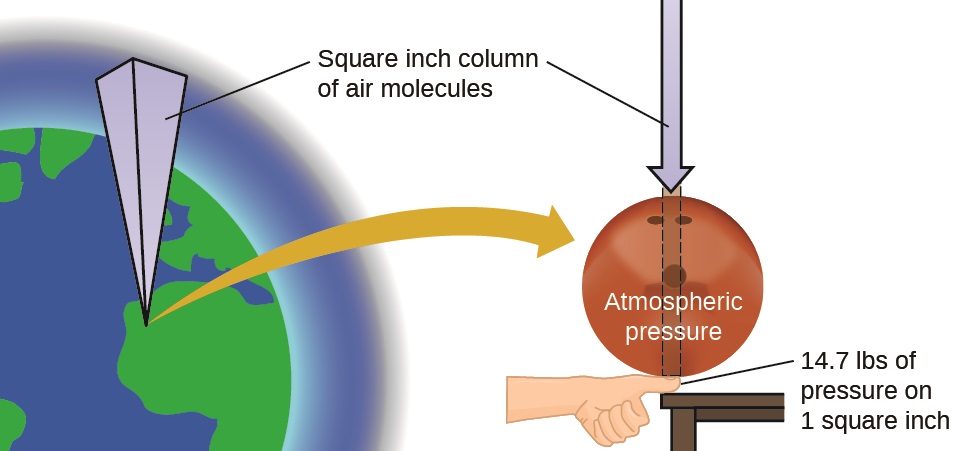
Atmospheric pressure is caused by the weight of the column of air molecules in the atmosphere above an object, such as the tanker car. At sea level, this pressure is roughly the same as that exerted by a full-grown African elephant standing on a doormat, or a typical bowling ball resting on your thumbnail. These may seem like huge amounts, and they are, but life on earth has evolved under such atmospheric pressure. If you actually perch a bowling ball on your thumbnail, the pressure experienced is twice the usual pressure, and the sensation is unpleasant.
A dramatic illustration of atmospheric pressure is provided in this brief video, which shows a railway tanker car imploding when its internal pressure is decreased.
Pressure is defined as the force exerted on a given area:
\[P=\dfrac{F}{A} \label{9.2.1}\]
Since pressure is directly proportional to force and inversely proportional to area (Equation \ref{9.2.1}), pressure can be increased either by either increasing the amount of force or by decreasing the area over which it is applied. Correspondingly, pressure can be decreased by either decreasing the force or increasing the area.
Let’s apply the definition of pressure (Equation \ref{9.2.1}) to determine which would be more likely to fall through thin ice in Figure \(\PageIndex{2}\).—the elephant or the figure skater?
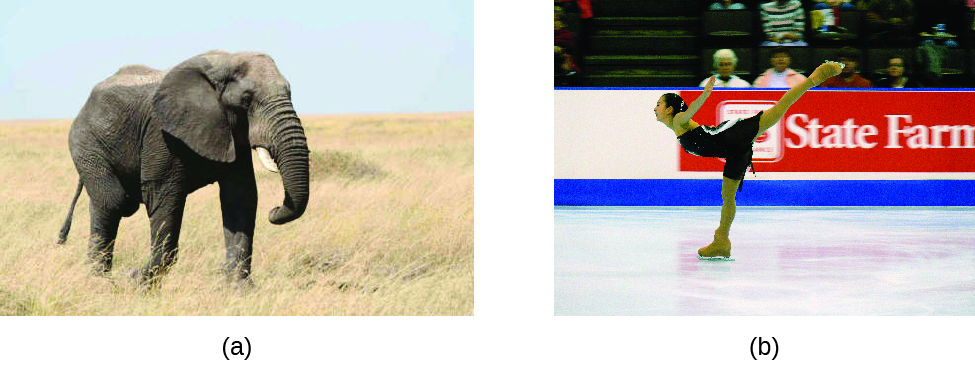
A large African elephant can weigh 7 tons, supported on four feet, each with a diameter of about 1.5 ft (footprint area of 250 in2), so the pressure exerted by each foot is about 14 lb/in2:
\[\mathrm{pressure\: per\: elephant\: foot=14,000\dfrac{lb}{elephant}×\dfrac{1\: elephant}{4\: feet}×\dfrac{1\: foot}{250\:in^2}=14\:lb/in^2} \label{9.2.2}\]
The figure skater weighs about 120 lbs, supported on two skate blades, each with an area of about 2 in2, so the pressure exerted by each blade is about 30 lb/in2:
\[\mathrm{pressure\: per\: skate\: blade=120\dfrac{lb}{skater}×\dfrac{1\: skater}{2\: blades}×\dfrac{1\: blade}{2\:in^2}=30\:lb/in^2} \label{9.2.3}\]
Even though the elephant is more than one hundred times heavier than the skater, it exerts less than one-half of the pressure and would therefore be less likely to fall through thin ice. On the other hand, if the skater removes her skates and stands with bare feet (or regular footwear) on the ice, the larger area over which her weight is applied greatly reduces the pressure exerted:
\[\mathrm{pressure\: per\: human\: foot=120\dfrac{lb}{skater}×\dfrac{1\: skater}{2\: feet}×\dfrac{1\: foot}{30\:in^2}=2\:lb/in^2} \label{9.2.4}\]
The SI unit of pressure is the pascal (Pa), with 1 Pa = 1 N/m2, where N is the newton, a unit of force defined as 1 kg m/s2. One pascal is a small pressure; in many cases, it is more convenient to use units of kilopascal (1 kPa = 1000 Pa) or bar (1 bar = 100,000 Pa). In the United States, pressure is often measured in pounds of force on an area of one square inch—pounds per square inch (psi)—for example, in car tires. Pressure can also be measured using the unit atmosphere (atm), which originally represented the average sea level air pressure at the approximate latitude of Paris (45°). Table \(\PageIndex{1}\) provides some information on these and a few other common units for pressure measurements
| Unit Name and Abbreviation | Definition or Relation to Other Unit | Comment |
|---|---|---|
| pascal (Pa) | 1 Pa = 1 N/m2 | recommended IUPAC unit |
| kilopascal (kPa) | 1 kPa = 1000 Pa | |
| pounds per square inch (psi) | air pressure at sea level is ~14.7 psi | |
| atmosphere (atm) | 1 atm = 101,325 Pa | air pressure at sea level is ~1 atm |
| bar (bar, or b) | 1 bar = 100,000 Pa (exactly) | commonly used in meteorology |
| millibar (mbar, or mb) | 1000 mbar = 1 bar | |
| inches of mercury (in. Hg) | 1 in. Hg = 3386 Pa | used by aviation industry, also some weather reports |
| torr | \(\mathrm{1\: torr=\dfrac{1}{760}\:atm}\) | named after Evangelista Torricelli, inventor of the barometer |
| millimeters of mercury (mm Hg) | 1 mm Hg ~1 torr |
The United States National Weather Service reports pressure in both inches of Hg and millibars. Convert a pressure of 29.2 in. Hg into:
- torr
- atm
- kPa
- mbar
Solution
This is a unit conversion problem. The relationships between the various pressure units are given in Table 9.2.1.
- \(\mathrm{29.2\cancel{in\: Hg}×\dfrac{25.4\cancel{mm}}{1\cancel{in}} ×\dfrac{1\: torr}{1\cancel{mm\: Hg}} =742\: torr}\)
- \(\mathrm{742\cancel{torr}×\dfrac{1\: atm}{760\cancel{torr}}=0.976\: atm}\)
- \(\mathrm{742\cancel{torr}×\dfrac{101.325\: kPa}{760\cancel{torr}}=98.9\: kPa}\)
- \(\mathrm{98.9\cancel{kPa}×\dfrac{1000\cancel{Pa}}{1\cancel{kPa}} \times \dfrac{1\cancel{bar}}{100,000\cancel{Pa}} \times\dfrac{1000\: mbar}{1\cancel{bar}}=989\: mbar}\)
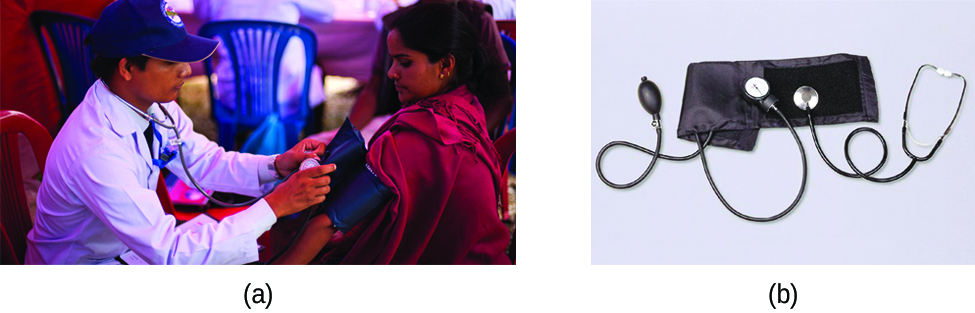
Blood pressure is measured using a device called a sphygmomanometer (Greek sphygmos = “pulse”). It consists of an inflatable cuff to restrict blood flow, a manometer to measure the pressure, and a method of determining when blood flow begins and when it becomes impeded (Figure \(\PageIndex{5}\)). Since its invention in 1881, it has been an essential medical device. There are many types of sphygmomanometers: manual ones that require a stethoscope and are used by medical professionals; mercury ones, used when the most accuracy is required; less accurate mechanical ones; and digital ones that can be used with little training but that have limitations. When using a sphygmomanometer, the cuff is placed around the upper arm and inflated until blood flow is completely blocked, then slowly released. As the heart beats, blood forced through the arteries causes a rise in pressure. This rise in pressure at which blood flow begins is the systolic pressure—the peak pressure in the cardiac cycle. When the cuff’s pressure equals the arterial systolic pressure, blood flows past the cuff, creating audible sounds that can be heard using a stethoscope. This is followed by a decrease in pressure as the heart’s ventricles prepare for another beat. As cuff pressure continues to decrease, eventually sound is no longer heard; this is the diastolic pressure—the lowest pressure (resting phase) in the cardiac cycle. Blood pressure units from a sphygmomanometer are in terms of millimeters of mercury (mm Hg).
Meteorology, Climatology, and Atmospheric Science
Throughout the ages, people have observed clouds, winds, and precipitation, trying to discern patterns and make predictions: when it is best to plant and harvest; whether it is safe to set out on a sea voyage; and much more. We now face complex weather and atmosphere-related challenges that will have a major impact on our civilization and the ecosystem. Several different scientific disciplines use chemical principles to help us better understand weather, the atmosphere, and climate. These are meteorology, climatology, and atmospheric science. Meteorology is the study of the atmosphere, atmospheric phenomena, and atmospheric effects on earth’s weather. Meteorologists seek to understand and predict the weather in the short term, which can save lives and benefit the economy. Weather forecasts (Figure \(\PageIndex{5}\)) are the result of thousands of measurements of air pressure, temperature, and the like, which are compiled, modeled, and analyzed in weather centers worldwide.
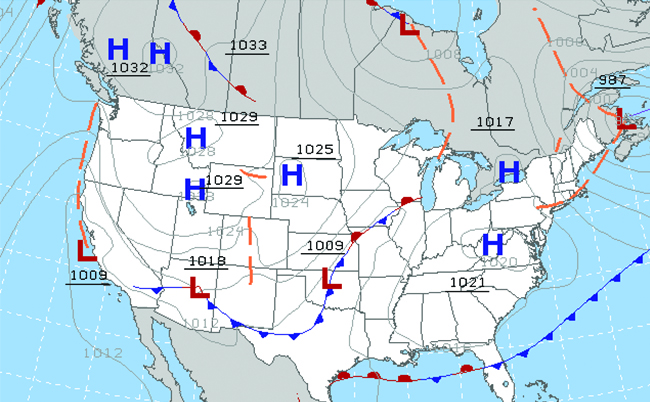
In terms of weather, low-pressure systems occur when the earth’s surface atmospheric pressure is lower than the surrounding environment: Moist air rises and condenses, producing clouds. Movement of moisture and air within various weather fronts instigates most weather events.
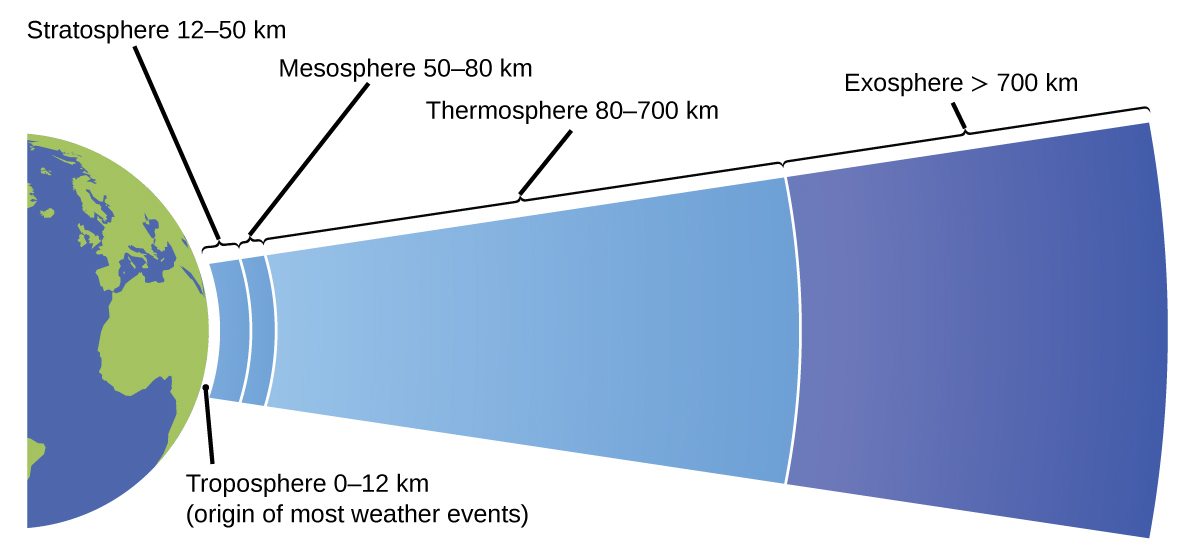
The atmosphere is the gaseous layer that surrounds a planet. Earth’s atmosphere, which is roughly 100–125 km thick, consists of roughly 78.1% nitrogen and 21.0% oxygen, and can be subdivided further into the regions shown in Figure \(\PageIndex{7}\): the exosphere (furthest from earth, > 700 km above sea level), the thermosphere (80–700 km), the mesosphere (50–80 km), the stratosphere (second lowest level of our atmosphere, 12–50 km above sea level), and the troposphere (up to 12 km above sea level, roughly 80% of the earth’s atmosphere by mass and the layer where most weather events originate). As you go higher in the troposphere, air density and temperature both decrease.
Climatology is the study of the climate, averaged weather conditions over long time periods, using atmospheric data. However, climatologists study patterns and effects that occur over decades, centuries, and millennia, rather than shorter time frames of hours, days, and weeks like meteorologists. Atmospheric science is an even broader field, combining meteorology, climatology, and other scientific disciplines that study the atmosphere.
Contributors and Attributions
Summary
Gases exert pressure, which is force per unit area. The pressure of a gas may be expressed in the SI unit of pascal or kilopascal, as well as in many other units including torr, atmosphere, and bar. Atmospheric pressure is measured using a barometer; other gas pressures can be measured using one of several types of manometers.
Key Equations
- \(P=\dfrac{F}{A}\)
- p = hρg
Glossary
- atmosphere (atm)
- unit of pressure; 1 atm = 101,325 Pa
- bar
- (bar or b) unit of pressure; 1 bar = 100,000 Pa
- barometer
- device used to measure atmospheric pressure
- hydrostatic pressure
- pressure exerted by a fluid due to gravity
- manometer
- device used to measure the pressure of a gas trapped in a container
- pascal (Pa)
- SI unit of pressure; 1 Pa = 1 N/m2
- pounds per square inch (psi)
- unit of pressure common in the US
- pressure
- force exerted per unit area
- torr
- unit of pressure; \(\mathrm{1\: torr=\dfrac{1}{760}\,atm}\)
Contributors and Attributions
Paul Flowers (University of North Carolina - Pembroke), Klaus Theopold (University of Delaware) and Richard Langley (Stephen F. Austin State University) with contributing authors. Textbook content produced by OpenStax College is licensed under a Creative Commons Attribution License 4.0 license. Download for free at http://cnx.org/contents/85abf193-2bd...a7ac8df6@9.110).