
5.17: EPR - Hyperfine Structure
- Page ID
- 370557
\( \newcommand{\vecs}[1]{\overset { \scriptstyle \rightharpoonup} {\mathbf{#1}} } \)
\( \newcommand{\vecd}[1]{\overset{-\!-\!\rightharpoonup}{\vphantom{a}\smash {#1}}} \)
\( \newcommand{\id}{\mathrm{id}}\) \( \newcommand{\Span}{\mathrm{span}}\)
( \newcommand{\kernel}{\mathrm{null}\,}\) \( \newcommand{\range}{\mathrm{range}\,}\)
\( \newcommand{\RealPart}{\mathrm{Re}}\) \( \newcommand{\ImaginaryPart}{\mathrm{Im}}\)
\( \newcommand{\Argument}{\mathrm{Arg}}\) \( \newcommand{\norm}[1]{\| #1 \|}\)
\( \newcommand{\inner}[2]{\langle #1, #2 \rangle}\)
\( \newcommand{\Span}{\mathrm{span}}\)
\( \newcommand{\id}{\mathrm{id}}\)
\( \newcommand{\Span}{\mathrm{span}}\)
\( \newcommand{\kernel}{\mathrm{null}\,}\)
\( \newcommand{\range}{\mathrm{range}\,}\)
\( \newcommand{\RealPart}{\mathrm{Re}}\)
\( \newcommand{\ImaginaryPart}{\mathrm{Im}}\)
\( \newcommand{\Argument}{\mathrm{Arg}}\)
\( \newcommand{\norm}[1]{\| #1 \|}\)
\( \newcommand{\inner}[2]{\langle #1, #2 \rangle}\)
\( \newcommand{\Span}{\mathrm{span}}\) \( \newcommand{\AA}{\unicode[.8,0]{x212B}}\)
\( \newcommand{\vectorA}[1]{\vec{#1}} % arrow\)
\( \newcommand{\vectorAt}[1]{\vec{\text{#1}}} % arrow\)
\( \newcommand{\vectorB}[1]{\overset { \scriptstyle \rightharpoonup} {\mathbf{#1}} } \)
\( \newcommand{\vectorC}[1]{\textbf{#1}} \)
\( \newcommand{\vectorD}[1]{\overrightarrow{#1}} \)
\( \newcommand{\vectorDt}[1]{\overrightarrow{\text{#1}}} \)
\( \newcommand{\vectE}[1]{\overset{-\!-\!\rightharpoonup}{\vphantom{a}\smash{\mathbf {#1}}}} \)
\( \newcommand{\vecs}[1]{\overset { \scriptstyle \rightharpoonup} {\mathbf{#1}} } \)
\( \newcommand{\vecd}[1]{\overset{-\!-\!\rightharpoonup}{\vphantom{a}\smash {#1}}} \)
\(\newcommand{\avec}{\mathbf a}\) \(\newcommand{\bvec}{\mathbf b}\) \(\newcommand{\cvec}{\mathbf c}\) \(\newcommand{\dvec}{\mathbf d}\) \(\newcommand{\dtil}{\widetilde{\mathbf d}}\) \(\newcommand{\evec}{\mathbf e}\) \(\newcommand{\fvec}{\mathbf f}\) \(\newcommand{\nvec}{\mathbf n}\) \(\newcommand{\pvec}{\mathbf p}\) \(\newcommand{\qvec}{\mathbf q}\) \(\newcommand{\svec}{\mathbf s}\) \(\newcommand{\tvec}{\mathbf t}\) \(\newcommand{\uvec}{\mathbf u}\) \(\newcommand{\vvec}{\mathbf v}\) \(\newcommand{\wvec}{\mathbf w}\) \(\newcommand{\xvec}{\mathbf x}\) \(\newcommand{\yvec}{\mathbf y}\) \(\newcommand{\zvec}{\mathbf z}\) \(\newcommand{\rvec}{\mathbf r}\) \(\newcommand{\mvec}{\mathbf m}\) \(\newcommand{\zerovec}{\mathbf 0}\) \(\newcommand{\onevec}{\mathbf 1}\) \(\newcommand{\real}{\mathbb R}\) \(\newcommand{\twovec}[2]{\left[\begin{array}{r}#1 \\ #2 \end{array}\right]}\) \(\newcommand{\ctwovec}[2]{\left[\begin{array}{c}#1 \\ #2 \end{array}\right]}\) \(\newcommand{\threevec}[3]{\left[\begin{array}{r}#1 \\ #2 \\ #3 \end{array}\right]}\) \(\newcommand{\cthreevec}[3]{\left[\begin{array}{c}#1 \\ #2 \\ #3 \end{array}\right]}\) \(\newcommand{\fourvec}[4]{\left[\begin{array}{r}#1 \\ #2 \\ #3 \\ #4 \end{array}\right]}\) \(\newcommand{\cfourvec}[4]{\left[\begin{array}{c}#1 \\ #2 \\ #3 \\ #4 \end{array}\right]}\) \(\newcommand{\fivevec}[5]{\left[\begin{array}{r}#1 \\ #2 \\ #3 \\ #4 \\ #5 \\ \end{array}\right]}\) \(\newcommand{\cfivevec}[5]{\left[\begin{array}{c}#1 \\ #2 \\ #3 \\ #4 \\ #5 \\ \end{array}\right]}\) \(\newcommand{\mattwo}[4]{\left[\begin{array}{rr}#1 \amp #2 \\ #3 \amp #4 \\ \end{array}\right]}\) \(\newcommand{\laspan}[1]{\text{Span}\{#1\}}\) \(\newcommand{\bcal}{\cal B}\) \(\newcommand{\ccal}{\cal C}\) \(\newcommand{\scal}{\cal S}\) \(\newcommand{\wcal}{\cal W}\) \(\newcommand{\ecal}{\cal E}\) \(\newcommand{\coords}[2]{\left\{#1\right\}_{#2}}\) \(\newcommand{\gray}[1]{\color{gray}{#1}}\) \(\newcommand{\lgray}[1]{\color{lightgray}{#1}}\) \(\newcommand{\rank}{\operatorname{rank}}\) \(\newcommand{\row}{\text{Row}}\) \(\newcommand{\col}{\text{Col}}\) \(\renewcommand{\row}{\text{Row}}\) \(\newcommand{\nul}{\text{Nul}}\) \(\newcommand{\var}{\text{Var}}\) \(\newcommand{\corr}{\text{corr}}\) \(\newcommand{\len}[1]{\left|#1\right|}\) \(\newcommand{\bbar}{\overline{\bvec}}\) \(\newcommand{\bhat}{\widehat{\bvec}}\) \(\newcommand{\bperp}{\bvec^\perp}\) \(\newcommand{\xhat}{\widehat{\xvec}}\) \(\newcommand{\vhat}{\widehat{\vvec}}\) \(\newcommand{\uhat}{\widehat{\uvec}}\) \(\newcommand{\what}{\widehat{\wvec}}\) \(\newcommand{\Sighat}{\widehat{\Sigma}}\) \(\newcommand{\lt}{<}\) \(\newcommand{\gt}{>}\) \(\newcommand{\amp}{&}\) \(\definecolor{fillinmathshade}{gray}{0.9}\)Besides the applied magnetic field \(B_0\), the compound contains the unpaired electrons are sensitive to their local “micro” environment. These so-called hyperfine interactions involves the coupling of the electron spins to the nuclei of the atoms in a molecule or complex that have their own fine magnetic moments. These magnetic moments can produce a local magnetic field intense enough to affect the electron energy.
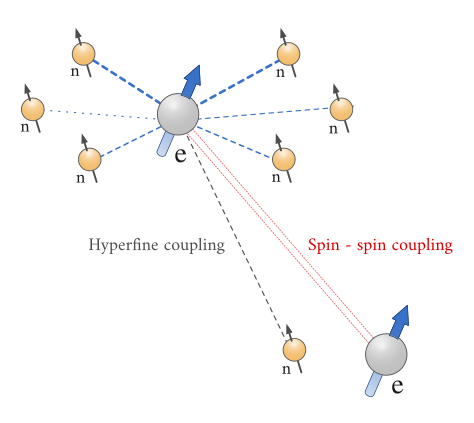
Hyperfine coupling in EPR is analogous to spin-spin coupling in NMR. There are two kinds of hyperfine coupling:
- coupling of the electron magnetic moment to the magnetic moment of its own nucleus; and
- coupling of the electron to a nucleus of a different atom, called super hyperfine splitting.
Both types of hyperfine coupling cause a splitting of the spectral lines with intensities following Pascal’s triangle for \(I = 1/2\) nuclei, similar to J-coupling in NMR.
Hyperfine interactions can be used to provide a wealth of information about the sample such as the number and identity of atoms in a molecule or compound, as well as their distance from the unpaired electron. Then the energy level of the electron can be expressed as:
\[E = gm_BB_0M_S + aM_sm_I \label{6} \]
with \(a\) is the hyperfine coupling constant, \(m_I\) is the nuclear spin quantum number.

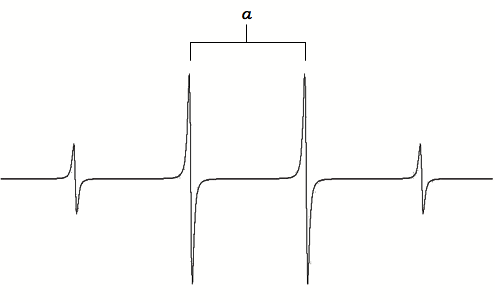
The splitting pattern for a coupling of an electron to a spin-1 nucleus Figure \(\PageIndex{3}\)) differs from the coupling to the spin-1/2 nucleus Figure \(\PageIndex{2}\).

Splitting Patterns
The rules for determining which nuclei will interact are the same as for NMR. For isotopes which have even atomic and even mass numbers, the ground state nuclear spin quantum number, \(I\), is zero, and these isotopes have no EPR (or NMR) spectra. For isotopes with odd atomic numbers and even mass numbers, the values of \(I\) are integers. For example the spin of 2H is 1. For isotopes with odd mass numbers, the values of I are fractions. For example the spin of 1H is 1/2 and the spin of 23Na is 7/2. Here are more examples from biological systems:
The number of lines from the hyperfine interaction can be determined by the formula:
\[2NI + 1 \nonumber \]
where \(N\) is the number of equivalent nuclei and \(I\) is the spin.
For example, an unpaired electron on a V4+ experiences I=7/2 from the vanadium nucleus. We can see 8 lines from the EPR spectrum. When coupling to a single nucleus, each line has the same intensity. When coupling to more than one nucleus, the relative intensity of each line is determined by the number of interacting nuclei. For the most common \(I=1/2\) nuclei, the intensity of each line follows Pascal's triangle (Figure \(\PageIndex{4}\):

For example, for •CH3, the radical’s signal is split to 2NI+1= 2*3*1/2+1=4 lines, the ratio of each line’s intensity is 1:3:3:1. The spectrum looks like this:
A simulated spectrum of the methyl radical is shown in Figure \(\PageIndex{3}\). The line is split equally by the three hydrogens giving rise to four lines of intensity 1:3:3:1 with hyperfine coupling constant \(a\).
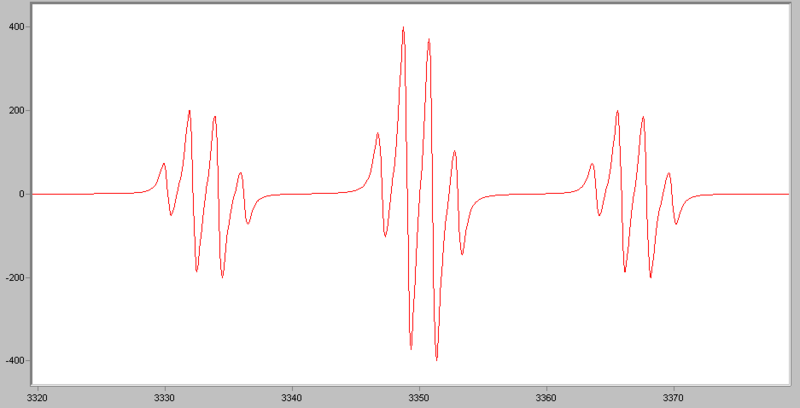
If an electron couples to several sets of nuclei, first we apply the coupling rule to the nearest nuclei, then we split each of those lines by the coupling them to the next nearest nuclei, and so on. For the methoxymethyl radical, \(\ce{H2C(OCH3)}\), there are
\[(2*2*1/2+1)*(2*3*1/2+1)=12 \nonumber \]
lines in the spectrum, the spectrum looks like this:
The hyperfine splitting constant (\(a\)), can be determined by measuring the distance between each of the hyperfine lines. This value can be converted into Hz using the \(g\) value in the equation:
\[ hA\ =\ g \beta a \label{3} \]
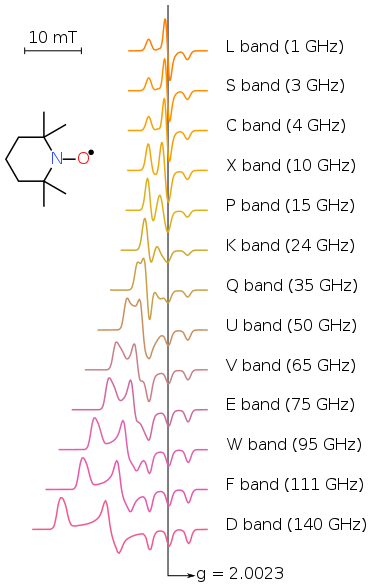
EPR experiments often are conducted at X- and, less commonly, Q bands, mainly due to the ready availability of the necessary microwave components (which originally were developed for radar applications). A second reason for widespread X and Q band measurements is that electromagnets can reliably generate fields up to about 1 tesla. EPR spectra of a nitroxide radical as a function of frequency. Note the improvement in resolution from left to right
The EPR spectra have very different line shapes and characteristics depending on many factors, such as the interactions in the spin Hamiltonian, physical phase of samples, dynamic properties of molecules. To gain the information on structure and dynamics from experimental data, spectral simulations are heavily relied. People use simulation to study the dependencies of spectral features on the magnetic parameters, to predict the information we may get from experiments, or to extract accurate parameter from experimental spectra.