
5.16: EPR Signals
- Page ID
- 369600
\( \newcommand{\vecs}[1]{\overset { \scriptstyle \rightharpoonup} {\mathbf{#1}} } \)
\( \newcommand{\vecd}[1]{\overset{-\!-\!\rightharpoonup}{\vphantom{a}\smash {#1}}} \)
\( \newcommand{\id}{\mathrm{id}}\) \( \newcommand{\Span}{\mathrm{span}}\)
( \newcommand{\kernel}{\mathrm{null}\,}\) \( \newcommand{\range}{\mathrm{range}\,}\)
\( \newcommand{\RealPart}{\mathrm{Re}}\) \( \newcommand{\ImaginaryPart}{\mathrm{Im}}\)
\( \newcommand{\Argument}{\mathrm{Arg}}\) \( \newcommand{\norm}[1]{\| #1 \|}\)
\( \newcommand{\inner}[2]{\langle #1, #2 \rangle}\)
\( \newcommand{\Span}{\mathrm{span}}\)
\( \newcommand{\id}{\mathrm{id}}\)
\( \newcommand{\Span}{\mathrm{span}}\)
\( \newcommand{\kernel}{\mathrm{null}\,}\)
\( \newcommand{\range}{\mathrm{range}\,}\)
\( \newcommand{\RealPart}{\mathrm{Re}}\)
\( \newcommand{\ImaginaryPart}{\mathrm{Im}}\)
\( \newcommand{\Argument}{\mathrm{Arg}}\)
\( \newcommand{\norm}[1]{\| #1 \|}\)
\( \newcommand{\inner}[2]{\langle #1, #2 \rangle}\)
\( \newcommand{\Span}{\mathrm{span}}\) \( \newcommand{\AA}{\unicode[.8,0]{x212B}}\)
\( \newcommand{\vectorA}[1]{\vec{#1}} % arrow\)
\( \newcommand{\vectorAt}[1]{\vec{\text{#1}}} % arrow\)
\( \newcommand{\vectorB}[1]{\overset { \scriptstyle \rightharpoonup} {\mathbf{#1}} } \)
\( \newcommand{\vectorC}[1]{\textbf{#1}} \)
\( \newcommand{\vectorD}[1]{\overrightarrow{#1}} \)
\( \newcommand{\vectorDt}[1]{\overrightarrow{\text{#1}}} \)
\( \newcommand{\vectE}[1]{\overset{-\!-\!\rightharpoonup}{\vphantom{a}\smash{\mathbf {#1}}}} \)
\( \newcommand{\vecs}[1]{\overset { \scriptstyle \rightharpoonup} {\mathbf{#1}} } \)
\( \newcommand{\vecd}[1]{\overset{-\!-\!\rightharpoonup}{\vphantom{a}\smash {#1}}} \)
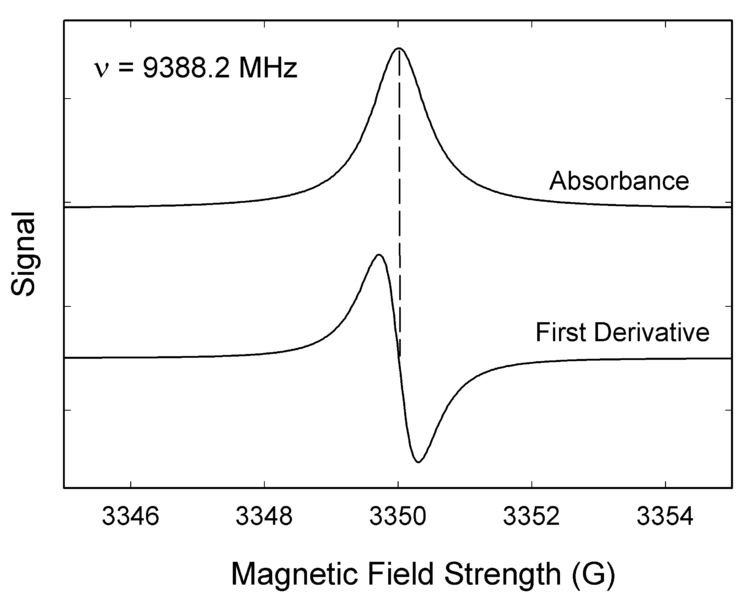
\(\newcommand{\avec}{\mathbf a}\) \(\newcommand{\bvec}{\mathbf b}\) \(\newcommand{\cvec}{\mathbf c}\) \(\newcommand{\dvec}{\mathbf d}\) \(\newcommand{\dtil}{\widetilde{\mathbf d}}\) \(\newcommand{\evec}{\mathbf e}\) \(\newcommand{\fvec}{\mathbf f}\) \(\newcommand{\nvec}{\mathbf n}\) \(\newcommand{\pvec}{\mathbf p}\) \(\newcommand{\qvec}{\mathbf q}\) \(\newcommand{\svec}{\mathbf s}\) \(\newcommand{\tvec}{\mathbf t}\) \(\newcommand{\uvec}{\mathbf u}\) \(\newcommand{\vvec}{\mathbf v}\) \(\newcommand{\wvec}{\mathbf w}\) \(\newcommand{\xvec}{\mathbf x}\) \(\newcommand{\yvec}{\mathbf y}\) \(\newcommand{\zvec}{\mathbf z}\) \(\newcommand{\rvec}{\mathbf r}\) \(\newcommand{\mvec}{\mathbf m}\) \(\newcommand{\zerovec}{\mathbf 0}\) \(\newcommand{\onevec}{\mathbf 1}\) \(\newcommand{\real}{\mathbb R}\) \(\newcommand{\twovec}[2]{\left[\begin{array}{r}#1 \\ #2 \end{array}\right]}\) \(\newcommand{\ctwovec}[2]{\left[\begin{array}{c}#1 \\ #2 \end{array}\right]}\) \(\newcommand{\threevec}[3]{\left[\begin{array}{r}#1 \\ #2 \\ #3 \end{array}\right]}\) \(\newcommand{\cthreevec}[3]{\left[\begin{array}{c}#1 \\ #2 \\ #3 \end{array}\right]}\) \(\newcommand{\fourvec}[4]{\left[\begin{array}{r}#1 \\ #2 \\ #3 \\ #4 \end{array}\right]}\) \(\newcommand{\cfourvec}[4]{\left[\begin{array}{c}#1 \\ #2 \\ #3 \\ #4 \end{array}\right]}\) \(\newcommand{\fivevec}[5]{\left[\begin{array}{r}#1 \\ #2 \\ #3 \\ #4 \\ #5 \\ \end{array}\right]}\) \(\newcommand{\cfivevec}[5]{\left[\begin{array}{c}#1 \\ #2 \\ #3 \\ #4 \\ #5 \\ \end{array}\right]}\) \(\newcommand{\mattwo}[4]{\left[\begin{array}{rr}#1 \amp #2 \\ #3 \amp #4 \\ \end{array}\right]}\) \(\newcommand{\laspan}[1]{\text{Span}\{#1\}}\) \(\newcommand{\bcal}{\cal B}\) \(\newcommand{\ccal}{\cal C}\) \(\newcommand{\scal}{\cal S}\) \(\newcommand{\wcal}{\cal W}\) \(\newcommand{\ecal}{\cal E}\) \(\newcommand{\coords}[2]{\left\{#1\right\}_{#2}}\) \(\newcommand{\gray}[1]{\color{gray}{#1}}\) \(\newcommand{\lgray}[1]{\color{lightgray}{#1}}\) \(\newcommand{\rank}{\operatorname{rank}}\) \(\newcommand{\row}{\text{Row}}\) \(\newcommand{\col}{\text{Col}}\) \(\renewcommand{\row}{\text{Row}}\) \(\newcommand{\nul}{\text{Nul}}\) \(\newcommand{\var}{\text{Var}}\) \(\newcommand{\corr}{\text{corr}}\) \(\newcommand{\len}[1]{\left|#1\right|}\) \(\newcommand{\bbar}{\overline{\bvec}}\) \(\newcommand{\bhat}{\widehat{\bvec}}\) \(\newcommand{\bperp}{\bvec^\perp}\) \(\newcommand{\xhat}{\widehat{\xvec}}\) \(\newcommand{\vhat}{\widehat{\vvec}}\) \(\newcommand{\uhat}{\widehat{\uvec}}\) \(\newcommand{\what}{\widehat{\wvec}}\) \(\newcommand{\Sighat}{\widehat{\Sigma}}\) \(\newcommand{\lt}{<}\) \(\newcommand{\gt}{>}\) \(\newcommand{\amp}{&}\) \(\definecolor{fillinmathshade}{gray}{0.9}\)Like most spectroscopic techniques, EPR spectrometers measure the absorption of electromagnetic radiation. A simple absorption spectra will appear similar to the one on the top of Figure 1. However, a phase-sensitive detector is used in EPR spectrometers which converts the normal absorption signal to its first derivative. Then the absorption signal is presented as its first derivative in the spectrum, which is similar to the one on the bottom of Figure \(\PageIndex{1}\). Thus, the magnetic field is on the x-axis of EPR spectrum; dχ″/dB, the derivative of the imaginary part of the molecular magnetic susceptibility with respect to the external static magnetic field in arbitrary units is on the y-axis. In the EPR spectrum, where the spectrum passes through zero corresponds to the absorption peak of absorption spectrum. People can use this to determine the center of the signal. On the x-axis, sometimes people use the unit “gauss” (G), instead of tesla (T). One tesla is equal to 10000 gauss.
Proportionality factor (g-factor)
As a result of the Zeeman Effect, the state energy difference of an electron with s=1/2 in magnetic field is
\[ \Delta E = gβB \label{1} \]
where \(β\) is the constant, Bohr magneton. Since the energy absorbed by the electron should be exactly the same with the state energy difference \(ΔE\) with \(ΔE=hv\) (\(h\) is Planck’s constant), Equation \(\ref{1}\) can be expressed as
\[ h \nu=gβB \label{2} \]
Spectroscopists can control the microwave frequency \(\nu\) and the magnetic field \(B\). The other factor, \(g\), is a constant of proportionality, whose value is the property of the electron in a certain environment. After plugging in the values of \(h\) and \(β\) in Equation \(\ref{2}\), \(g\) value can be given through Equation \(\ref{3}\):
\[ g = 71.4484v \text{(in GHz)/B (in mT)} \label{3} \]
A free electron in vacuum has a \(g\) value of \(g_e= 2.00232\). For instance, at the magnetic field of 331.85 mT, a free electron absorbs the microwave with an X-band frequency of 9.300 GHz. However, when the electron is in a certain environment, for example, a transition metal-ion complex, the second magnetic field produced by the nuclei, \(Δ\)B, will also influence the electron. At this kind of circumstance, Equation \(\ref{2}\) becomes
\[ h\nu = gβ(B_e+ \Delta B) \label{4} \]
since we only know the spectrometer value of \(B\), the Equation \(\ref{4}\) is written as:
\[ h\nu = (g_e + \Delta g)βB \label{5} \]
From the relationship shown above, we know that there are infinite pairs of \(\nu\) and \(B\) that fit this relationship. The magnetic field for resonance is not a unique “fingerprint” for the identification of a compound because spectra can be acquired at different microwave frequencies.
Then what is the fingerprint of a molecule? It is \(Δg\) and this contains the chemical information that lies in the interaction between the electron and the electronic structure of the molecule, one can simply take the value of
\[g = g_e+ Δg \nonumber \]
as a fingerprint of the molecule.
For organic radicals, the \(g\) value is very close to \(g_e\) with values ranging from 1.99-2.01. For example, the g value for •CH3 is 2.0026. For transition metal complexes, the g value varies a lot because of the spin-orbit coupling and zero-field splitting. Usually it ranges from 1.4-3.0, depending on the geometry of the complex. For instance, the \(g\) value of Cu(acac)2 is 2.13. To determine the g value, we use the center of the signal. By using Equation \(\ref{3}\), we can calculate the g factor of the absorption in the spectrum. The value of g factor is not only related to the electronic environment, but also related to anisotropy. About this part, please refer to EPR:Theory, Parallel Mode EPR: Theory and ENDOR:Theory. An example from UC Davis is shown in Figure \(\PageIndex{2}\) (Britt group, Published in J.A.C.S. ):
