ENDOR - Theory
- Page ID
- 1790
\( \newcommand{\vecs}[1]{\overset { \scriptstyle \rightharpoonup} {\mathbf{#1}} } \)
\( \newcommand{\vecd}[1]{\overset{-\!-\!\rightharpoonup}{\vphantom{a}\smash {#1}}} \)
\( \newcommand{\id}{\mathrm{id}}\) \( \newcommand{\Span}{\mathrm{span}}\)
( \newcommand{\kernel}{\mathrm{null}\,}\) \( \newcommand{\range}{\mathrm{range}\,}\)
\( \newcommand{\RealPart}{\mathrm{Re}}\) \( \newcommand{\ImaginaryPart}{\mathrm{Im}}\)
\( \newcommand{\Argument}{\mathrm{Arg}}\) \( \newcommand{\norm}[1]{\| #1 \|}\)
\( \newcommand{\inner}[2]{\langle #1, #2 \rangle}\)
\( \newcommand{\Span}{\mathrm{span}}\)
\( \newcommand{\id}{\mathrm{id}}\)
\( \newcommand{\Span}{\mathrm{span}}\)
\( \newcommand{\kernel}{\mathrm{null}\,}\)
\( \newcommand{\range}{\mathrm{range}\,}\)
\( \newcommand{\RealPart}{\mathrm{Re}}\)
\( \newcommand{\ImaginaryPart}{\mathrm{Im}}\)
\( \newcommand{\Argument}{\mathrm{Arg}}\)
\( \newcommand{\norm}[1]{\| #1 \|}\)
\( \newcommand{\inner}[2]{\langle #1, #2 \rangle}\)
\( \newcommand{\Span}{\mathrm{span}}\) \( \newcommand{\AA}{\unicode[.8,0]{x212B}}\)
\( \newcommand{\vectorA}[1]{\vec{#1}} % arrow\)
\( \newcommand{\vectorAt}[1]{\vec{\text{#1}}} % arrow\)
\( \newcommand{\vectorB}[1]{\overset { \scriptstyle \rightharpoonup} {\mathbf{#1}} } \)
\( \newcommand{\vectorC}[1]{\textbf{#1}} \)
\( \newcommand{\vectorD}[1]{\overrightarrow{#1}} \)
\( \newcommand{\vectorDt}[1]{\overrightarrow{\text{#1}}} \)
\( \newcommand{\vectE}[1]{\overset{-\!-\!\rightharpoonup}{\vphantom{a}\smash{\mathbf {#1}}}} \)
\( \newcommand{\vecs}[1]{\overset { \scriptstyle \rightharpoonup} {\mathbf{#1}} } \)
\( \newcommand{\vecd}[1]{\overset{-\!-\!\rightharpoonup}{\vphantom{a}\smash {#1}}} \)
\(\newcommand{\avec}{\mathbf a}\) \(\newcommand{\bvec}{\mathbf b}\) \(\newcommand{\cvec}{\mathbf c}\) \(\newcommand{\dvec}{\mathbf d}\) \(\newcommand{\dtil}{\widetilde{\mathbf d}}\) \(\newcommand{\evec}{\mathbf e}\) \(\newcommand{\fvec}{\mathbf f}\) \(\newcommand{\nvec}{\mathbf n}\) \(\newcommand{\pvec}{\mathbf p}\) \(\newcommand{\qvec}{\mathbf q}\) \(\newcommand{\svec}{\mathbf s}\) \(\newcommand{\tvec}{\mathbf t}\) \(\newcommand{\uvec}{\mathbf u}\) \(\newcommand{\vvec}{\mathbf v}\) \(\newcommand{\wvec}{\mathbf w}\) \(\newcommand{\xvec}{\mathbf x}\) \(\newcommand{\yvec}{\mathbf y}\) \(\newcommand{\zvec}{\mathbf z}\) \(\newcommand{\rvec}{\mathbf r}\) \(\newcommand{\mvec}{\mathbf m}\) \(\newcommand{\zerovec}{\mathbf 0}\) \(\newcommand{\onevec}{\mathbf 1}\) \(\newcommand{\real}{\mathbb R}\) \(\newcommand{\twovec}[2]{\left[\begin{array}{r}#1 \\ #2 \end{array}\right]}\) \(\newcommand{\ctwovec}[2]{\left[\begin{array}{c}#1 \\ #2 \end{array}\right]}\) \(\newcommand{\threevec}[3]{\left[\begin{array}{r}#1 \\ #2 \\ #3 \end{array}\right]}\) \(\newcommand{\cthreevec}[3]{\left[\begin{array}{c}#1 \\ #2 \\ #3 \end{array}\right]}\) \(\newcommand{\fourvec}[4]{\left[\begin{array}{r}#1 \\ #2 \\ #3 \\ #4 \end{array}\right]}\) \(\newcommand{\cfourvec}[4]{\left[\begin{array}{c}#1 \\ #2 \\ #3 \\ #4 \end{array}\right]}\) \(\newcommand{\fivevec}[5]{\left[\begin{array}{r}#1 \\ #2 \\ #3 \\ #4 \\ #5 \\ \end{array}\right]}\) \(\newcommand{\cfivevec}[5]{\left[\begin{array}{c}#1 \\ #2 \\ #3 \\ #4 \\ #5 \\ \end{array}\right]}\) \(\newcommand{\mattwo}[4]{\left[\begin{array}{rr}#1 \amp #2 \\ #3 \amp #4 \\ \end{array}\right]}\) \(\newcommand{\laspan}[1]{\text{Span}\{#1\}}\) \(\newcommand{\bcal}{\cal B}\) \(\newcommand{\ccal}{\cal C}\) \(\newcommand{\scal}{\cal S}\) \(\newcommand{\wcal}{\cal W}\) \(\newcommand{\ecal}{\cal E}\) \(\newcommand{\coords}[2]{\left\{#1\right\}_{#2}}\) \(\newcommand{\gray}[1]{\color{gray}{#1}}\) \(\newcommand{\lgray}[1]{\color{lightgray}{#1}}\) \(\newcommand{\rank}{\operatorname{rank}}\) \(\newcommand{\row}{\text{Row}}\) \(\newcommand{\col}{\text{Col}}\) \(\renewcommand{\row}{\text{Row}}\) \(\newcommand{\nul}{\text{Nul}}\) \(\newcommand{\var}{\text{Var}}\) \(\newcommand{\corr}{\text{corr}}\) \(\newcommand{\len}[1]{\left|#1\right|}\) \(\newcommand{\bbar}{\overline{\bvec}}\) \(\newcommand{\bhat}{\widehat{\bvec}}\) \(\newcommand{\bperp}{\bvec^\perp}\) \(\newcommand{\xhat}{\widehat{\xvec}}\) \(\newcommand{\vhat}{\widehat{\vvec}}\) \(\newcommand{\uhat}{\widehat{\uvec}}\) \(\newcommand{\what}{\widehat{\wvec}}\) \(\newcommand{\Sighat}{\widehat{\Sigma}}\) \(\newcommand{\lt}{<}\) \(\newcommand{\gt}{>}\) \(\newcommand{\amp}{&}\) \(\definecolor{fillinmathshade}{gray}{0.9}\)Electron-nuclear double resonance spectroscopy (ENDOR) is a powerful advanced EPR technique that probes the environment surrounding paramagnetic centers. It is of great use to further examine paramagnetic samples which give complicated spectra via the standard EPR method due to electronic-nuclear interactions manifested as the hyperfine interaction.
Introduction
The primary interest of this advanced EPR method lies in elucidation of the hyperfine interactions or coupling (hfc) of an unpaired electron with surrounding nuclei. In a standard CW-EPR experiment, one can often detect these hyperfine splittings, however accurate calculation of their values is generally a challenge. This is due to complexity of the environment of the spin system, which can result in splitting of the EPR transition due to coupling of the unpaired electron with several neighboring nuclei, resulting in overlapping signals that cannot always be distinguished. Inhomogeneous broadening of the EPR lineshapes due to a distribution in some property of the system, such as the orientation of the spins in a powder or frozen solution, also broadens each peak, thereby severely limiting assignment of hfc parameters and identification of these nuclei. ENDOR is able to greatly simplify these CW-EPR spectra by reducing the number of peaks, displaying only 2N peaks as opposed to 2N peaks for N-sets of equivalent nuclei, and allowing for selectivity of which couplings are observed through optimization of the ENDOR parameters. For a comprehensive discussion of EPR theory and relevant information to comprehensive of the content of this module please refer to the EPR: Theory module.
The Hyperfine Interaction
The permanent magnetic dipole of nuclei such as hydrogen, with I = ½, can interact with that of an unpaired electron if they are located closely in space. This hyperfine interaction is independent of the strength of the static magnetic field that is applied in a magnetic resonance experiment and leads to a splitting of the electronic spin states by an energy difference of half of the hyperfine coupling, \(A\). The energy splitting can be described by the equation:
\[ E_{hfc}=A\ m_I\ m_S \label{1}\]
where \(A\) is the hyperfine coupling constant (hfc). This hfc constant can contain both isotropic and anisotropic contributions, the latter of which is discussed in the dipolar coupling section of the module, but depends on both the electronic and nuclear g values, the electronic and nuclear magnetic moments, and the distance between them. These magnetic moments with the B0 field along the z-axis are:
\[ \mu_{ez}=\gamma_e \hat{S_z} \hbar=-g\beta_e \hat{S_z} \label{2}\]
\[ \mu_{nz}= \gamma_{n} \hat{I_z} \hbar=+g_n \beta_n \hat{I_z}\label{3} \]
for the electron and nucleus respectively. The isotropic hyperfine constant, that in the absence of a dipolar coupling contribution, as well as the Hamiltonain describing isotropic hfc are given by the equations below.
\[ A_{iso}=\dfrac{2\mu_0}{3}g\beta_e \beta_n | \Psi(0) |^2 \label{4}\]
\[ \hat{\mathcal{H}} =\dfrac{2\mu_0}{3}g\beta_e\beta_n | \Psi(0) |^2 \hat{S_z}\hat{I_z} \label{5}\]
The hfc constant is generally expressed in terms of units of frequency as:
\[ \dfrac{A_{iso}}{h}\label{6} \]
and can also be expressed in magnetic field units with the equation:
\[ a_{iso}=\dfrac{A_{iso}}{g_e\beta_e} \label{7}\]
It is generally this parameter that is sought to be determined in via ENDOR experiments.
Fundamentals of the technique
The key to the ENDOR technique lies in the use of both microwave, MW, and radiofrequency, RF, (B1) applied fields, resulting in a hybrid EPR and NMR experiment. Like all EPR experiments, the sample is placed in a homogenous magnetic field, B0, and secondary fields are applied to induce transitions between electronic spin states, however ENDOR also induces nuclear spin transitions to extract hfc parameters. The important requirement of the technique is the saturation of a specific EPR transition, resulting in an almost equal population in each of the two spin states, for example ms = ± ½. Then an RF frequency signal is applied to induce and also partly saturate NMR transitions, which results in a desaturation of the corresponding EPR transition. The selection rules for ENDOR are the same as that for NMR, \( \Delta M_S=0, \ \Delta M_I=\pm1 \). The saturation requirement for ENDOR can be shown below by the following two equations:
\[ \gamma_e^2 {B_1}^2 T_{1e} T_{2e} \geq 1,\ \gamma_n^2 {B_1}^2 T_{1n} T_{2n} \geq 1\label{8} \]
which show that the product of the gyromagnetic ratios, the saturating MW and RF field intensities, and the characteristic relaxation times of the system must be unity or larger.
.jpg?revision=1)
From here we will consider the simple case of the interaction between one electron, S = ½, and one proton, I = ½, for which the energy levels are shown below. The first splitting arises from the electron zeeman splitting discussed below, which removes the degeneracy of the electron ms = ± ½ spin states. The next splitting arises from the hyperfine coupling of the electron and nuclear spins, split by half of the hfc magnitude. The final splittings show the ENDOR/NMR transitions which comprise the spectrum. The wide arrows indicate the EPR transitions which are saturated.
Population Polarization
The diagram below shows the changes in populations that occur during an ENDOR experiment, as it is these changes that lead to the ENDOR effect and that are detected. Prior to the application of MW frequency photons, or a preparation pulse, the system exists with the majority of the population in the ms = - ½ spin manifold, as determined by the Boltzmann population distribution and show in (a) of the figure below. With the application of a MW field, or preparation MW pulse, the population is moved from the ms = - ½ to ms = + ½ manifold as expected by the inversion sequence, seen in (b) of the figure. Finally, after the mixing period and induction of on-resonance NMR transitions, population transfer occurs between the upper mI levels as seen in (c.) of the figure below. This is then detected as a change in the EPR signal with the CW technique, or with an ESE, electron spin echo, sequence using a pulsed ENDOR strategy. If the RF \(\pi\) pulse is off resonance, then this final population polarization does not occur.

Continuous Wave (CW) ENDOR
The first ENDOR technique invented was continuous wave ENDOR, in which the radio frequency source is modulated while the B0 applied field is held constant unlike a standard EPR experiment. The first derivative spectra are thus still obtained via this techniques. The EPR transitions seen above are saturatured, and an applied RF field desaturates these transitions, which are observed in the CW ENDOR spectrum as changes in the EPR signal intensity as a function of the frequency of the RF field applied. This is the most simple ENDOR experiment to discuss, however it has become a less commonly used method for acquisition of ENDOR spectra in recent years.
Pulsed ENDOR
Pulsed techniques offering several advantages over continuous wave ENDOR. CW ENDOR is the most sensitive of the techniques, however pulsed ENDOR provides higher resolution as well as allowing observation of weakly coupled nuclei. It also offers insight into the relaxation times of the system, is less susceptible to artifacts, and does not require balancing of relaxation times with RF power like the CW technique. Therefore, pulsed-ENDOR has been the most common technique in the past several decades, using pulse sequences predominantly developed by Mims and Davies. For an ENDOR experiment, either Mims or Davies, the homogenous applied magnetic field B0 is held constant, as opposed to the normal scanning of this field in a standard CW-EPR experiment. The field is selected where the EPR transition occurs by performing an ESE field sweep prior to beginning the experiment, thus fixing both the B0 and MW-B1 fields. This leaves the RF spectrum to be swept during the mixing period, much like in a standard NMR experiment. This is done by repeating the pulse sequence millions of times and using a different RF frequency during the mixing period for each sequence, which is done by randomly sampling each of the RF frequencies in the range. Electron spin echo, or ESE, is a technique used for signal detection in most pulsed advanced EPR methods
Davies ENDOR
In Davies ENDOR, a preparation \(\pi\), 180o, pulse is used in order to invert the magnetization of the spins in the applied static B0 field. This essentially creates a hole in the EPR spectrum, whose width and depth depend on the length of the pulse applied, with long pulse producing narrow holes. During the mixing period a \(\pi\) RF pulse is applied and if the RF frequency is resonant with an NMR transition, magnetization will be transferred to the other ms spin manifold, otherwise no mixing will occur to fill in the hole that the inversion pulse creates. During the detection period, the z-component of the magnetization is measured using a two pulse echo sequence, and one detects essentially the EPR signal that is restored during the mixing period. This technique is most suited to nuclei with large hfc values.

Mims ENDOR
The Mims ENDOR technique is based on a stimulated electron spin echo (ESE) sequence, using a two \(\frac{\pi}{2}\), 90o, preparation pulse sequence to invert the electron spin population, and a final \(\frac{\pi}{2}\) pulse after the mixing period to stimulate the ESE for signal detection. Between the preparation pulses and the final pulse, a radio frequency ppulse is used to invert the nuclear spin population, resulting in polarization transfer between the nuclear and electronic transitions in the so called “mixing period.”
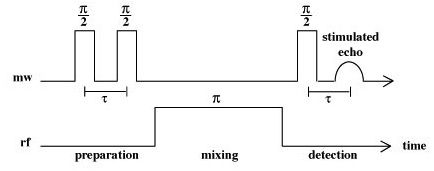
This results in the actual ENDOR transitions, changes in the intensity of the EPR transition, that are detected by use of the ESE MW-pulse sequence. The echo intensity is subsequently measured as a function of the RF frequency to give the characteristic ENDOR spectrum shown below.
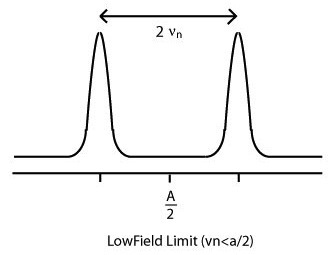
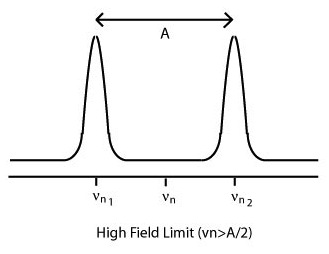
The hfc can be determined experimentally:
\(\begin{vmatrix}{{\nu_n}_1}\mp{{\nu_n}_2}\end{vmatrix}=h^{-1}\begin{vmatrix}A\end{vmatrix} \label{9}\)
where the plus sign is for the low field limit and the minus sign for the high field limit. In the low field limit, the nuclear Larmor frequency, or frequency of the precession of the nuclear spin in the presence of a magnetic field, is less than half of the hyperfine coupling, A. In the high field limit, the nuclear Larmor frequency is greater than half of the hyperfine coupling term, resulting in different assignments of the hfc parameter A according to the above equation.
The two techniques are very similar to each other in their implementation, however they are relatively complementary in their results and usefulness. The Mims ENDOR technique is most suited to weakly coupled nuclei, with small hyperfine coupling constants, A, generally less than 2 MHz and as low as 0.1 MHz. This makes the Davies ENDOR pulse sequence most useful for those nuclei with relatively large hyperfine couplings, therefore making the assignments of strongly and weakly coupled nuclei greatly simplified, as well as the corresponding spectra associated with each of the pulse sequences.
Experimental Parameters
The parameters to be specified in any given ENDOR experiment include the static B0 field, the microwave frequency, the RF power and range, the pulse lengths, the delay time (\( \tau \)), and the repetition rate. The delay time, or time between data collection at each RF frequency, is determined by the timescale on which equilibrium magnetization is restored. This is determined by a couple relaxation parameters, most importantly the spin lattice relaxation time (T1) and the transverse relaxation time (T2). T1 determines how quickly the magnitization realigns with the z-axis (B0) field, and T2 determines how quickly the magnetization in the x-y plane (transverse) disappears.
In a Davies ENDOR experiment, the microwave frequency bandwidth is the most important parameter to be set. The preparation inversion pulse burns a hole in the EPR spectrum, i.e. saturates an EPR transition, which is then filled in through population transfer by the RF inversion pulse. It is this parameter that needs to be optimized in order to get the best spectral intensity and resolution. In Mims ENDOR, the \( \tau \) value is the most important parameter to set, and the microwave frequency bandwidth is less important, which is the opposite case for Davies. However, a hole is still burned in the EPR spectrum, now with the use of two \( \frac{\pi}{2} \) pulses in the preparation period, but it is modulated according to the following equation.
\[ 1+\cos{2\pi\frac{(B_0-B)}{g\beta}\tau} \label{10}\]
Application of the RF inversion pulse during the mixing period shifts the magnetization away from B0 and changes this magnetization pattern. Mims ENDOR intensity then depends on the differences in the magnetization pattern following the preparation pulse, and those following the mixing period. Therefore Mims intensity is larger for larger differences in sinusoidal magnetization.
Spin Hamiltonian
Although the spin Hamiltonian applies to all EPR techniques, it is imperative to highlight the term of most importance for ENDOR spectroscopy which is the hyperfine coupling term describing the interaction of an unpaired electron with nuclei in its vicinity. The Hamiltonian for a system consisting of two spins, an electron with S = ½ and proton with I = ½ is shown below.
\[ \hat{H} = \hat{H}_{EZ}+\hat{H}_{NZ}+\hat{H}_{HF}+\hat{H}_{Q} \label{11}\]
\[ \hat{H} = \mu_B {\bf{B}}^T \bf{g} \hat{\bf{S}} - \mu_n g_n {\bf{B}}^T\hat{\bf{I}} +\hat{\bf{S}}^T {\bf{A}} \hat{\bf{I}} +\hat{\bf{I}}^T {\bf{Q}} \hat{\bf{I}} \label{12}\]
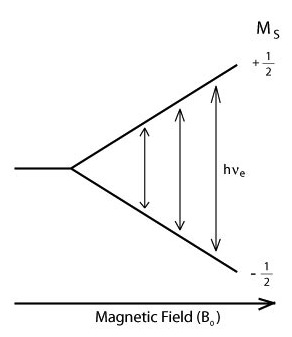
The terms shown are the electron Zeeman term, nuclear Zeeman term, hyperfine coupling term, and the nuclear quadrapole interaction term (which does not apply to nuclei with I < 1). Both the electron and nuclear Zeeman terms arise from the splitting of the spin states which are degenerate in the absence of an external magnetic field. The splitting of the spin up/down energy levels are linearly dependent on the strength of the applied B0 field according to these terms.
The third term describing the hyperfine interaction of the electron spin with nuclear magnetic moment is the most important term of the ENDOR technique. The hyperfine coupling magnitude and the identification of the nuclei from which the hfc arises is generally what ENDOR is used to elucidate, especially for the cases mentioned in the intro such as couplings to several nuclei or inhomogeneous broadening of a CW-EPR spectrum. The hyperfine coupling term \(A\) has two components arising from both an isotropic term, \(a_{iso}\), and in the case of a dipolar coupling interaction, an anisotropic term, \(a_{dip}\). The final term is the nuclear quadrapole interaction that arises for nuclei with I > 1, and this term is inherently anisotropic.
\[\hat{\mathcal{H}} = \mu_B \bf{B}}^T{\bf{g} \hat{\bf{S}} - \mu_n g_n \bf{B}}^T\hat{\bf{I}+ \hat{\bf{S}}^T \bf{A}}\hat{\bf{I}}+\hat{\bf{I}}^T \bf{Q} \hat{\bf{I}}+\hat{\bf{S}}^T \bf{D}\hat{\bf{S}}+\hat{\bf{S}_1}^T \bf{J}\hat{\bf{S}_2}} \label{13}\]
The full spin Hamiltonian is shown above which has terms that do not arise from the one electron, S = ½, and one proton, I = ½ being described, which includes a zero field splitting term as well as an electron-electron interaction term, both of which arise from the presence of more than one electron spin.
Anisotropy and Dipolar Coupling
The nuclear quadrupole interaction is intrinsically an anisotropic parameter of a system with I > ½, but the most important parameters of interest to the ENDOR technique that may contain anisotropy are hyperfine coupling, and less so the electron g value. The electronic g value anisotropy arises from the effect of orbital angular momentum on electron spin energy levels, which can provide information on the orbitals containing unpaired electrons. Even more important to ENDOR spectroscopy is hyperfine anisotropy, which is manifested in the dipolar coupling component of the hyperfine interaction. Hfc has two components, the isotropic contribution Aiso, and the anisotropic dipolar coupling contribution, denoted by Adip or T. Aiso is solely a result of unpaired electron spin in s-type orbitals, as they are the only type with an electron density at the nucleus that is finite.
\[A_{iso}=\frac{2}{3}\mu_0\mu_e\mu_n\begin{vmatrix}\Psi(0)\end{vmatrix}^2\]
or
\[A_{iso}=\frac{2\mu_0}{3}(g_e\beta_eg_n\beta_n)\langle\rho_x\rangle \label{14}\]
This unpaired spin density at the nucleus can arise from contact with sp-type ligand orbitals as well as by the unpaired spin density in other orbitals causing polarization of core s electrons, and is classified as direct or local contact. The anisotropic component, arising from dipolar coupling, can be local or nonlocal, and is only seen in frozen solutions or powders by EPR. Indirect dipolar coupling is a through space interaction between an electron point-dipole and nuclear-point dipole, such as that between a paramagnetic metal and a hydrogen nucleus bound to the metal through an oxygen atom. The value of the dipolar coupling can be determined by the equation
\[A_{dip}=\frac{-\mu_0}{4\pi}(g_e\beta_eg_n\beta_n)\frac{3\cos^2\theta-1}{R^3} \label{15}\]
Where R is the distance from the electron point-dipole to nuclear point-dipole and theta is the angle between the bond connecting the two particles. Direct dipolar coupling would arise from the metal being directly bound to the hydrogen atom, not through a donor atom. These anisotropic effects of the hyperfine coupling can make the ENDOR spectrum distorted from the above sketches showing two symmetric peaks separated by a clean baseline.
![Salt2-[Converted].jpg](https://chem.libretexts.org/@api/deki/files/9271/Salt2-%255BConverted%255D.jpg?revision=1)
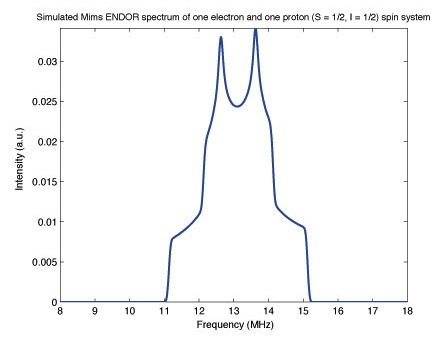
The above X-band spectra simulated using the EasySpin toolbox for MATLAB, developed by Dr. Stefan Stoll, demonstrates this fact. An anisotropic hyperfine coupling tensor was used to simulate the above left Mims ENDOR spectrum of a single proton and single electron, and an isotropic g tensor was used for each to highlight the effect of an anisotropic hyperfine tensor. The spectrum no longer contains two symmetric peaks like the idealized spectra shown in the Mims ENDOR spectrum on the right, that was simulated with an isotropic hyperfine term, due to the anisotropy of the hyperfine term from the dipolar coupling contribution discussed above. This anisotropy can complicate the interpretation of ENDOR spectra, however it can also provide a plethora of information on the symmetry and environment of a paramagnetic center.
References
- Weil, J. A. & Bolton, J. R. (2007). Electron Paramagnetic Resonance Spectroscopy: Elementary Theory and Applications, Second Edition. Wiley-Interscience.
- Schweiger, A. & Jeschke, G. (2001). Principles of Pulse Electron Paramagnetic Resonance. Oxford University Press.
- Hoff, A. J. (1989). Advanced EPR: Applications in Biology and Biochemistry. Elsevier Science Publication Company Inc.
- Mims, W. B. (1965). "Pulsed ENDOR Experiments". Proceedings of the Royal Society of London. Series A, Mathematical and Physical Sciences. Vol. 283, No. 1395, pp. 452-457
Problems
- For a system with a single unpaired electron interacting with 4 identical nuclei all with I = 1/2 how many lines would be observed in the CW-EPR spectrum and the ENDOR spectrum?
- What effect does an increase in the static B0 magnetic field have in a one electron one nucleus system (S = 1/2, I = 1/2) on the separation of the two peaks and the nuclear Larmor frequency?
- Why is it that an ENDOR experiment is so much more sensitive than an ordinary NMR experiment?
- For the Hydrogen atom, with S = 1/2 and I = 1/2, which electronic orbitals will give rise to a hyperfine interaction term in the spin Hamiltonian?
Solutions
- The number of CW-EPR peaks for the one electron (S = 1/2) and 4 nuclei (I = 1/2) system is 24 = 16 peaks observed in this spectrum. ENDOR reduces the number of peaks in half, hence 2*4 = 8 peaks are seen in this spectrum.
- An increase in the static applied magnetic field has no effect on the separation of the 2 ENDOR peaks, as the value of the hyperfine coupling remains constant regardless of the strength of the applied field. However, since the nuclear Larmor frequency (as well as electron Larmor frequency) is linearly dependent on the strength of the applied field, the spectrum would be shifted to a higher frequency as the strength of the field is increased as \(g_n\beta_nB\).
- This is mainly due to differences in population distribution in both types of experiments. ENDOR is more sensitive due to larger population distributions between spin up and down becuase the transitions are inherently larger energy, the rate of absoprtion of radiation is higher in EPR/ENDOR, and in an ENDOR experiment the electron magnetic field adds with the external field leading to a large net field at the nucleus and thus a larger population difference between spin states.
- For all atoms, in order for isotropic hyperfine splitting to occur there must be a non-zero probability that the electron may reside at the nucleus. It is apparent that only s-type orbitals give rise to a non-zero probability at the nucleus, as p, d, f, ..., orbitals all contain a node at the nucleus (for \(\begin{vmatrix}\Psi(0)\end{vmatrix}^2\)). Therefore, the 1s1 ground state electronic configuration of Hydrogen will give rise to hyperfine splitting, as well as all excited states with the electron in an s orbital, e.g. 2s1, 3s1, 4s1, etc..

