
4.8: EPR Spectroscopy
- Page ID
- 55889

\( \newcommand{\vecs}[1]{\overset { \scriptstyle \rightharpoonup} {\mathbf{#1}} } \)
\( \newcommand{\vecd}[1]{\overset{-\!-\!\rightharpoonup}{\vphantom{a}\smash {#1}}} \)
\( \newcommand{\id}{\mathrm{id}}\) \( \newcommand{\Span}{\mathrm{span}}\)
( \newcommand{\kernel}{\mathrm{null}\,}\) \( \newcommand{\range}{\mathrm{range}\,}\)
\( \newcommand{\RealPart}{\mathrm{Re}}\) \( \newcommand{\ImaginaryPart}{\mathrm{Im}}\)
\( \newcommand{\Argument}{\mathrm{Arg}}\) \( \newcommand{\norm}[1]{\| #1 \|}\)
\( \newcommand{\inner}[2]{\langle #1, #2 \rangle}\)
\( \newcommand{\Span}{\mathrm{span}}\)
\( \newcommand{\id}{\mathrm{id}}\)
\( \newcommand{\Span}{\mathrm{span}}\)
\( \newcommand{\kernel}{\mathrm{null}\,}\)
\( \newcommand{\range}{\mathrm{range}\,}\)
\( \newcommand{\RealPart}{\mathrm{Re}}\)
\( \newcommand{\ImaginaryPart}{\mathrm{Im}}\)
\( \newcommand{\Argument}{\mathrm{Arg}}\)
\( \newcommand{\norm}[1]{\| #1 \|}\)
\( \newcommand{\inner}[2]{\langle #1, #2 \rangle}\)
\( \newcommand{\Span}{\mathrm{span}}\) \( \newcommand{\AA}{\unicode[.8,0]{x212B}}\)
\( \newcommand{\vectorA}[1]{\vec{#1}} % arrow\)
\( \newcommand{\vectorAt}[1]{\vec{\text{#1}}} % arrow\)
\( \newcommand{\vectorB}[1]{\overset { \scriptstyle \rightharpoonup} {\mathbf{#1}} } \)
\( \newcommand{\vectorC}[1]{\textbf{#1}} \)
\( \newcommand{\vectorD}[1]{\overrightarrow{#1}} \)
\( \newcommand{\vectorDt}[1]{\overrightarrow{\text{#1}}} \)
\( \newcommand{\vectE}[1]{\overset{-\!-\!\rightharpoonup}{\vphantom{a}\smash{\mathbf {#1}}}} \)
\( \newcommand{\vecs}[1]{\overset { \scriptstyle \rightharpoonup} {\mathbf{#1}} } \)
\( \newcommand{\vecd}[1]{\overset{-\!-\!\rightharpoonup}{\vphantom{a}\smash {#1}}} \)
\(\newcommand{\avec}{\mathbf a}\) \(\newcommand{\bvec}{\mathbf b}\) \(\newcommand{\cvec}{\mathbf c}\) \(\newcommand{\dvec}{\mathbf d}\) \(\newcommand{\dtil}{\widetilde{\mathbf d}}\) \(\newcommand{\evec}{\mathbf e}\) \(\newcommand{\fvec}{\mathbf f}\) \(\newcommand{\nvec}{\mathbf n}\) \(\newcommand{\pvec}{\mathbf p}\) \(\newcommand{\qvec}{\mathbf q}\) \(\newcommand{\svec}{\mathbf s}\) \(\newcommand{\tvec}{\mathbf t}\) \(\newcommand{\uvec}{\mathbf u}\) \(\newcommand{\vvec}{\mathbf v}\) \(\newcommand{\wvec}{\mathbf w}\) \(\newcommand{\xvec}{\mathbf x}\) \(\newcommand{\yvec}{\mathbf y}\) \(\newcommand{\zvec}{\mathbf z}\) \(\newcommand{\rvec}{\mathbf r}\) \(\newcommand{\mvec}{\mathbf m}\) \(\newcommand{\zerovec}{\mathbf 0}\) \(\newcommand{\onevec}{\mathbf 1}\) \(\newcommand{\real}{\mathbb R}\) \(\newcommand{\twovec}[2]{\left[\begin{array}{r}#1 \\ #2 \end{array}\right]}\) \(\newcommand{\ctwovec}[2]{\left[\begin{array}{c}#1 \\ #2 \end{array}\right]}\) \(\newcommand{\threevec}[3]{\left[\begin{array}{r}#1 \\ #2 \\ #3 \end{array}\right]}\) \(\newcommand{\cthreevec}[3]{\left[\begin{array}{c}#1 \\ #2 \\ #3 \end{array}\right]}\) \(\newcommand{\fourvec}[4]{\left[\begin{array}{r}#1 \\ #2 \\ #3 \\ #4 \end{array}\right]}\) \(\newcommand{\cfourvec}[4]{\left[\begin{array}{c}#1 \\ #2 \\ #3 \\ #4 \end{array}\right]}\) \(\newcommand{\fivevec}[5]{\left[\begin{array}{r}#1 \\ #2 \\ #3 \\ #4 \\ #5 \\ \end{array}\right]}\) \(\newcommand{\cfivevec}[5]{\left[\begin{array}{c}#1 \\ #2 \\ #3 \\ #4 \\ #5 \\ \end{array}\right]}\) \(\newcommand{\mattwo}[4]{\left[\begin{array}{rr}#1 \amp #2 \\ #3 \amp #4 \\ \end{array}\right]}\) \(\newcommand{\laspan}[1]{\text{Span}\{#1\}}\) \(\newcommand{\bcal}{\cal B}\) \(\newcommand{\ccal}{\cal C}\) \(\newcommand{\scal}{\cal S}\) \(\newcommand{\wcal}{\cal W}\) \(\newcommand{\ecal}{\cal E}\) \(\newcommand{\coords}[2]{\left\{#1\right\}_{#2}}\) \(\newcommand{\gray}[1]{\color{gray}{#1}}\) \(\newcommand{\lgray}[1]{\color{lightgray}{#1}}\) \(\newcommand{\rank}{\operatorname{rank}}\) \(\newcommand{\row}{\text{Row}}\) \(\newcommand{\col}{\text{Col}}\) \(\renewcommand{\row}{\text{Row}}\) \(\newcommand{\nul}{\text{Nul}}\) \(\newcommand{\var}{\text{Var}}\) \(\newcommand{\corr}{\text{corr}}\) \(\newcommand{\len}[1]{\left|#1\right|}\) \(\newcommand{\bbar}{\overline{\bvec}}\) \(\newcommand{\bhat}{\widehat{\bvec}}\) \(\newcommand{\bperp}{\bvec^\perp}\) \(\newcommand{\xhat}{\widehat{\xvec}}\) \(\newcommand{\vhat}{\widehat{\vvec}}\) \(\newcommand{\uhat}{\widehat{\uvec}}\) \(\newcommand{\what}{\widehat{\wvec}}\) \(\newcommand{\Sighat}{\widehat{\Sigma}}\) \(\newcommand{\lt}{<}\) \(\newcommand{\gt}{>}\) \(\newcommand{\amp}{&}\) \(\definecolor{fillinmathshade}{gray}{0.9}\)Basic Principles for EPR Spectroscopy
Electron paramagnetic resonance spectroscopy (EPR) is a powerful tool for investigating paramagnetic species, including organic radicals, inorganic radicals, and triplet states. The basic principles behind EPR are very similar to the more ubiquitous nuclear magnetic resonance spectroscopy (NMR), except that EPR focuses on the interaction of an external magnetic field with the unpaired electron(s) in a molecule, rather than the nuclei of individual atoms. EPR has been used to investigate kinetics, mechanisms, and structures of paramagnetic species and along with general chemistry and physics, has applications in biochemistry, polymer science, and geosciences.
The degeneracy of the electron spin states is lifted when an unpaired electron is placed in a magnetic field, creating two spin states, ms = ± ½, where ms = - ½, the lower energy state, is aligned with the magnetic field. The spin state on the electron can flip when electromagnetic radiation is applied. In the case of electron spin transitions, this corresponds to radiation in the microwave range.
The energy difference between the two spin states is given by the equation
\[ \Delta E \ =\ E_{+} - E_{-} = h \nu = g \beta B \label{1} \]
where h is Planck’s constant (6.626 x 10⁻³⁴ J s-1), v is the frequency of radiation, ß is the Bohr magneton (9.274 x 10⁻²⁴ J T-1), B is the strength of the magnetic field in Tesla, and g is known as the g-factor. The g-factor is a unitless measurement of the intrinsic magnetic moment of the electron, and its value for a free electron is 2.0023. The value of g can vary, however, and can be calculated by rearrangement of the above equation, i.e.,
\[ g = \dfrac{h \nu}{\beta B }\label{2} \]
using the magnetic field and the frequency of the spectrometer. Since h, v, and ß should not change during an experiment, g values decrease as B increases. The concept of g can be roughly equated to that of chemical shift in NMR.
Instrumentation
EPR spectroscopy can be carried out by either 1) varying the magnetic field and holding the frequency constant or 2) varying the frequency and holding the magnetic field constant (as is the case for NMR spectroscopy). Commercial EPR spectrometers typically vary the magnetic field and holding the frequency constant, opposite of NMR spectrometers. The majority of EPR spectrometers are in the range of 8-10 GHz (X-band), though there are spectrometers which work at lower and higher fields: 1-2 GHz (L-band) and 2-4 GHz (S-band), 35 GHz (Q-band) and 95 GHz (W-band).
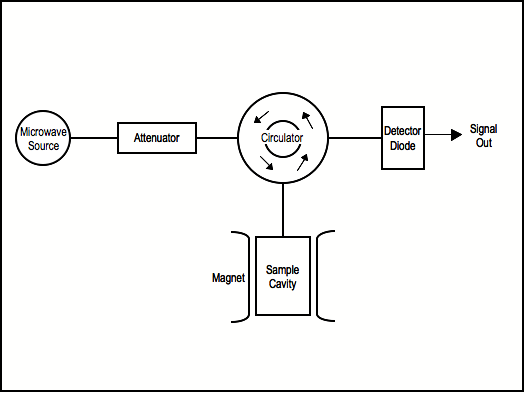
EPR spectrometers work by generating microwaves from a source (typically a klystron), sending them through an attenuator, and passing them on to the sample, which is located in a microwave cavity (Figure \(\PageIndex{1}\)).
Microwaves reflected back from the cavity are routed to the detector diode, and the signal comes out as a decrease in current at the detector analogous to absorption of microwaves by the sample.
Samples for EPR can be gases, single crystals, solutions, powders, and frozen solutions. For solutions, solvents with high dielectric constants are not advisable, as they will absorb microwaves. For frozen solutions, solvents that will form a glass when frozen are preferable. Good glasses are formed from solvents with low symmetry and solvents that do not hydrogen bond. Drago provides an extensive list of solvents that form good glasses.
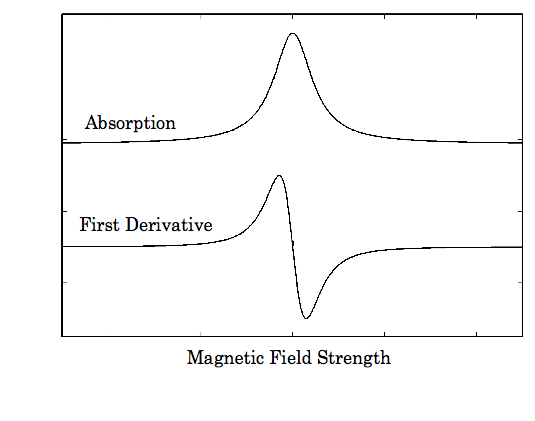
EPR spectra are generally presented as the first derivative of the absorption spectra for ease of interpretation. An example is given in Figure \(\PageIndex{2}\).
Magnetic field strength is generally reported in units of Gauss or mTesla. Often EPR spectra are very complicated, and analysis of spectra through the use of computer programs is usual. There are computer programs that will predict the EPR spectra of compounds with the input of a few parameters.
Factors that Affect EPR Spectra
Hyperfine Coupling
Hyperfine coupling in EPR is analogous to spin-spin coupling in NMR. There are two kinds of hyperfine coupling: 1) coupling of the electron magnetic moment to the magnetic moment of its own nucleus; and 2) coupling of the electron to a nucleus of a different atom, called super hyperfine splitting. Both types of hyperfine coupling cause a splitting of the spectral lines with intensities following Pascal’s triangle for I = 1/2 nuclei, similar to J-coupling in NMR. A simulated spectrum of the methyl radical is shown in Figure \(\PageIndex{3}\). The line is split equally by the three hydrogens giving rise to four lines of intensity 1:3:3:1 with hyperfine coupling constant a.

The hyperfine splitting constant, known as a, can be determined by measuring the distance between each of the hyperfine lines. This value can be converted into Hz (A) using the g value in the equation:
\[ hA\ =\ g \beta a \label{3} \]
In the specific case of Cu(II), the nuclear spin of Cu is I = 3/2, so the hyperfine splitting would result in four lines of intensity 1:1:1:1. Similarly, super hyperfine splitting of Cu(II) ligated to four symmetric I = 1 nuclei, such as 14N, would yield nine lines with intensities would be 1:8:28:56:70:56:28:8:1.
Anisotropy
The g factor of many paramagnetic species, including Cu(II), is anisotropic, meaning that it depends on its orientation in the magnetic field. The g factor for anisotropic species breaks down generally into three values of g following a Cartesian coordinate system which is symmetric along the diagonal: gx, gy, and gz. There are four limits to this system:
- When gx = gy = gz the spectrum is considered to be isotropic, and is not dependent on orientation in the magnetic field.
- When gx = gy > gz the spectrum is said to be axial, and is elongated along the z-axis. The two equivalent g values are known as g⊥ while the singular value is known as g‖. It exhibits a small peak at low field and a large peak at high field.
- When gx = gy < gz the spectrum is also said to be axial, but is shortened in the xy plane. It exhibits a large peak at low field and a small peak at high field.
- When gx ≠ gy ≠ gz the spectrum is said to be rhombic, and shows three large peaks corresponding to the different components of g.
Condition ii corresponds to Cu(II) in a square planar geometry with the unpaired electron in the dx2-y2 orbital. Where there is also hyperfine splitting involved, g is defined as being the weighted average of the lines.
Electron Paramagnetic Resonance Spectroscopy of Copper(II) Compounds
Copper(II) Compounds
Copper compounds play a valuable role in both synthetic and biological chemistry. Copper catalyzes a vast array of reactions, primarily oxidation-reduction reactions which make use of the Cu(I)/Cu(II) redox cycle. Copper is found in the active site of many enzymes and proteins, including the oxygen carrying proteins called hemocyanins.
Common oxidation states of copper include the less stable copper(I) state, Cu+; and the more stable copper(II) state, Cu2+. Copper (I) has a d10 electronic configuration with no unpaired electrons, making it undetectable by EPR. The d9 configuration of Cu2+ means that its compounds are paramagnetic making EPR of Cu(II) containing species a useful tool for both structural and mechanistic studies. Two literature examples of how EPR can provide insight into the mechanisms of reactivity of Cu(II) are discussed herein.
Copper (II) centers typically have tetrahedral, or axially elongated octahedral geometry. Their spectra are anisotropic and generally give signals of the axial or orthorhombic type. From EPR spectra of copper (II) compounds, the coordination geometry can be determined. An example of a typical powder Cu(II) spectrum is shown in Figure \(\PageIndex{4}\).
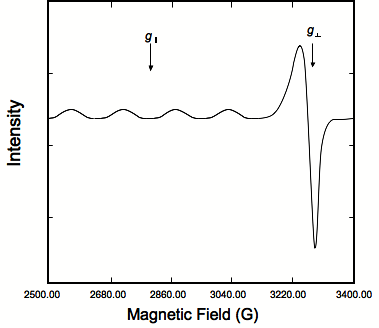
The spectrum above shows four absorption-like peaks corresponding to g‖ indicating coordination to four identical atoms, most likely nitrogen. There is also an asymmetric derivative peak corresponding to g⊥ at higher field indicating elongation along the z axis.
Determination of an Intermediate
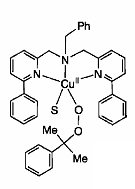
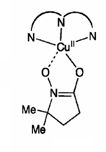
The reactivity and mechanism of Cu(II)-peroxy systems was investigated by studying the decomposition of the Cu(II) complex 1 with EPR as well as UV-Vis and Raman spectroscopy. The structure (Figure \(\PageIndex{5}\)) and EPR spectrum Figure \(\PageIndex{6}\) of 1 are given. It was postulated that decomposition of 1 may go through intermediates LCu(II)OOH, LCu(II)OO•, or LCu(II)O• where L = ligand.
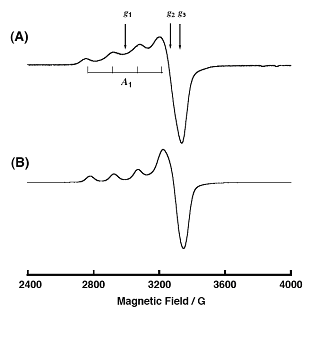
To determine the intermediate, a common radical trap 5,5-dimethyl-1-pyrroline-N-oxide (DMPO) was added. A 1:1 complex of intermediate and DMPO was isolated, and given the possible structure 2 (Figure \(\PageIndex{7}\), which is shown along with its EPR specturm (Figure \(\PageIndex{8}\)).
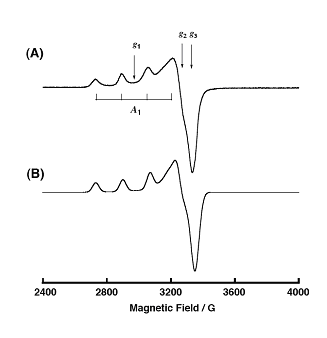
The EPR data show similar though different spectra for Cu(II) in each compound, indicating a similar coordination environment – elongated axial, and most likely a LCu(II)O• intermediate.
Determination of a Catalytic Cycle
The mechanism of oxidizing alcohols to aldehydes using a Cu(II) catalyst, TEMPO, and O2 was investigated using EPR. A proposed mechanism is given in Figure \(\PageIndex{9}\).

EPR studies were conducted during the reaction by taking aliquots at various time points and immediately freezing the samples for EPR analysis. The resulting spectra are shown in Figure \(\PageIndex{10}\).

The EPR spectrum (a) in Figure 6, after 1.2 hours shows a signal for TEMPO at g = 2.006 as well as a signal for Cu(II) with g‖= 2.26, g⊥ = 2.06, A‖ = 520 MHz, and A⊥ < 50 MHz. After 4 hours, the signal for Cu(II) is no longer in the reaction mixture, and the TEMPO signal has decreased significantly. Suggesting that all the Cu(II) has been reduced to Cu(I) and the majority of TEMPO has been oxidized. After 8 hours, the signals for both Cu(II) and TEMPO have returned indicating regeneration of both species. In this way, EPR evidence supports the proposed mechanism.
Electron-Nuclear Double Resonance Spectroscopy
Electron nuclear double resonance (ENDOR) uses magnetic resonance to simplify the electron paramagnetic resonance (EPR) spectra of paramagnetic species (one which contains an unpaired electron). It is very powerful and advanced and it works by probing the environment of these species. ENDOR was invented in 1956 by George Feher (Figure \(\PageIndex{11}\)).

ENDOR: NMR Spectroscopy on an EPR Spectrometer
A transition’s metal electron spin can interact with the nuclear spins of ligands through dipolar contact interactions. This causes shifts in the nuclear magnetic resonance (NMR) Spectrum lines caused by the ligand nuclei. The NMR technique uses these dipolar interactions, as they correspond to the nuclear spin’s relative position to the metal atom, to give information about the nuclear coordinates. However, a paramagnetic species (one that contains unpaired electrons) complicates the NMR spectrum by broadening the lines considerably.
EPR is a technique used to study paramagnetic compounds. However, EPR has its limitations as it offers low resolution that result in line broadening and line splitting. This is partly due to the electron spins coupling to surrounding nuclear spins. However, this coupling are important to understand a paramagnetic compound and determine the coordinates of its ligands. While neither NMR or EPR can be used to study these coupling interaction, one can use both techniques simultaneously, which is the concept behind ENDOR. An ENDOR experiment is a double resonance experiment in which NMR resonances are detected using intensity changes of an EPR line that is irradiated simultaneously. An important difference is that the NRM portion of an ENDOR experiment uses microwaves rather than radiofrequencies, which results in an enhancement of the sensitivity by several orders of magnitude.
Theory
The ENDOR technique involves monitoring the effects of EPR transitions of a simultaneously driven NMR transition, which allows for the detection of the NMR absorption with much greater sensitivity than EPR. In order to illustrate the ENDOR system, a two-spin system is used. This involves a magnetic field (Bo) interacting with one electron (S = 1/2) and one proton (I = 1/2).
Hamiltonian Equation
The Hamiltonian equation for a two-spin system is described by \ref{4}. The equation lists four terms: the electron Zeeman interaction (EZ), the nuclear Zeeman interaction (NZ), the hyperfine interaction (HFS), respectively. The EZ relates to the interaction the spin of the electron and the magnetic field applied. The NZ describes the interaction of the proton’s magnetic moment and the magnetic field. The HSF is the interaction of the coupling that occurs between spin of the electron and the nuclear spin of the proton. ENDOR spectra contain information on all three terms of the Hamiltonian.
\[ H_{0} \ =\ H_{EZ}\ +\ H_{NZ}\ +\ H_{HFS} \label{4} \]
Selection Rules
\ref{4} can be further expanded to \ref{5}. gn is the nuclear g-factor, which characterizes the magnetic moment of the nucleus. S and I are the vector operators for the spins of the electron and nucleus, respectively. μB is the Bohr magneton (9.274 x 10⁻²⁴ JT-1). μn is the nuclear magneton (5.05 x 10⁻²⁷ JT-1). h is the Plank constant (6.626 x 10⁻³⁴ J s). g and A are the g and hyperfine tensors. \ref{5} becomes \ref{6} by assuming only isotropic interactions and the magnetic filed aligned along the Z-axis. In \ref{6}, g is the isotropic g-factor and a is the isotropic hyperfine constant.
\[ H\ =\ \mu_{B}B_{0}gS\ -\ g_{n}\mu _{n}B_{0}I \ +\ hSAI \label{5} \]
\[ H\ =\ g\mu_{B}B_{0}S_{Z} - g_{n}\mu _{n} B_{0} I_{Z} \ +\ haSI \label{6} \]
The energy levels for the two spin systems can be calculated by ignoring second order terms in the high filed approximation by \ref{7}. This equation can be used to express the four possible energy levels of the two-spin system (S = 1/2, I = 1/2) in \ref{8} - \ref{11}
\[E(M_{S},M_{I}) = g \mu _{B} B_{0} M_{S} - g_{n} \mu _{n} B_{0} M_{I} \ +\ haM_{S}M_{I} \label{7} \]
\[E_{a}\ =\ -1/2g\mu _{B} B_{0} - 1/2g_{n} \mu _{n} B_{0} - 1/4ha \label{8} \]
\[E_{b}\ =\ +1/2g\mu _{B} B_{0} - 1/2g_{n} \mu _{n} B_{0} + 1/4ha \label{9} \]
\[E_{c}\ =\ +1/2g\mu _{B} B_{0} + 1/2g_{n} \mu _{n} B_{0} - 1/4ha \label{10} \]
\[E_{d}\ =\ -1/2g\mu _{B} B_{0} + 1/2g_{n} \mu _{n} B_{0} + 1/4ha \label{11} \]
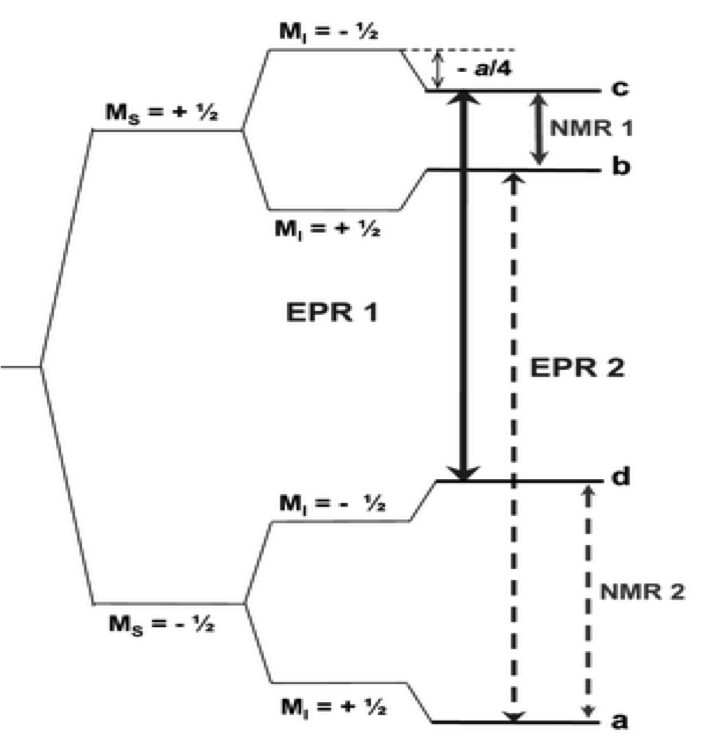
We can apply the EPR selection rules to these energy levels (ΔMI = 0 and ΔMS = ±1) to find the two possible resonance transitions that can occur, shown in \ref{12} and \ref{13}. These equations can be further simplified by expressing them in frequency units, where νe = gμnB0/h to derive \ref{14}, which defines the EPR transitions (Figure \(\PageIndex{12}\)). In the spectrum this would give two absorption peaks that are separated by the isotropic hyperfine splitting, a (Figure \(\PageIndex{12}\)).
\[ \Delta E_{cd}\ =\ E_{c}\ -\ E_{d} \ =\ g \mu_{B} B - 1/2ha \label{12} \]
\[ \Delta E_{ab}\ =\ E_{b}\ -\ E_{a} \ =\ g \mu_{B} B + 1/2ha \label{13} \]
\[V_{EPR} \ =\ v_{e} \pm a/2 \label{14} \]
Applications
ENDOR has advantages in both organic and inorganic paramagnetic species as it is helpful in characterizing their structure in both solution and in the solid state. First, it enhances the resolution gained in organic radicals in solution. In ENDOR, each group of equivalent nuclei contributes only 2 lines to the spectrum, and nonequivalent nuclei cause only an additive increase as opposed to a multiplicative increase like in EPR. For example, the radical cation 9,10-dimethilanthracene (Figure \(\PageIndex{14}\)) would produce 175 lines in an EPR spectrum because the spectra would include 3 sets of inequivalent protons. However ENDOR produces only three pairs of lines (1 for each set of equivalent nuclei), which can be used to find the hyperfine couplings. This is also shown in Figure \(\PageIndex{14}\).

ENDOR can also be used to obtain structural information from the powder EPR spectra of metal complexes. ENDOR spectroscopy can be used to obtain the electron nuclear hyperfine interaction tensor, which is the most sensitive probe for structure determination. A magnetic filed that assumes all possible orientations with respect to the molecular frame is applied to the randomly oriented molecules. The resonances from this are superimposed on each other and make up the powder EPR spectrum. ENDOR measurements are made at a selected field position in the EPR spectrum, which only contain that subset of molecules that have orientations that contribute to the EPR intensity at the chosen value of the observing field. By selected EPR turning points at magnetic filed values that correspond to defined molecular orientations, a “single crystal like” ENDOR spectra is obtained. This is also called a “orientation selective” ENDOR experiment which can use simulation of the data to obtain the principal components of the magnetic tensors for each interacting nucleus. This information can then be used to provide structural information about the distance and spatial orientation of the remote nucleus. This can be especially interesting since a three dimensional structure for a paramagnetic system where a single crystal cannot be prepared can be obtained.