
Lab 6: Capillary Electrophoresis
- Page ID
- 136269

\( \newcommand{\vecs}[1]{\overset { \scriptstyle \rightharpoonup} {\mathbf{#1}} } \)
\( \newcommand{\vecd}[1]{\overset{-\!-\!\rightharpoonup}{\vphantom{a}\smash {#1}}} \)
\( \newcommand{\dsum}{\displaystyle\sum\limits} \)
\( \newcommand{\dint}{\displaystyle\int\limits} \)
\( \newcommand{\dlim}{\displaystyle\lim\limits} \)
\( \newcommand{\id}{\mathrm{id}}\) \( \newcommand{\Span}{\mathrm{span}}\)
( \newcommand{\kernel}{\mathrm{null}\,}\) \( \newcommand{\range}{\mathrm{range}\,}\)
\( \newcommand{\RealPart}{\mathrm{Re}}\) \( \newcommand{\ImaginaryPart}{\mathrm{Im}}\)
\( \newcommand{\Argument}{\mathrm{Arg}}\) \( \newcommand{\norm}[1]{\| #1 \|}\)
\( \newcommand{\inner}[2]{\langle #1, #2 \rangle}\)
\( \newcommand{\Span}{\mathrm{span}}\)
\( \newcommand{\id}{\mathrm{id}}\)
\( \newcommand{\Span}{\mathrm{span}}\)
\( \newcommand{\kernel}{\mathrm{null}\,}\)
\( \newcommand{\range}{\mathrm{range}\,}\)
\( \newcommand{\RealPart}{\mathrm{Re}}\)
\( \newcommand{\ImaginaryPart}{\mathrm{Im}}\)
\( \newcommand{\Argument}{\mathrm{Arg}}\)
\( \newcommand{\norm}[1]{\| #1 \|}\)
\( \newcommand{\inner}[2]{\langle #1, #2 \rangle}\)
\( \newcommand{\Span}{\mathrm{span}}\) \( \newcommand{\AA}{\unicode[.8,0]{x212B}}\)
\( \newcommand{\vectorA}[1]{\vec{#1}} % arrow\)
\( \newcommand{\vectorAt}[1]{\vec{\text{#1}}} % arrow\)
\( \newcommand{\vectorB}[1]{\overset { \scriptstyle \rightharpoonup} {\mathbf{#1}} } \)
\( \newcommand{\vectorC}[1]{\textbf{#1}} \)
\( \newcommand{\vectorD}[1]{\overrightarrow{#1}} \)
\( \newcommand{\vectorDt}[1]{\overrightarrow{\text{#1}}} \)
\( \newcommand{\vectE}[1]{\overset{-\!-\!\rightharpoonup}{\vphantom{a}\smash{\mathbf {#1}}}} \)
\( \newcommand{\vecs}[1]{\overset { \scriptstyle \rightharpoonup} {\mathbf{#1}} } \)
\(\newcommand{\longvect}{\overrightarrow}\)
\( \newcommand{\vecd}[1]{\overset{-\!-\!\rightharpoonup}{\vphantom{a}\smash {#1}}} \)
\(\newcommand{\avec}{\mathbf a}\) \(\newcommand{\bvec}{\mathbf b}\) \(\newcommand{\cvec}{\mathbf c}\) \(\newcommand{\dvec}{\mathbf d}\) \(\newcommand{\dtil}{\widetilde{\mathbf d}}\) \(\newcommand{\evec}{\mathbf e}\) \(\newcommand{\fvec}{\mathbf f}\) \(\newcommand{\nvec}{\mathbf n}\) \(\newcommand{\pvec}{\mathbf p}\) \(\newcommand{\qvec}{\mathbf q}\) \(\newcommand{\svec}{\mathbf s}\) \(\newcommand{\tvec}{\mathbf t}\) \(\newcommand{\uvec}{\mathbf u}\) \(\newcommand{\vvec}{\mathbf v}\) \(\newcommand{\wvec}{\mathbf w}\) \(\newcommand{\xvec}{\mathbf x}\) \(\newcommand{\yvec}{\mathbf y}\) \(\newcommand{\zvec}{\mathbf z}\) \(\newcommand{\rvec}{\mathbf r}\) \(\newcommand{\mvec}{\mathbf m}\) \(\newcommand{\zerovec}{\mathbf 0}\) \(\newcommand{\onevec}{\mathbf 1}\) \(\newcommand{\real}{\mathbb R}\) \(\newcommand{\twovec}[2]{\left[\begin{array}{r}#1 \\ #2 \end{array}\right]}\) \(\newcommand{\ctwovec}[2]{\left[\begin{array}{c}#1 \\ #2 \end{array}\right]}\) \(\newcommand{\threevec}[3]{\left[\begin{array}{r}#1 \\ #2 \\ #3 \end{array}\right]}\) \(\newcommand{\cthreevec}[3]{\left[\begin{array}{c}#1 \\ #2 \\ #3 \end{array}\right]}\) \(\newcommand{\fourvec}[4]{\left[\begin{array}{r}#1 \\ #2 \\ #3 \\ #4 \end{array}\right]}\) \(\newcommand{\cfourvec}[4]{\left[\begin{array}{c}#1 \\ #2 \\ #3 \\ #4 \end{array}\right]}\) \(\newcommand{\fivevec}[5]{\left[\begin{array}{r}#1 \\ #2 \\ #3 \\ #4 \\ #5 \\ \end{array}\right]}\) \(\newcommand{\cfivevec}[5]{\left[\begin{array}{c}#1 \\ #2 \\ #3 \\ #4 \\ #5 \\ \end{array}\right]}\) \(\newcommand{\mattwo}[4]{\left[\begin{array}{rr}#1 \amp #2 \\ #3 \amp #4 \\ \end{array}\right]}\) \(\newcommand{\laspan}[1]{\text{Span}\{#1\}}\) \(\newcommand{\bcal}{\cal B}\) \(\newcommand{\ccal}{\cal C}\) \(\newcommand{\scal}{\cal S}\) \(\newcommand{\wcal}{\cal W}\) \(\newcommand{\ecal}{\cal E}\) \(\newcommand{\coords}[2]{\left\{#1\right\}_{#2}}\) \(\newcommand{\gray}[1]{\color{gray}{#1}}\) \(\newcommand{\lgray}[1]{\color{lightgray}{#1}}\) \(\newcommand{\rank}{\operatorname{rank}}\) \(\newcommand{\row}{\text{Row}}\) \(\newcommand{\col}{\text{Col}}\) \(\renewcommand{\row}{\text{Row}}\) \(\newcommand{\nul}{\text{Nul}}\) \(\newcommand{\var}{\text{Var}}\) \(\newcommand{\corr}{\text{corr}}\) \(\newcommand{\len}[1]{\left|#1\right|}\) \(\newcommand{\bbar}{\overline{\bvec}}\) \(\newcommand{\bhat}{\widehat{\bvec}}\) \(\newcommand{\bperp}{\bvec^\perp}\) \(\newcommand{\xhat}{\widehat{\xvec}}\) \(\newcommand{\vhat}{\widehat{\vvec}}\) \(\newcommand{\uhat}{\widehat{\uvec}}\) \(\newcommand{\what}{\widehat{\wvec}}\) \(\newcommand{\Sighat}{\widehat{\Sigma}}\) \(\newcommand{\lt}{<}\) \(\newcommand{\gt}{>}\) \(\newcommand{\amp}{&}\) \(\definecolor{fillinmathshade}{gray}{0.9}\)- Students should develop an understanding of the similarities between electrophoretic methods.
- Students should develop an understanding of how Electroosmotic Flow and Electrophoretic Mobility effect retention time.
- Students should use CE data to complement data for gas or liquid chromatography.
- Students should know how the addition of a component affects partitioning.
Introduction
Electrophoresis is a class of separation techniques in which we separate analytes by their ability to move through a conductive medium in response to an applied electric field. This conductive medium is usually an aqueous buffer. Generally, when the electric field is applied, cations migrate toward the electric field’s negatively charged cathode. Anions migrate toward the positively charged anode and neutral species do not experience the electrical field and remain stationary. Ions with larger charge-to-size ratios—which favors ions of larger charge and of smaller size—migrate at a faster rate than ions with smaller charge-to-size ratios. High-Performance Liquid Chromatography (HPLC) or Gas Chromatography (GC) use liquid and gas respectively to force the sample through a column, but electrophoresis utilizes an electric field.
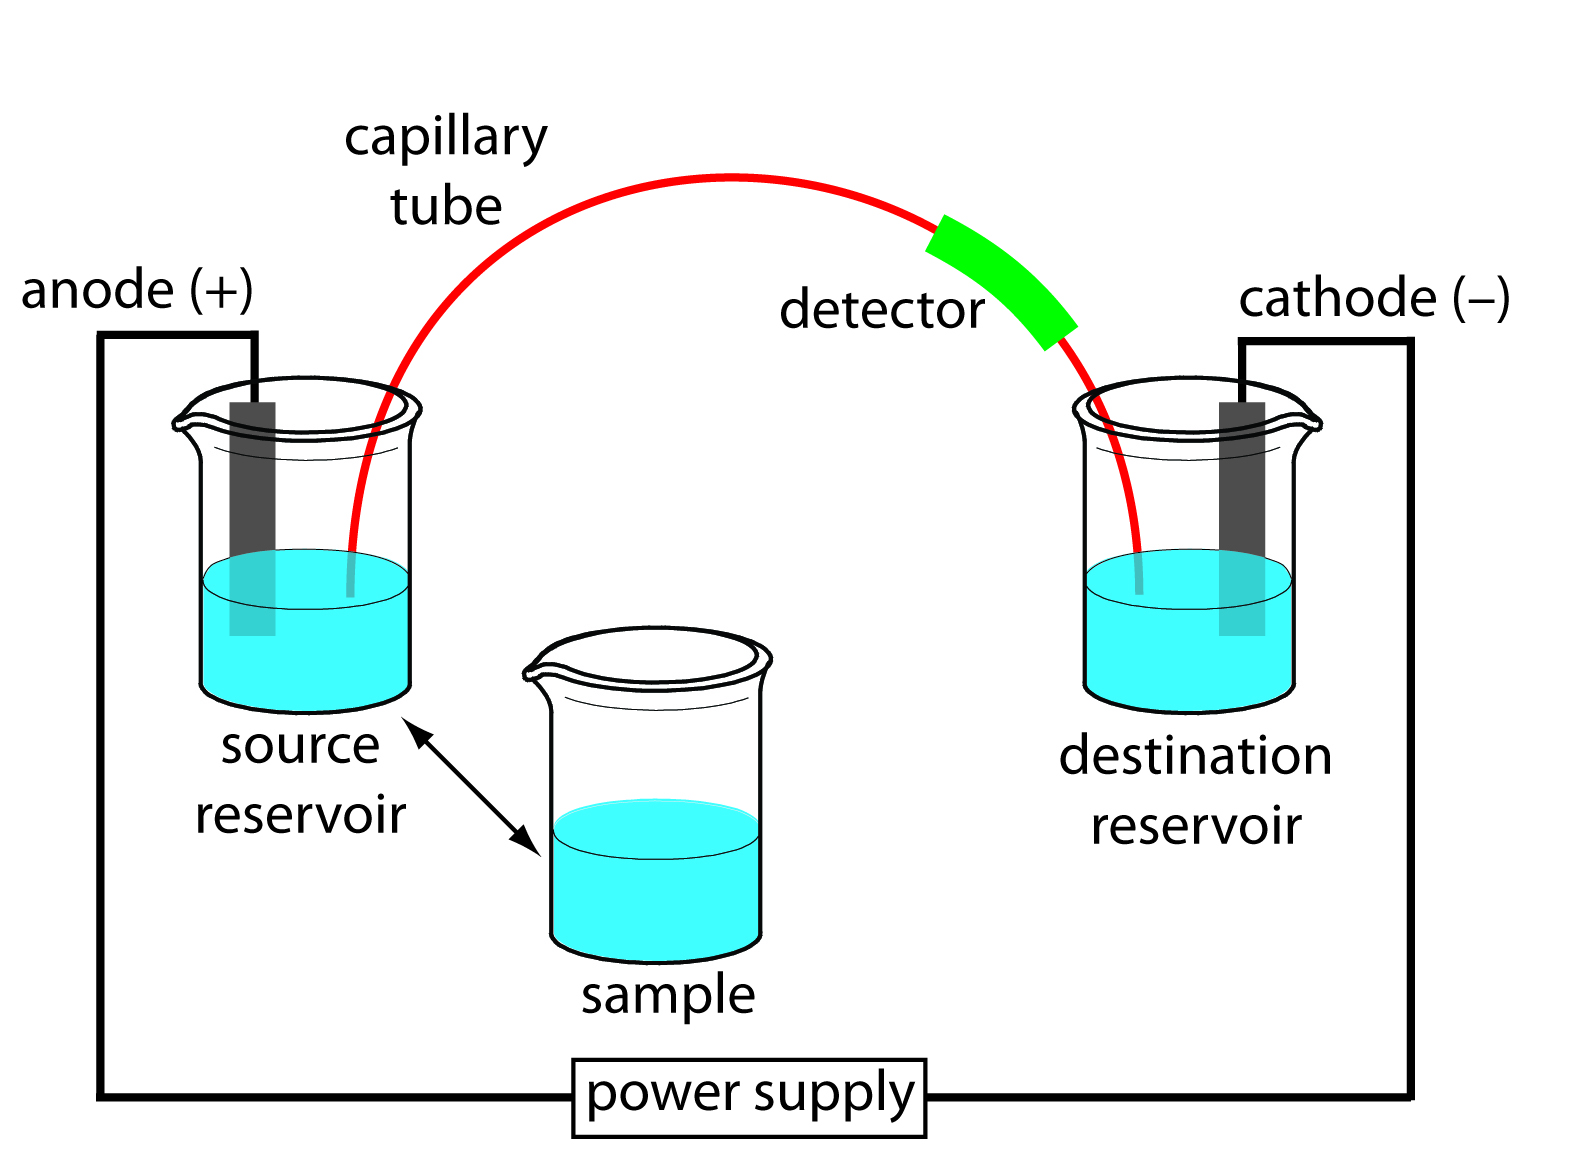
In capillary electrophoresis (CE), the conducting buffer is retained within a capillary tube whose inner diameter is typically 25–75 μm. Samples are introduced into one end of the capillary tube. As the sample migrates through the capillary its components separate and elute from the column at different times. When a component in the sample migrates at a lower rate, the component will be retained and will have a longer retention time. When a sample migrates at a faster rate, the retention time is shorter. Similar to HPLC and GC, the retention times can be used to identify components and determine the amount of component that was in the original sample. In capillary electrophoresis, the movement of ions through the capillary is defined by the ion’s electrophoretic mobility. A basic schematic of the instrument can be seen in Figure 6.1.
Electrophoretic Mobility
The electrophoretic mobility (µe) describes the ability of a component to migrate. The electrophoretic mobility (equation 6.1) of an object in an applied electric field is determined by the charge on the molecule divided by the frictional coefficient (f). Stokes' Law (Equation 6.2) gives the frictional coefficient of the molecule (f). This value is dependent on size and shape of the molecule as well as the viscosity of the solvent(η).
\[\mu_{e} = \dfrac{q}{6\pi\eta{r}} \label{6.1}\]
\[f=6\pi\eta{r}\]
The velocity of the particle in an applied field is described by equation 6.3. The variable E is the applied electric field. The velocity describes the rate at which the components are moving through the capillary.
\[\nu=\mu_eE\]
Gel Electrophoresis
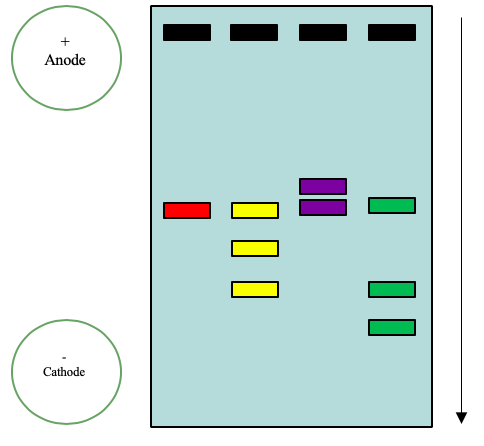
One of the most common forms of electrophoresis that students use is slab gel electrophoresis. In a slab gel, the conducting buffer is retained within a porous gel of agarose or polyacrylamide. Slabs are formed by pouring the gel between two glass plates separated by spacers. Typical thicknesses are 0.25–1 mm. Gel electrophoresis is an important technique in biochemistry where it is frequently used for separating DNA fragments and proteins. Although it is a powerful tool for the qualitative analysis of complex mixtures, it is less useful for quantitative work. Gel electrophoresis is commonly used in biochemistry to separate macromolecules, nucleic acids and proteins. Proteins and nucleic acid fragments are separated by differences in mobility through a sieving gel under the force of an applied electric field. An Example of a gel can be seen in Figure 6.2.
Capillary Zone Electrophoresis
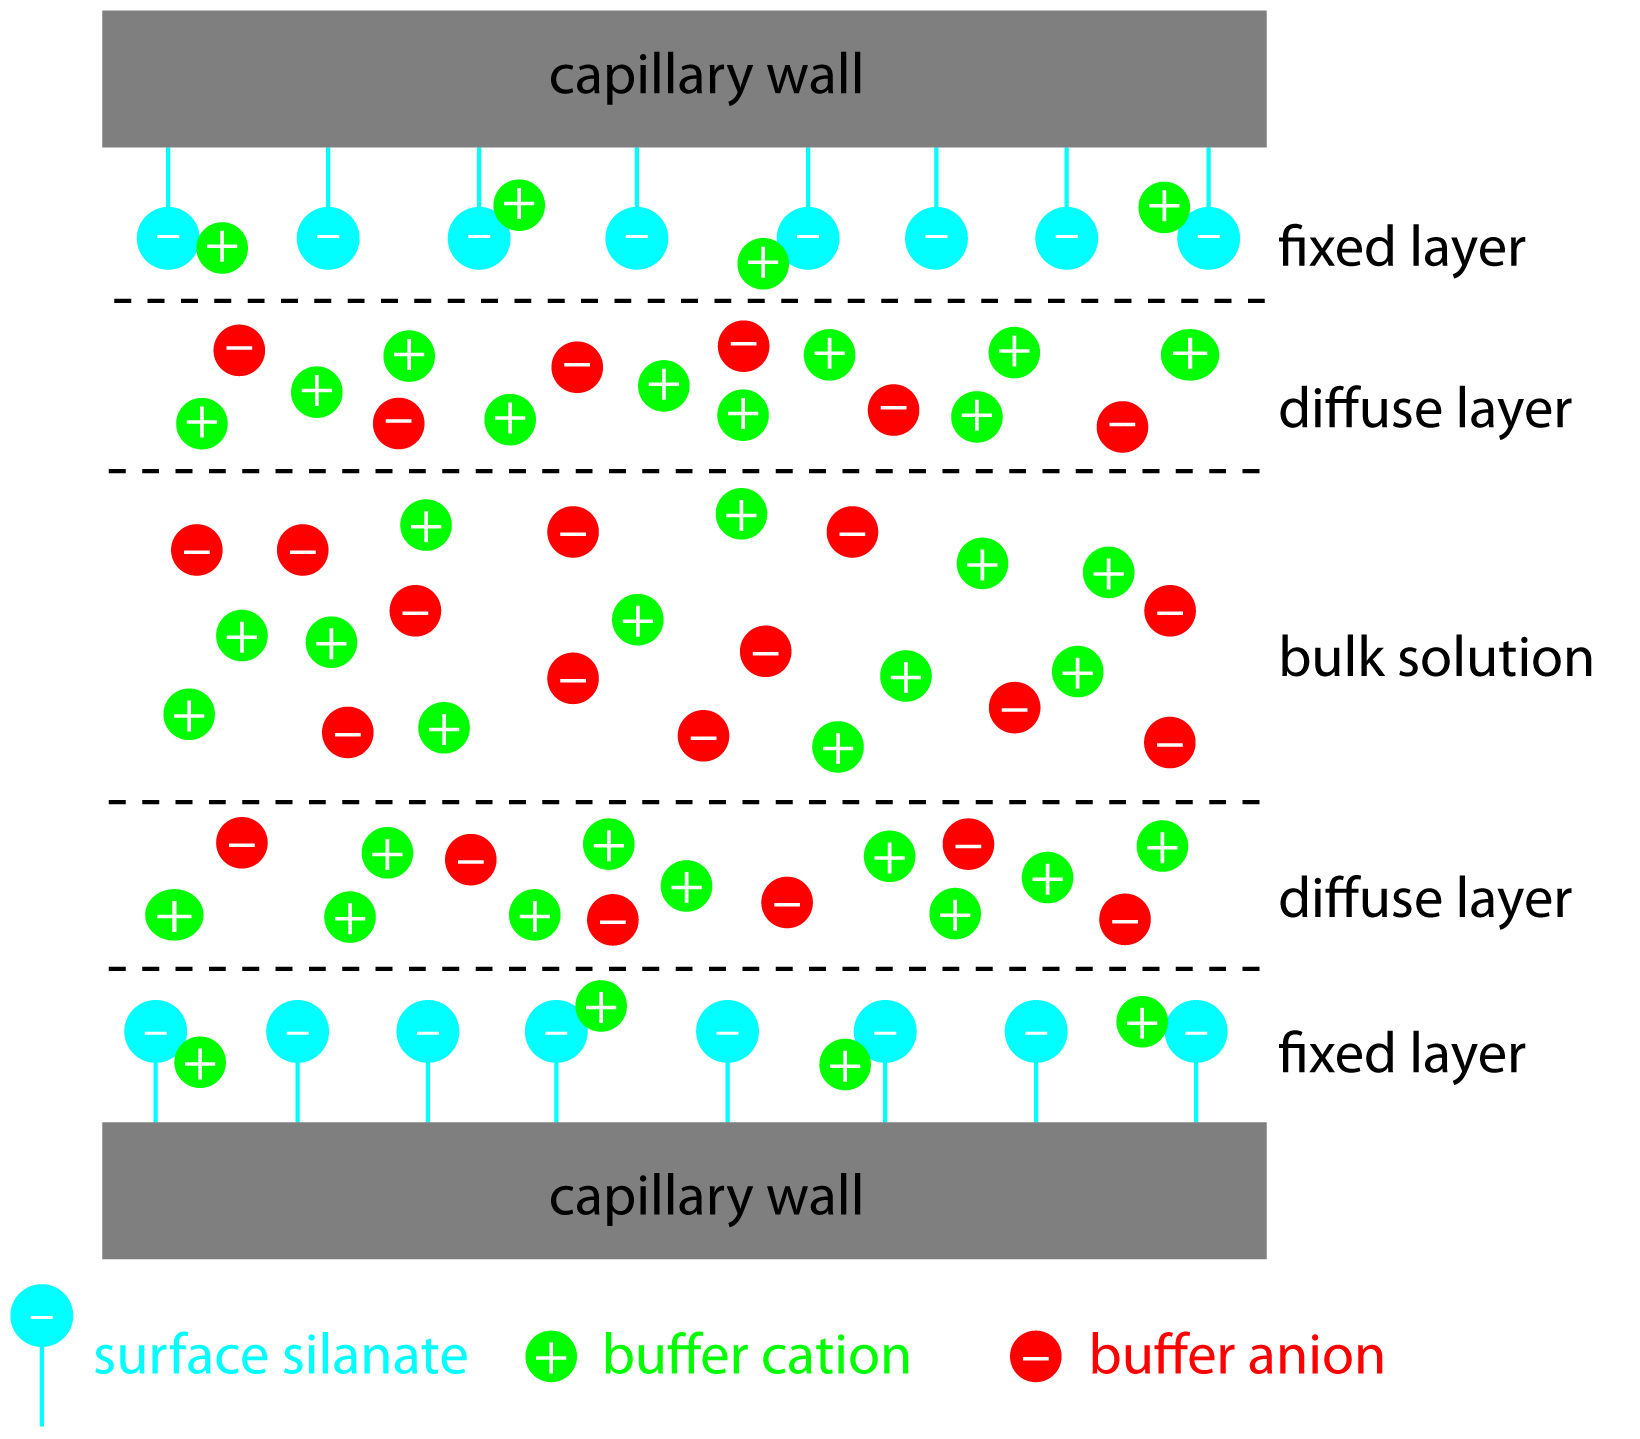
The simplest CE method is capillary zone electrophoresis (CZE), a method by which molecules, ions, or particles are separated solely by their electrophoretic mobility. This technique is based on the idea that the velocity is proportional to the charge to mass ratio. The capillaries are usually made of silica. In uncoated capillaries at pH greater than 3 the SiOH groups are ionized to SiO- (Figure 6.3). The deprotonation creates a negative charge along the capillary wall. This leads to a phenomenon called electroosmotic flow (EOF). The EOF is the overall movement of the sample from the anode to the cathode.
The negative charge on the capillary wall leads to the formation of a double layer of cations along the wall. The inner layer of cations is tightly bound to the capillary wall (cations directly bound to the oxygens of the SiO- group) and the outer layer is a diffuse layer of cations. A zeta potential forms at the boundary between the inner and outer layers of cations. When an electric field is applied, the cations in the diffuse layer move towards the cathode. The cations are more solvated than the anions and pull the bulk solvent towards the cathode. This movement defines the EOF. (Figure 6.4). The relative mobilities of the particles are the same, but now neutral molecules and negative particles are pulled toward the cathode by the EOF.
While the EOF is affecting all of the components in the sample, the cations have a faster velocity because they are attracted to the cathode, anions are unattracted to the cathode, and neutral molecules are neither attracted or unattracted. Neutral molecules will not be separated from one another. Negatively charged particles will be separated because the electrophoretic mobility counters the EOF. A solute’s total velocity (vtot) as it moves through the capillary is the sum of its electrophoretic velocity and the electroosmotic flow velocity. This concept is demonstrated in Figure 6.5. Cations elute first in an order corresponding to their electrophoretic mobilities, with small, highly charged cations eluting before larger cations of lower charge. Neutral species elute as a single band with an elution rate equal to the electroosmotic flow velocity. Finally, anions are the last components to elute, with smaller, highly charged anions having the longest elution time.
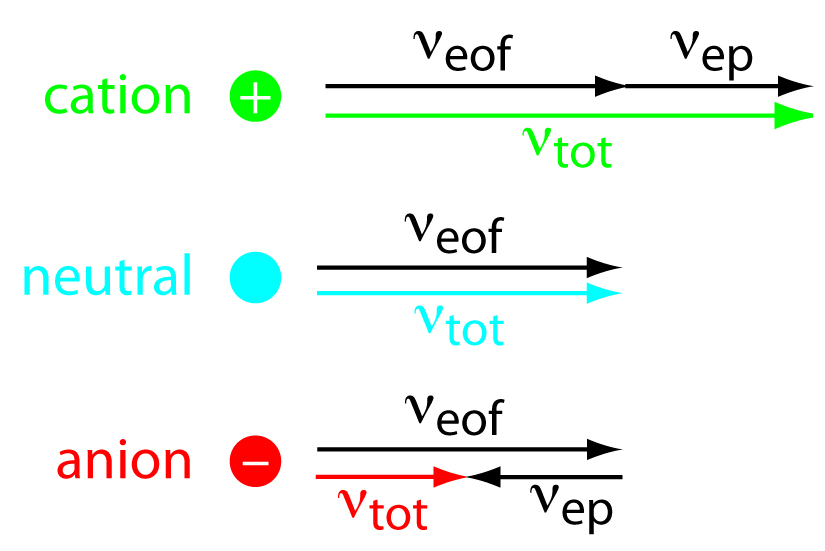
Figure 6.5 can also be described using the following equations:
\[ν_{tot} =ν_{ep} + ν_{eof}\]
\[(ν_{tot})_{cations} > ν_{eof}\]
\[(ν_{tot})_{neutrals} = ν_{eof}\]
\[(ν_{tot})_{anions} < ν_{eof}\]
The EOF is extremely useful for separating molecules with both positive and negative charges, but the EOF is not necessary. The EOF can be abolished by changing the buffer conditions. Using running buffer at very low pH will abolish the EOF. If low pH is a problem for the stability of the samples, the inside of the capillary can be coated with an uncharged layer. Low concentrations of ionic detergent, below the critical micelle concentration, will also diminish the EOF. There is no separation of molecules with similar charge to mass ratios. It is frequently desirable to improve or alter the separation. Molecules with similar electrophoretic mobilities can be separated by the addition of carrier compounds to the running buffer.
Micellar Electrokinetic Chromatography
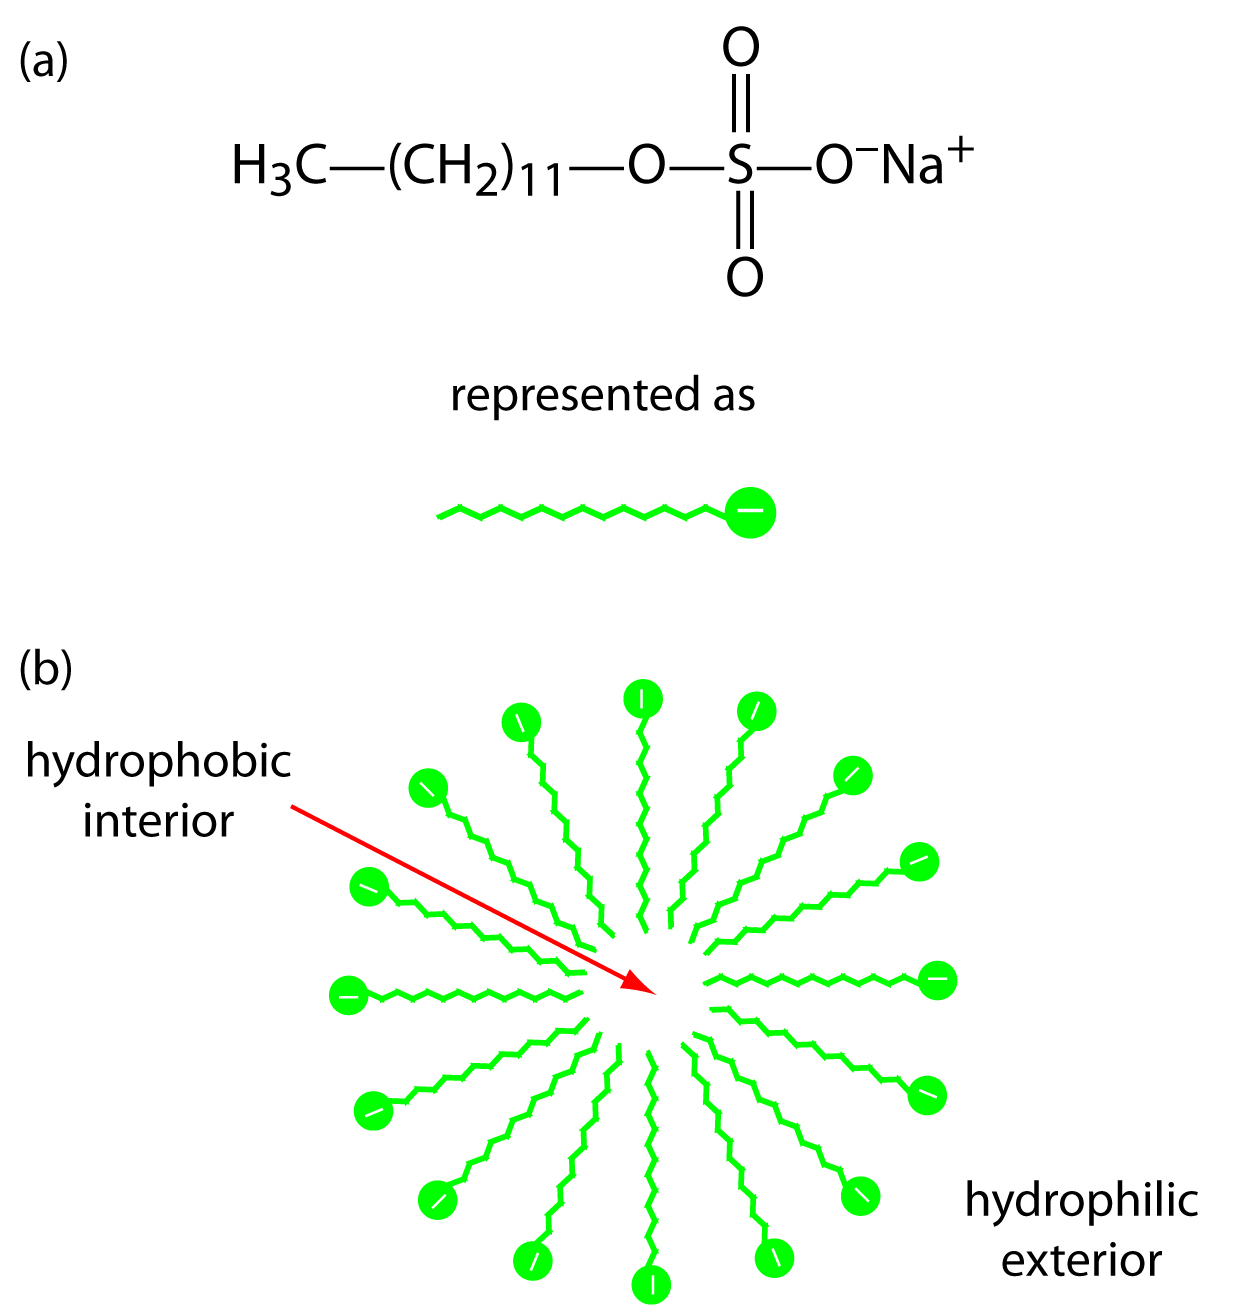
The addition of a new species to the running buffer will separate the molecules in the initial sample. This separation can occur based on the molecules’ affinities for the added species. For example, uncharged, nonpolar molecules can attract to neutral species, while charged species can attract to added ionic species. There are several different ways to perform this experiment based on the properties of the added species. The addition of cyclodextrins (or micelles) to the running buffer allows the separation of chiral species. This is described as MEKC, or Micellar Electrokinetic Chromatography. This technique can separate compounds (which had similar mobilities in CZE experiments) due to the difference in affinities of the sample molecules for detergent micelles.
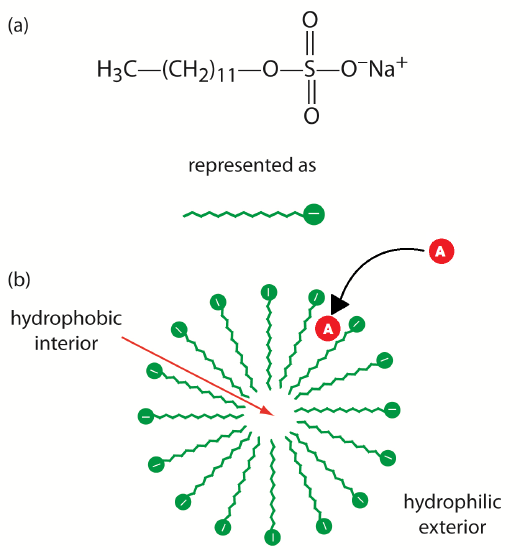
Neutral species will partition between the running buffer and the hydrophobic interior of the micelles. The micelles, which are negatively charged, have a retention time greater than the EOF. Thus, as molecules enter the micelles they are slowed down. The stronger an affinity the neutral species has for the micelle, the longer its retention time. The more nonpolar neutral species have the highest affinity for the micelles. Charged particles that have hydrophobic groups will also be retained by interaction with the hydrophobic core of the micelle. Highly positively charged particles will interact with the surface of the micelle and also be retained. These interactions can be seen in Figure 6.6. You can see that the separation of the species in the mixture will be changed by the addition of detergent to the running buffer. You can tailor your separation to exactly suit your needs by experimenting with different additions to the running buffer.
Instrumentation
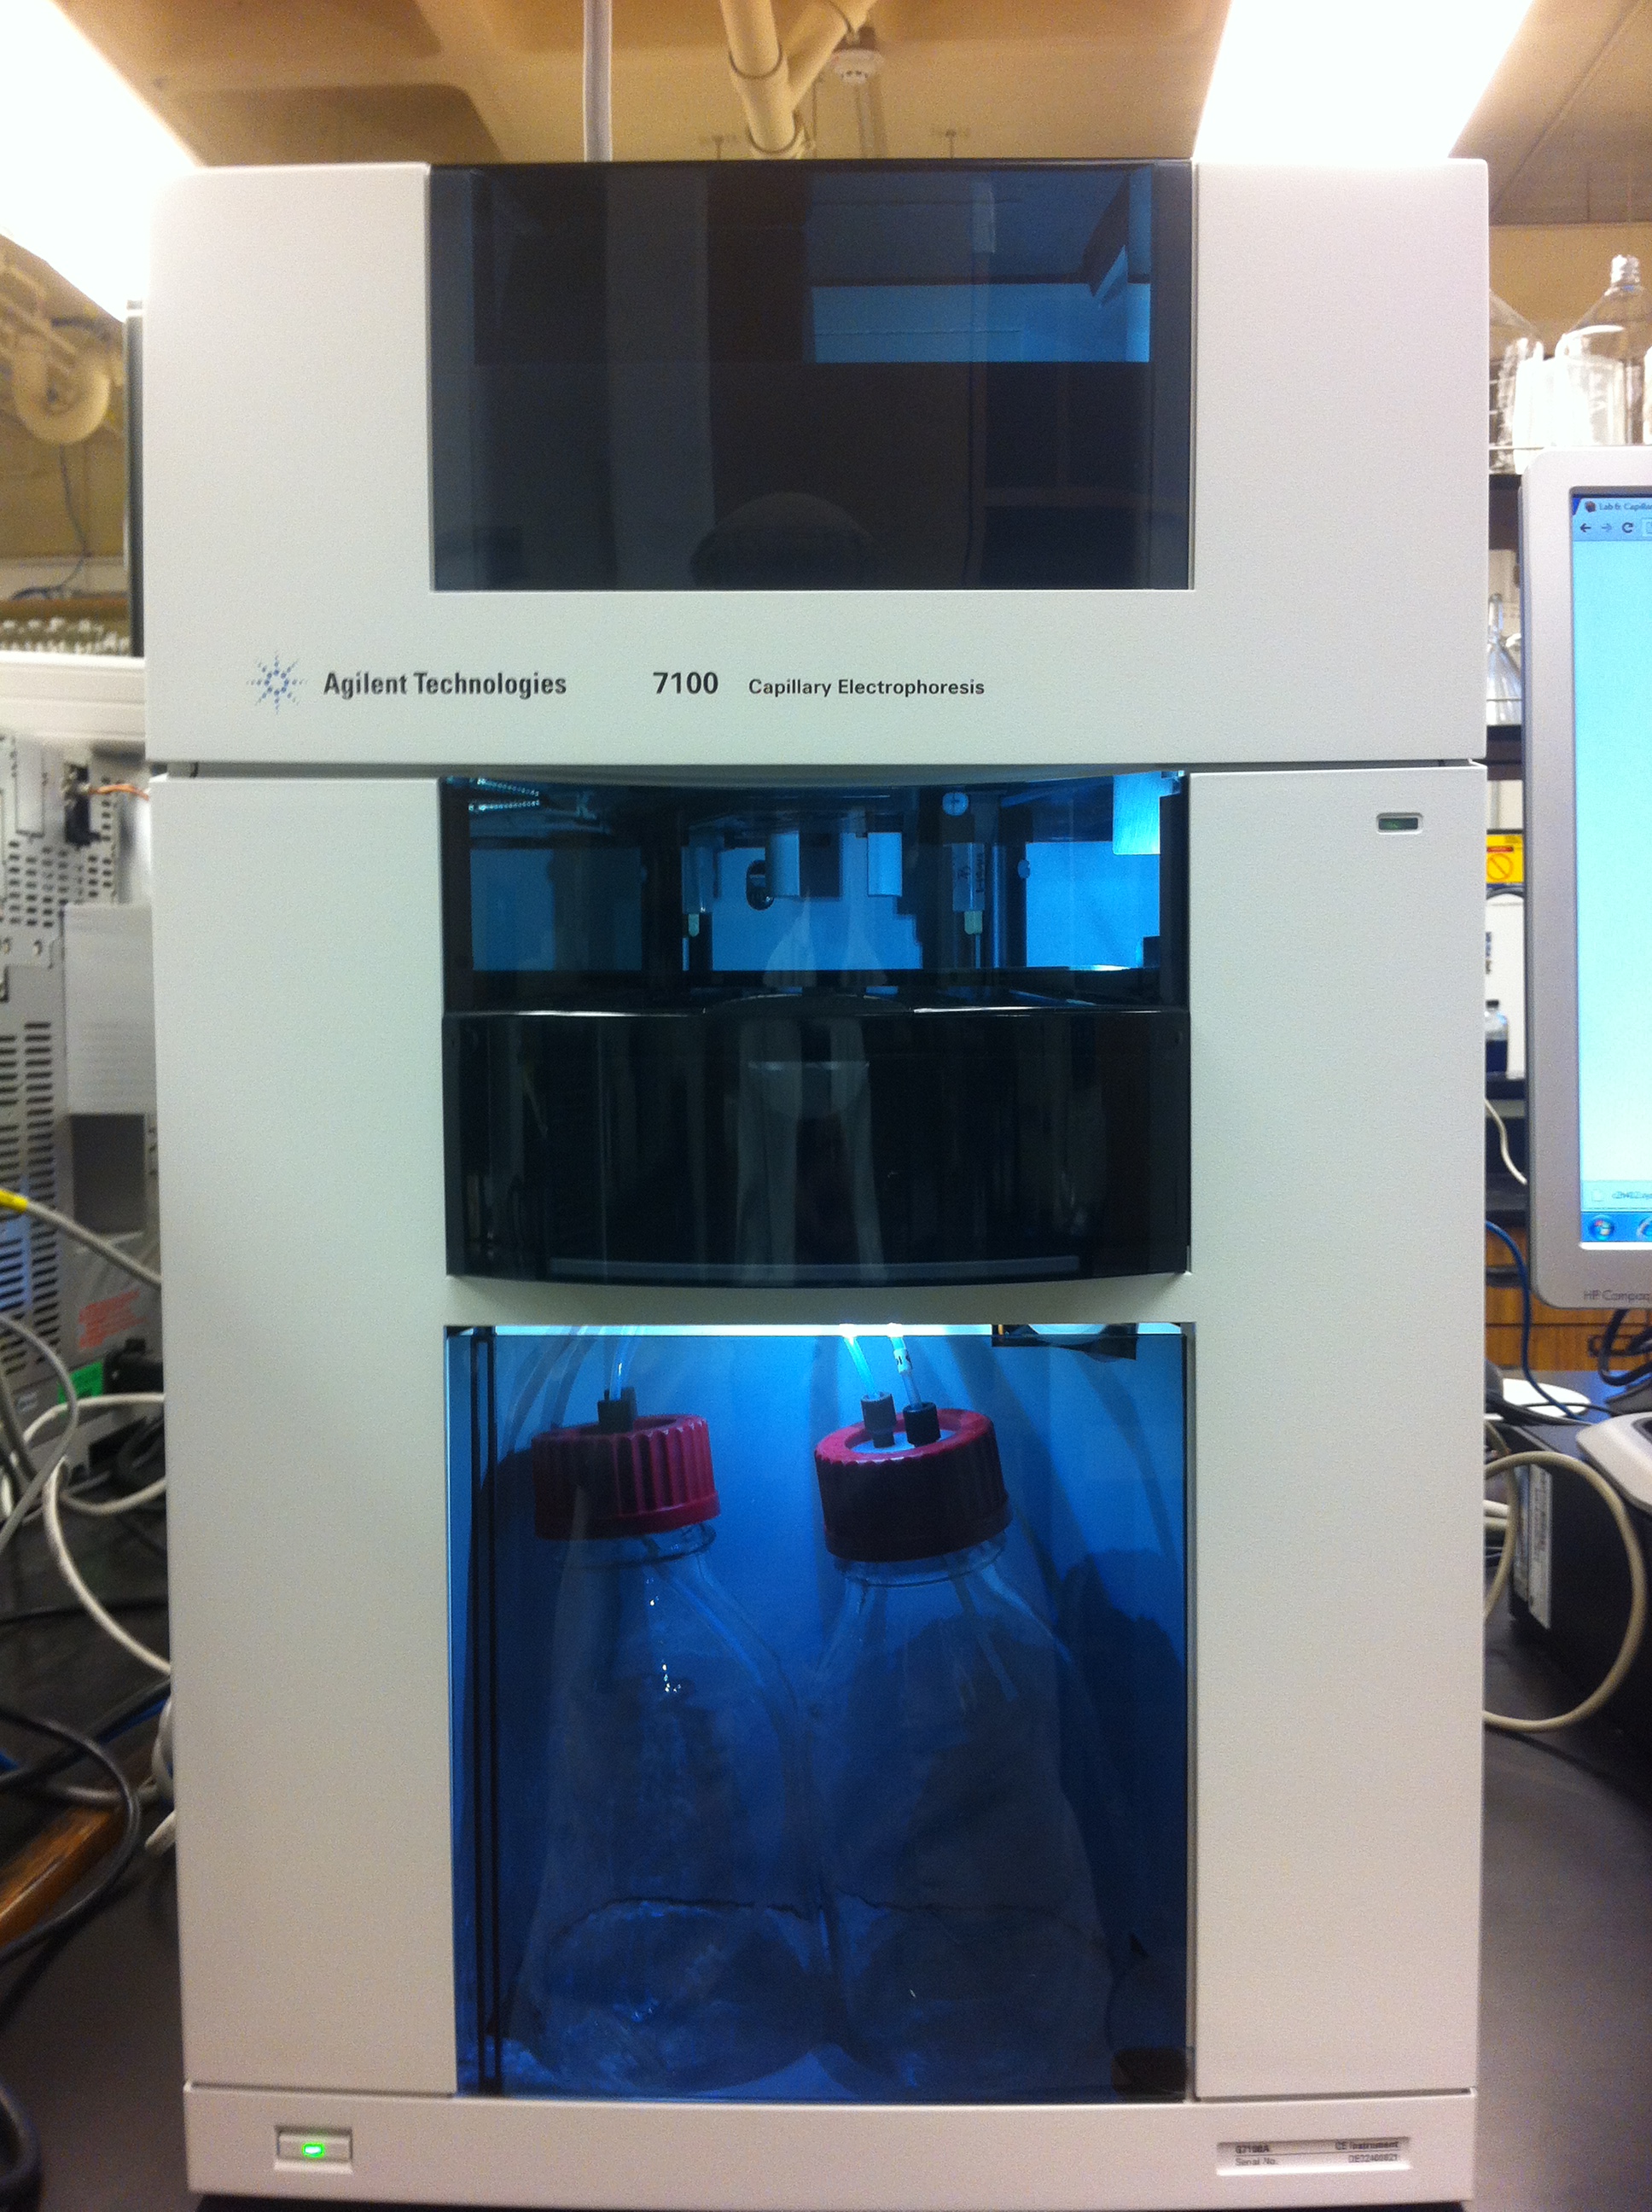
In this experiment, you will repeat the analysis you did (or will do) in the HPLC experiment. You will compare two different modes, Capillary Zone Electrophoresis (CZE) and Micellar Electrokinetic Capillary Chromatography (MEKC), to achieve the same separation. Differences in resolution and retention times will be observed and explained. Differences, if any, between the results obtained by HPLC and CE will also be addressed. The Instrument used can be seen in Figure 6.7

Experimental Procedure
Part 1: Preparing the Required Solutions
1. The solutions from Lab 2: High-Pressure Liquid Chromatography (HPLC) will be used. If you have already performed that lab, gather your samples. If your group has not performed Lab 2, refer to Part 3: Analysis of Caffeine Beverages in the Procedure section of Lab 2: HPLC.
2. Check the counter with the buffer solutions and identify two buffers that have already been prepared. The buffers are:
a. Solution A: 0.05 M borate buffer, pH=9.0.
b. Solution B: 0.05M Sodium dodecyl sulfate (SDS), 0.05 M borate buffer, pH=9.0.
3. Filter the stock caffeine solutions using the provided filter and syringe. Add approximately 10 mL into a labeled CE vial. DO NOT fill the vials more than 75%.
a. The filter and syringe can be reused if the solutions are filtered from low concentration to high concentration.
b. The syringes can be found in the plastic drawers near the door of the lab.
c. Filter approximately 1 mL and dispose of it into a waste beaker to wash the filter.
d. Filter the solution into the appropriate vial. (Figure 6.8) DO NOT put tape on the vials; ask your TA for a sharpie to write directly on the vials.
4. Filter the beverage samples into labeled vials using the same technique described in step 3.
5. Fill a labeled CE vial with filtered Solution A buffer and another labeled vial with filtered solution B buffer each about 75% full.

**DO NOT dispose of these samples if Lab 2: HPLC has NOT been performed; after completing Lab 2 AND Lab 6, the solutions can be disposed of.**
Part 2: Running a Capillary Zone Electrophoresis Experiment
1. Turn on the instrument (Agilent Technologies 7100 Capillary Electrophoresis Instrument), if it is not already on, by pressing the power button at the bottom left of the front face of the CE. The light in the middle of the button should be green when it’s on.
2. Open the Chemstation software if it’s not already on by double-clicking the "Instrument 2 Online" icon with an image of the CE. You will start in “Instrument View."
3. The instrument must first be initialized.
a. Click the "On" button next to the question mark button on the bottom right of the "CE" window.
b. Click on the power button icon in the top left corner of the "DAD" (diode array detector) window to "make device ready." Wait until the system goes to "Ready." This may take some time if the temperature-controlled zones need to stabilize.
4. Wait until the software goes to "Ready."
a. In the "CE" window, right-click "Inlet" and unload by selecting "Unload Inlet Lifter."
b. Do the same for the "Outlet." You should then hear the instrument lowering the vials in positions 1 and 2.
c. Right-click the sample wheel and select "Get Vial."
d. "Vial" should be set to "1" - click "Get."
e. The tray will rotate vial 1 to the front of the instrument.
f. Open the tray door and remove vials 1 and 2, if they are present.
5. Place the prepared 75% full Solution A vial in space number 1.
6. Fill a second vial 50 % full of Solution A and label this “Buffer A outlet.” Place this Vial is space number 2 in the sample wheel.
7. Close the tray door. The tray will rotate back to the operating position.
8. Make sure to use the features on the screen to insert Vial 1 as the inlet and Vial 2 as the outlet.
9. Right click on the regulator pressure icon in the "CE" window and click "Flush" on the menu. Enter a time of "600" seconds and click "OK". The pressure should increase to about 930 mBar and slowly decrease as liquid is pushed from one vial to the other during the flush time. This will wash out any residues from the previous runs and equilibrate the capillary with the running buffer.
10. Make sure that the method is "CAFFEINE.M" and that the sequence is "CAFFEINE.S."
a. The method and sequence names can be found in the drop-down boxes in the main menu bar.
b. Check and make sure the CZE method is using 20 kV by selecting "Method" then "Edit Entire Method". Check with your TA what the run time is for the current capillary.
c. Press "OK" in the first two windows that appear until you get to the "Setup Method" window.
d. Select the "CE" tab to check the voltage and run time under "Stop Time."
e. Check that under "Injection," on the right side of the "CE" tab window, there is one row that under "Function" has "Apply Pressure" and under "Parameter" it says "50mbar for 5s (Inlet: Injection Vial Outlet: Outlet Home Vial)." Click "OK".
f. "OK" through or cancel through the remaining windows.
11. Right click on the tray icon and select "Get Vial."
a. Set the "Vial" number to 7 and click "Get."
b. After the tray rotates to the correct position. open the tray door and put all your samples in.
c. Start at position 4 (leaving position 3 empty) with the 0.01 g/L standard followed by the rest of the standards in increasing concentration, then the three beverage samples. Make sure you keep track of the order in which the samples are run.
d. Close the tray door.
12. Review the sequence parameters.
a. On the menu bar, click "Sequence" and select "Sequence Parameters".
b. Enter an operator name, make sure "Prefix/Counter" is checked, and enter a prefix for your datafile names.
c. Click “OK.”
13. Run the sequence by clicking the “Sequence” Play button above the “DAD Window.”
14. After the sequence has started, watch the "Online Plot." You should see a peak for your first standard about 2-3 minutes into the run. The electrical current, which can be monitored in the "CE" window should be 15-16 microamperes.
15. You can print the reports after each sample is run.
a. When the entire sequence has completed, click "Data Analysis" at the bottom left of the window.
b. Click on "Chem_115" in the data tree and select your sequence.
c. Select the data you want and print.
d. Repeat for all your other data files.
e. A prompt to save each trial as a PDF will appear after each trial.
f. Create a file and save the trials to the file.
g. Print the PDFs.
16. When the sequence is complete, remove the inlet and outlet.
a. In the "CE" window, right-click "Inlet" and unload by selecting "Unload Inlet Lifter."
b. Do the same for the "Outlet." You should then hear the instrument lowering the vials in positions 1 and 2.
Make sure that you get a peak for each standard. You can always abort the run and restart it if there is a problem.
Part 3: Running a Micellar Electrokinetic Capillary Chromatography Experiment
1. Wait until the software goes to "Ready."
a. In the "CE" window, right-click "Inlet" and unload by selecting "Unload Inlet Lifter."
b. Do the same for the "Outlet." You should then hear the instrument lowering the vials in positions 1 and 2.
c. Right-click the sample wheel and select "Get Vial."
d. "Vial" should be set to "1" - click "Get."
e. The tray will rotate vial 1 to the front of the instrument.
f. Open the tray door and remove vials 1 and 2 from Part 2 of the experiment.
g. Place the prepared 75% full Solution B vial in space number 1.
h. Fill a second vial 50 % full of Solution B and label this “Buffer B outlet.” Place this Vial is the space number 2 in the sample wheel.
i. Close the tray door. The tray will rotate back to the operating position.
2. Make sure to use the features on the screen to insert Vial 1 as the inlet and Vial 2 as the outlet.
3. Right click on the regulator pressure icon in the "CE" window and click "Flush" on the menu. Enter a time of "300" seconds and click "OK."
4. Make sure that the method is "CAFFEINE_MEKC.M" and that the sequence is "CAFFEINE_MEKC.S."
a. The method and sequence names can be found in the drop-down boxes in the main menu bar.
b. Check and make sure the MEKC method is using 15 kV by selecting "Method" then "Edit Entire Method". Check with your TA what the run time is for the current capillary.
c. Press "OK" in the first two windows that appear until you get to the "Setup Method" window.
d. Select the "CE" tab to check the voltage and run time under "Stop Time."
5. The samples should already be in the correct position after the CZE experiment.
6. Run the sequence by clicking the “Sequence” Play button above the “DAD Window.”
7. You can print the reports after each sample is run.
a. When the entire sequence has completed, click "Data Analysis" at the bottom left of the window.
b. Click on "Chem_115" in the data tree and select your sequence.
c. Select the data you want and print.
d. Repeat for all your other data files.
e. A prompt to save each trial as a PDF will appear after each trial.
f. Create a file and save the trials to the file.
g. Print the PDFs.
8. When the sequence is complete, remove the inlet and outlet.
a. In the "CE" window, right-click "Inlet" and unload by selecting "Unload Inlet Lifter."
b. Do the same for the "Outlet." You should then hear the instrument lowering the vials in positions 1 and 2.
c. Right-click the sample wheel and select "Get Vial."
d. "Vial" should be set to approximate “4” - click "Get." (This will ensure that you can remove all of the vials from the CE)
e. The tray will rotate vial 4 to the front of the instrument.
f. Open the tray door and remove all of your vials.
g. Close the tray door.
Treatment of Data
1. Before completing the lab, confirm that you have peaks for each of your runs. If you notice any issues with your data, talk with your TA.
2. Create a calibration curve using the caffeine standard peak height or area versus the concentration. This can be done in Chemstation in the lab or at home in excel/google sheets.
a. To create a calibration curve in Chemstation, start by clicking the “data analysis” tab in the bottom left corner of the window. This will open and offline window.
b. Go to the CHE 115 file and find your data folder and select it.
c. Double click the first standard run in the sequence window.
d. Find the “Calibration” tab in the menu bar and select “New Calibration Table.”
e. A new window “Calibrate: HPLC1” will appear and select “Automatic setup.”
f. Set the “level” to 1 and put the concentration of the first run in the “Default Amount.” Press “OK.”
g. Double click the second run and go to the “Calibration” menu bar and click “Add Level.”
h. Set the “Level” to 2 and enter the second run’s concentration in the “Default Amount.” Press “OK.”
i. Repeat steps g and h for each of the remaining standard solutions.
j. The Calibration Table and the Calibration Curve can be viewed in the bottom of the window. Confirm that all the points are there.
3. If you cannot make a calibration curve in Chemstation or the curve did not use all of the points, use the data to develop a calibration curve in Excel or Google Sheets
Post-Lab Questions
**Include ALL Data Reports and Calibration Tables**
- Explain the difference in retention time for the two different experiments.
- What would you expect to happen to the retention time of the caffeine peak if you decreased the run voltage for the first experiment to 10 kV?
- Did you get the same answer for the two different CE experiments? Explain.
- Did you get the same answer as you did for the HPLC experiment? Is this surprising? If the answers are different, suggest some possible explanations. If you have not completed HPLC, you do not need to answer this question.
References
- Copper, C. L. Capillary Electrophoresis Part I. Theoretical and Experimental Background. J. Chem. Ed. 1998, 75, 343-347. pdf
- Copper, C. L.; Whitaker, K. W. Capillary Electrophoresis Part II. Applications. J. Chem Ed. 1998, 75, 347-351. pdf
- McDevitt, V. L.; Rodriguez, A.; Williams, K. R. Analysis of Soft Drinks: UV Spectrophotometry, Liquid Chromatography, and Capillary Electrophoresis. J. Chem. Ed. 1998, 75, 625-629. pdf
- Skoog, D. A.; Holler, F. J.; Nieman, T. A. Principles of Instrumental Analysis, Fifth Edition; Harcourt Brace: Philadelphia, 1998; 591-621.