
Lab 5: Gas Chromatography/Mass Spectrometry (GC/MS)
- Page ID
- 136268

\( \newcommand{\vecs}[1]{\overset { \scriptstyle \rightharpoonup} {\mathbf{#1}} } \)
\( \newcommand{\vecd}[1]{\overset{-\!-\!\rightharpoonup}{\vphantom{a}\smash {#1}}} \)
\( \newcommand{\dsum}{\displaystyle\sum\limits} \)
\( \newcommand{\dint}{\displaystyle\int\limits} \)
\( \newcommand{\dlim}{\displaystyle\lim\limits} \)
\( \newcommand{\id}{\mathrm{id}}\) \( \newcommand{\Span}{\mathrm{span}}\)
( \newcommand{\kernel}{\mathrm{null}\,}\) \( \newcommand{\range}{\mathrm{range}\,}\)
\( \newcommand{\RealPart}{\mathrm{Re}}\) \( \newcommand{\ImaginaryPart}{\mathrm{Im}}\)
\( \newcommand{\Argument}{\mathrm{Arg}}\) \( \newcommand{\norm}[1]{\| #1 \|}\)
\( \newcommand{\inner}[2]{\langle #1, #2 \rangle}\)
\( \newcommand{\Span}{\mathrm{span}}\)
\( \newcommand{\id}{\mathrm{id}}\)
\( \newcommand{\Span}{\mathrm{span}}\)
\( \newcommand{\kernel}{\mathrm{null}\,}\)
\( \newcommand{\range}{\mathrm{range}\,}\)
\( \newcommand{\RealPart}{\mathrm{Re}}\)
\( \newcommand{\ImaginaryPart}{\mathrm{Im}}\)
\( \newcommand{\Argument}{\mathrm{Arg}}\)
\( \newcommand{\norm}[1]{\| #1 \|}\)
\( \newcommand{\inner}[2]{\langle #1, #2 \rangle}\)
\( \newcommand{\Span}{\mathrm{span}}\) \( \newcommand{\AA}{\unicode[.8,0]{x212B}}\)
\( \newcommand{\vectorA}[1]{\vec{#1}} % arrow\)
\( \newcommand{\vectorAt}[1]{\vec{\text{#1}}} % arrow\)
\( \newcommand{\vectorB}[1]{\overset { \scriptstyle \rightharpoonup} {\mathbf{#1}} } \)
\( \newcommand{\vectorC}[1]{\textbf{#1}} \)
\( \newcommand{\vectorD}[1]{\overrightarrow{#1}} \)
\( \newcommand{\vectorDt}[1]{\overrightarrow{\text{#1}}} \)
\( \newcommand{\vectE}[1]{\overset{-\!-\!\rightharpoonup}{\vphantom{a}\smash{\mathbf {#1}}}} \)
\( \newcommand{\vecs}[1]{\overset { \scriptstyle \rightharpoonup} {\mathbf{#1}} } \)
\(\newcommand{\longvect}{\overrightarrow}\)
\( \newcommand{\vecd}[1]{\overset{-\!-\!\rightharpoonup}{\vphantom{a}\smash {#1}}} \)
\(\newcommand{\avec}{\mathbf a}\) \(\newcommand{\bvec}{\mathbf b}\) \(\newcommand{\cvec}{\mathbf c}\) \(\newcommand{\dvec}{\mathbf d}\) \(\newcommand{\dtil}{\widetilde{\mathbf d}}\) \(\newcommand{\evec}{\mathbf e}\) \(\newcommand{\fvec}{\mathbf f}\) \(\newcommand{\nvec}{\mathbf n}\) \(\newcommand{\pvec}{\mathbf p}\) \(\newcommand{\qvec}{\mathbf q}\) \(\newcommand{\svec}{\mathbf s}\) \(\newcommand{\tvec}{\mathbf t}\) \(\newcommand{\uvec}{\mathbf u}\) \(\newcommand{\vvec}{\mathbf v}\) \(\newcommand{\wvec}{\mathbf w}\) \(\newcommand{\xvec}{\mathbf x}\) \(\newcommand{\yvec}{\mathbf y}\) \(\newcommand{\zvec}{\mathbf z}\) \(\newcommand{\rvec}{\mathbf r}\) \(\newcommand{\mvec}{\mathbf m}\) \(\newcommand{\zerovec}{\mathbf 0}\) \(\newcommand{\onevec}{\mathbf 1}\) \(\newcommand{\real}{\mathbb R}\) \(\newcommand{\twovec}[2]{\left[\begin{array}{r}#1 \\ #2 \end{array}\right]}\) \(\newcommand{\ctwovec}[2]{\left[\begin{array}{c}#1 \\ #2 \end{array}\right]}\) \(\newcommand{\threevec}[3]{\left[\begin{array}{r}#1 \\ #2 \\ #3 \end{array}\right]}\) \(\newcommand{\cthreevec}[3]{\left[\begin{array}{c}#1 \\ #2 \\ #3 \end{array}\right]}\) \(\newcommand{\fourvec}[4]{\left[\begin{array}{r}#1 \\ #2 \\ #3 \\ #4 \end{array}\right]}\) \(\newcommand{\cfourvec}[4]{\left[\begin{array}{c}#1 \\ #2 \\ #3 \\ #4 \end{array}\right]}\) \(\newcommand{\fivevec}[5]{\left[\begin{array}{r}#1 \\ #2 \\ #3 \\ #4 \\ #5 \\ \end{array}\right]}\) \(\newcommand{\cfivevec}[5]{\left[\begin{array}{c}#1 \\ #2 \\ #3 \\ #4 \\ #5 \\ \end{array}\right]}\) \(\newcommand{\mattwo}[4]{\left[\begin{array}{rr}#1 \amp #2 \\ #3 \amp #4 \\ \end{array}\right]}\) \(\newcommand{\laspan}[1]{\text{Span}\{#1\}}\) \(\newcommand{\bcal}{\cal B}\) \(\newcommand{\ccal}{\cal C}\) \(\newcommand{\scal}{\cal S}\) \(\newcommand{\wcal}{\cal W}\) \(\newcommand{\ecal}{\cal E}\) \(\newcommand{\coords}[2]{\left\{#1\right\}_{#2}}\) \(\newcommand{\gray}[1]{\color{gray}{#1}}\) \(\newcommand{\lgray}[1]{\color{lightgray}{#1}}\) \(\newcommand{\rank}{\operatorname{rank}}\) \(\newcommand{\row}{\text{Row}}\) \(\newcommand{\col}{\text{Col}}\) \(\renewcommand{\row}{\text{Row}}\) \(\newcommand{\nul}{\text{Nul}}\) \(\newcommand{\var}{\text{Var}}\) \(\newcommand{\corr}{\text{corr}}\) \(\newcommand{\len}[1]{\left|#1\right|}\) \(\newcommand{\bbar}{\overline{\bvec}}\) \(\newcommand{\bhat}{\widehat{\bvec}}\) \(\newcommand{\bperp}{\bvec^\perp}\) \(\newcommand{\xhat}{\widehat{\xvec}}\) \(\newcommand{\vhat}{\widehat{\vvec}}\) \(\newcommand{\uhat}{\widehat{\uvec}}\) \(\newcommand{\what}{\widehat{\wvec}}\) \(\newcommand{\Sighat}{\widehat{\Sigma}}\) \(\newcommand{\lt}{<}\) \(\newcommand{\gt}{>}\) \(\newcommand{\amp}{&}\) \(\definecolor{fillinmathshade}{gray}{0.9}\)- Students should develop an understanding of gas-liquid partitioning.
- Students should gain the skill of using the mass spectra data library to determine the components in a mixture.
Introduction
Similar to the CHE 105, you will be responsible for separating the components of a mixture by comparing the results to standard solutions. This lab has an added challenge of first identifying what the contents of those standards are before being drawing conclusions about the mixtures. The analysis of different unknown mixtures will be performed via high resolution capillary gas chromatography (GC) coupled with an ion trap detector (ITD). The ITD is a variation of a quadrupole mass spectrometer and is designed to function specifically as a GC detector. Due to the design variances of the ITD compared to a true quadrupole mass spectrometer, the ITD mass spectrum of an organic compound may not be identical (but should be very similar) to its classical mass spectrum measured by an electron impact (EI) detector. These classical spectra are used in the National Bureau of Standards library of mass spectra for comparison differences. In this lab, the ITD spectrum you measure of the unknown will be compared to the EI spectra of several different classes of compounds found in the library. Thus, the characteristic features of a mass spectrum for a given class may be recognized, and the chemical structure determined. The NIST 2005 library, which is a software feature of the GC/MS data acquisition system, will be utilized to confirm the identification of the components of the unknown.
Gas chromatography is a physical method of separation in which the components to be separated are distributed between two phases, one being a stationary bed of large surface area, and the other a gas that percolates through the stationary bed. When the stationary phase is a solid, the separation process is more precisely called gas-solid chromatography. This technique is generally used to separate volatile compounds in a gaseous solution. The more common technique (which will be used in this experiment) is gas-liquid chromatography (GLC) in which the stationary phase is a porous solid covered with an absorbing liquid. GLC is used to separate a wide variety of organic compounds. The basic requirements for GLC are that the sample be volatile and that it does not decompose in the vaporization process. Since the vaporization occurs in an inert atmosphere, decomposition of the sample is generally not a problem.
Separation of a mixture into its components depends on the solubility differences of the sample vapor in a liquid (the stationary phase). The stationary phase is coated in a thin layer on solid particles (solid support) of large surface area and then packed uniformly into a column. A constant flow of the carrier gas passes through the column and transports solute molecules in the gas phase. The column is wound to fit inside an oven for precise temperature control.
A sample of the analyte is introduced by syringe injection into the heated injector tube, where it is vaporized and mixed with a carrier gas. As the sample vapor is carried through the column by the carrier gas, the analyte partitions between the gas and liquid phases according to the analyte components' solubility in the liquid at the column operating temperature. This equilibrium partitioning continues as the sample is moved through the column by the carrier gas. The rate at which the sample travels through the column is determined by the sample solubility in the stationary phase, the carrier gas flow rate, and the temperature. Each component travels at a characteristic rate, and if the column has sufficient length and resolving power, the sample will be completely separated by the time it reaches the detector.
The detector located at the column exit is the ITD mass spectrometer. It records the total number of ions entering the mass analyzer from the column. The chromatogram produced is called the total ion chromatogram. Each point in the chromatogram is a mass spectrum.
Each component is identified by comparing its "retention time", the length of time that it remains in the column, to that of a standard. The retention time of a vapor depends on the column temperature limits and ramp rate, the column length, type of stationary phase, and carrier gas velocity. If these variables are kept constant, the retention time of a component may be tentatively identified by comparison to the retention time of a known standard run under identical operating conditions.
If the response of the detector is linear, the area under a peak accurately represents the quantity of the component present. If it is not, calibration for detector response to the types of components expected to be in the analyte yields a set of response factors which convert the reported area percentages to quantitative weight percentages.
For a given gas chromatography column, the van Deemter theory is useful for determining the flow rate, which gives optimum efficiency at a given column temperature for a particular compound. The van Deemter equation is:
\[HETP = A + \frac{B}{v} + Cv \tag{5.1}\]
where A, B, and C are constants and v is the carrier gas flow rate. HETP is the "height equivalent to a theoretical plate," and results from the treatment of gas chromatographic separations in terms of repeated equilibrations between a moving and a stationary phase. HETP is calculated in equation 5.2 for a particular gas flow rate. It is calculated from the total number of theoretical plates (N) and column length (L).
\[HETP = \dfrac{L}{N} \tag{5.2}\]
Where,
\[N = 16 \left[\dfrac{t_R}{w} \right]^2 \tag{5.3}\]
The retention of the component is tR and w is the width of the elution peak at its base. The first term in the van Deemter equation accounts for eddy diffusion, the second term accounts for molecular diffusion, and the third term accounts for non-equilibrium effects due to flow of the mobile phase. For a particular column at a constant temperature, the optimum carrier gas flow rate is that for which the HETP is a minimum. By measuring the HETP at several linear gas velocities (flow rates), the parameters A, B, and C in eq. (1) can be determined and the optimum velocity defined.
If the sample contains materials with a wide range of boiling points, separation of all components isothermally is not practical. When the column is operated at low temperatures, the more volatile components will be distributed between the gas and liquid phases and will pass rapidly through the column, giving sharp, well-resolved peaks. The high-boiling components, however, will remain dissolved in the stationary phase and will be eluted very slowly, if at all. Since the vapor pressure of the latter solutes is low, partitioning will occur over broad bands of stationary phase, resulting in broad, poorly resolved peaks.
If the column is operated at a temperature which gives well-defined peaks for the less volatile components, the low boiling fraction will pass through the column with very little partitioning into the liquid phase. As a result, it will appear as one or two sharp, poorly resolved peaks, often with retention volumes approaching the dead space of the column.
By utilizing temperature programming, all the compounds can be eluted at temperatures approximating the ideal temperature for separation from adjacent solutes. By employing a low initial temperature, the low boiling components will be distributed between both phases in the column and will appear at the detector as sharp, well-resolved bands. The higher boiling fractions will remain 'frozen' at the injection point. As the column temperature is raised, the vapor pressure of the less volatile components increases and they distribute themselves between the two phases. As a result, they move down as well-defined bands, eluting at characteristic temperatures. By careful choice of the temperature ramp rate and carrier gas flow rate, each component can be eluted at a temperature approximating the optimum for separation from adjacent solutes. Although the resolution of closely spaced peaks cannot be improved over that at a single optimum temperature, the resolution of widely spaced peaks can be improved considerably.
Gas Chromatography / Mass Spectrometry
The experiment concerns the actual identification of an unknown using GC/MS. The system you will be using is menu driven. Your TA will show you how to set up a file and acquire data.
The power of the GC/MS technique comes from the fact that not only are components of a mixture separated and detected quantitatively, but the detector (the ITD) also provides information concerning the structure of each of the components. Therefore, compounds can be identified not only by comparing the retention time to a standard, as in conventional GC but also by its mass spectrum. An unknown can also be identified in most cases based solely on its mass spectrum, eliminating the need to run standards for retention time data. Therefore, it is not necessary to know what you are looking for, as in the case of GC.
The chromatography for GC and GC/MS is identical in theory. However, the column used in the GC/MS experiment is a capillary column as opposed to the packed column used in the GC experiment done in Chemistry 105. A capillary column is simply a long tube made of glass with a small internal diameter. For this experiment, a 30 cm column with an internal diameter of 0.25 mm is used. The stationary phase is actually bonded to the interior of the glass capillary, eliminating the need for packing a solid support in the column. Different columns may have bonded phases of different characteristics depending on the type of separation to be carried out.
After the components of a mixture are separated in the column, they reach the ion trap detector as pure compounds (if the separation was successful). The compounds are ionized by electron impact (EI) by passing the stream of gas over a beam of electrons accelerated to an energy of 70 eV. This energy is used to form ions by stripping away an electron and may break some of the bonds of the compound. Differing populations of the ions will have differing amounts of internal energy. Some of the molecules will become ionized but will not fragment, forming a "parent ion". A parent ion, or molecular ion, has the same mass in atomic mass units as the neutral molecule (it differs by only the mass of an electron). It is the highest mass peak in the spectrum. Many of the ions formed may have sufficient internal energy to fragment, forming a smaller mass ion and a neutral. (The neutrals formed are not detected. Only ions are detected). By using the same energy electrons to ionize the compounds, the resulting mass spectra are highly reproducible, not only on a given instrument but on other instruments using 70 eV electron impact ionization. In this way, libraries of mass spectral data have been generated, so that an unknown can be identified by searching through and matching the mass spectra.
Different classes of compounds have some fragmentation characteristics that can be used to help identify unknown compounds. For example, compounds with many strong bonds, such as aromatic compounds, may be less likely to fragment. These compounds are characterized by mass spectra which are dominated by a single peak, the molecular ion. Straight chain hydrocarbons, however, fragment much more easily and may show little or no abundance of the molecular ion in their mass spectra. Attached to this manual is a reference describing characteristic fragmentations of various classes of compounds. An excellent reference that describes the fragmentation of classes of compounds is "Interpretation of Mass Spectra" by Fred McLafferty. Another is "Spectrometric Identification of Organic Compounds", by Silverstein, Bassler and Morrill. You should use these references, along with your text, to help explain the mass spectra of your unknown compound(s).
Instrumentation
A basic chromatography instrument consists of the following:
- A sample port or injector for introduction and vaporization of the sample;
- A separating column, consisting of metal tubing packed with a solid material coated with a stationary absorbing liquid;
- A carrier gas, usually N2 or He, to sweep the sample through the column;
- Flow control equipment to maintain a constant flow of carrier gas through the column;
- The detector for measuring the quantity of a separated component;
- Ovens and heaters for temperature control of the column, detector, and injector;
- An integrator or integrator/strip chart recorder combination to provide a permanent record of the analysis.
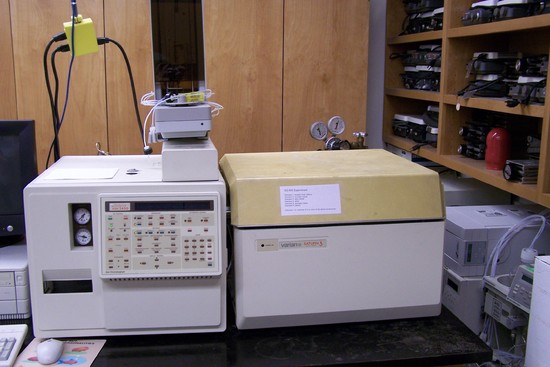
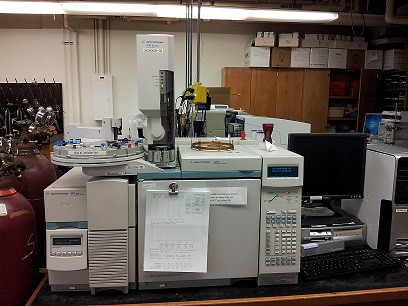
The instrument used in this experiment is an Agilent 6890N GC/MS (low-resolution mass spectrometer) pictured in Figure 5.2. The mass spectrometer and GC are controlled by Chemstation software on the computer. This instrument can be found in room 3475.
.jpg?revision=1&size=bestfit&width=333&height=250)
.jpg?revision=1)
Experimental Procedure
No sample preparation is required for this experiment. You will be provided with 6 standards.
- Standard 1: straight alkane
- Standard 2: aromatic halide
- Standard 3: alkyl halide
- Standard 4: aromatic ether
- Standard 5: aromatic halide
- Standard 6: alkane
You will also be provided with three unknowns that are mixtures of two or more of the above compounds. You will be required to identify the unknowns provided based on both the mass spectra and retention times of the peaks.
6890N GCMS Operation Procedures
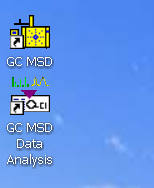
- Enter the console and locate the GC/MSD icon located in the upper left corner of the desktop. Open the GC/MSD by clicking on the icon (Figure 5.3) if Chemstation is not already running.
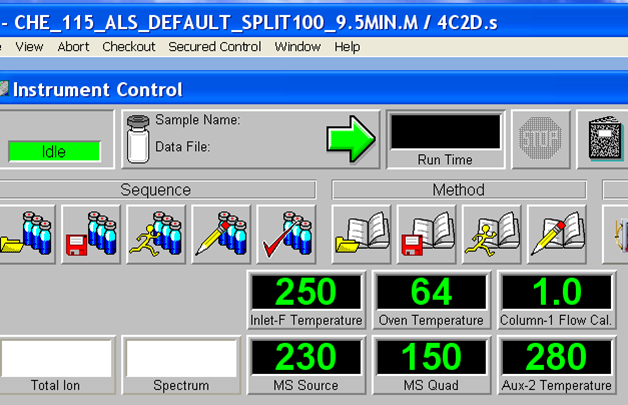
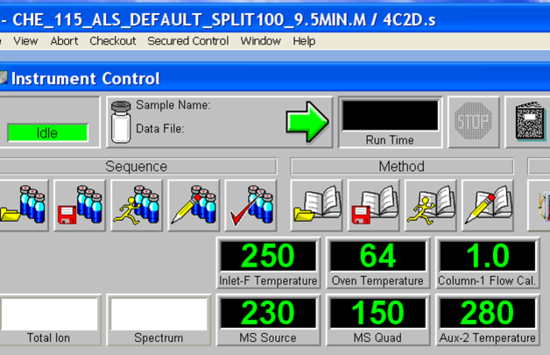
- Allow a few minutes for the software to initialize. The green bar along the bottom of the Chemstation window indicates action completion. When prompted, Click OK to confirm firmware configuration. Once the software initialization is complete, the green action bar will read “Welcome to the Enhanced Agilent MSD Chemstation”. The next step is to load the desired method if it is not already loaded by accessing the method tab. The methods are found following the tree from D: drive > MSDCHEM > 1 >Methods. Load CHE_115_ALS_Default_Split100_9.5MIN.M. The currently loaded method is displayed in the blue bar across the top of the Chemstation window. For example, the method “CHE_115_ALS_Default_Split100_9.5MIN.M” is loaded as seen in Figure 5.4. Choose your method and load, loading takes a few minutes. The green action bar will confirm when the method loading is complete. Have your TA check the method to make sure students did not save changes to it accidentally.
- Make sure the ALS tower is in place. Check the liquid level in your vial standards, they should contain at least half full.
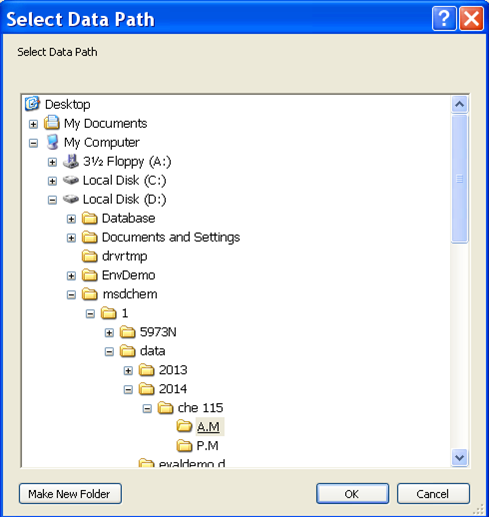
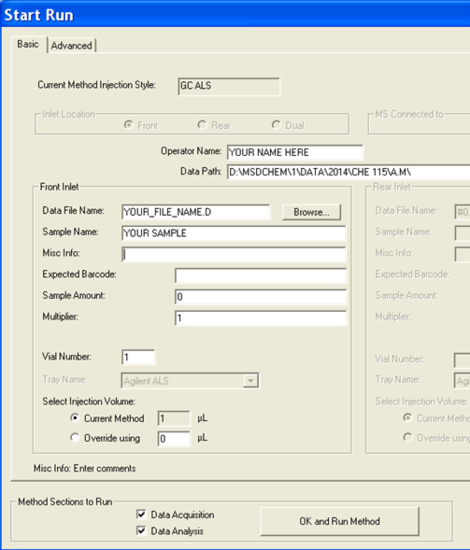
- Now it is time to set up the analysis by clicking on the green arrow. A new window will open up (Figure 5.5). First, set the user (or the group) name. Next, set your data pathway by following the tree from D: drive > MSDCHEM > 1 > DATA > 2014 > CHE 115 > the appropriate folder (Figure 5.6). Name your file making sure to retain the “.D” suffix. The recommended file naming format is using the date and underscores such as “2014.01.02_standard1”. Add the other information: user, sample name, info. It is imperative that you enter the correct Vial #. Standard 1 is in position 1, 2 in 2... Unknown (UK) 1 is in position 10, UK2 in 15, UK3 in 20.
- Click “OK and Run Method” and the GC/MS will begin the automation.

- Once the run begins, you will be prompted to override the solvent delay. NEVER OVERRIDE THE SOLVENT DELAY, doing so will drastically shorten the lifetime of the filaments inside the Mass Spec, potentially render the instrument inoperable, and likely result in increased chemistry laboratory fees.
- As your run progresses and the approximate 3-minute solvent delay has passed, you should see peaks appear in the smaller subwindows. It is possible to begin data analysis by taking a snapshot in the data analysis program. If not already open, launch the Enhanced Data Analysis program by clicking on the bottom icon seen in Figure 5.3. Under the file tab of the Enhanced Data Analysis window, choose ‘take a snapshot’. The snapshot of the current run is then displayed. You can zoom in on a peak or region by clicking and dragging the cursor over the ‘square’ area desired to be blown up. Within the chromatogram subwindow, the cursor becomes a vertical line. Double right-clicking on the peak of interest brings up the mass spectrum in another subwindow below the chromatogram (Figure 5.5). Different regions of the peak can give varying information; therefore, it is important to click in several places within the same peak to obtain the best data. It is possible to take multiple snapshots during a run; however, once the last minute of the run has begun, the snapshot option becomes unavailable.
- There is useful data that can be obtained from these sub-windows. Notice the peak’s retention time is displayed at the top of the mass spectrum sub window. The abundance is observed as the X-axis of both the chromatogram and mass spectrum. These abundances should be in the 1x10⁵- 1x10⁶ range. Abundances of 1x10⁷ and greater are too large and indicate a possible over-injection, too concentrated of a sample, and/or wrong method. Extremely large abundances will shorten the filament lifetime. Conversely, abundances less than 1x10⁵ are also not desired and indicate injector problems, diluted sample, and/or the wrong method. Report abundances that are too high or too low to your TA immediately.
- In the mass spectrum sub-window, a library comparison search can be performed by double right-clicking inside the lower sub-window. The mass spectrum of the top library hit is displayed under your sample’s mass spectrum for ease of comparison along with a small table of compound identity, mass values, and other data. It is important to visually compare the two, often similar spectra with analogous peak passes are comparable but close attention to detail will discriminate them apart. There is also a confidence measure that is listed under the ‘Qual’ tab, the closer to 100 the value is the greater the confidence.
- Make sure to analyze the entire spectrum to ensure your snapshot included every peak. Snapshot data are typically stored in a ‘snapshot’ folder located on underneath the data file located on the same data path level. The standards should be single components, while the unknowns are mixtures. Standards will become contaminated as the course progresses; you should consult with your TA and focus on the largest peak. If several peaks are observed of the relative same abundance, especially in the unknowns, then fresh samples may be required. Again, consult with your TA.
- Once your run has completed, you can begin the next sample. The instrument will require a few minutes to return the GC oven temperature back to the 40 °C starting point. During this time, you can work up your data and print your spectra. Return to #4 and begin the next analysis.

Post-Lab Questions
1. Include the following data Reports:
- Standards
- A good chromatogram of each standard sample.
- A mass spectrum of each standard, that is, 6 total (with labeled peaks).
- A library print out of each known, that is 6 total.
- Unknowns (mixture containing 2 or more of the known standards)
- Chromatographs and mass spectra of all 3 unknown mixtures.
- Identify each unknown and report.
2. Identify the retention time, compound category, the compound matched in the library, and boiling points of the compounds.
3. Discuss the differences between the observed retention time values and the known boiling points. How can molecular structure affect these characteristics?
4. Identify the retention time(s) observed when performing the experiment on the unknown mixtures. Identify which compounds are present in each unknown.
5. Discuss any differences you observed in the mass spectra of the compounds.
References
- McLafferty, F. Interpretation of Mass Spectra; 3rd ed.; University Science Books: Mill Valley, CA, 1980.
- Silverstein, R. M.; Bassler, G. C.; Morrill, T. C. Spectrometric Interpretation of Organic Compounds; 4th ed.; Wiley: New York, NY, 1981.
- Skoog, D. A.; Holler, F. J.; Nieman, T. A. Principles of Instrumental Analysis, Fifth Edition; Harcourt Brace: Philadelphia, 1998; 591-621.