
Lab 2: High Performance Liquid Chromatography
- Page ID
- 136265

\( \newcommand{\vecs}[1]{\overset { \scriptstyle \rightharpoonup} {\mathbf{#1}} } \)
\( \newcommand{\vecd}[1]{\overset{-\!-\!\rightharpoonup}{\vphantom{a}\smash {#1}}} \)
\( \newcommand{\dsum}{\displaystyle\sum\limits} \)
\( \newcommand{\dint}{\displaystyle\int\limits} \)
\( \newcommand{\dlim}{\displaystyle\lim\limits} \)
\( \newcommand{\id}{\mathrm{id}}\) \( \newcommand{\Span}{\mathrm{span}}\)
( \newcommand{\kernel}{\mathrm{null}\,}\) \( \newcommand{\range}{\mathrm{range}\,}\)
\( \newcommand{\RealPart}{\mathrm{Re}}\) \( \newcommand{\ImaginaryPart}{\mathrm{Im}}\)
\( \newcommand{\Argument}{\mathrm{Arg}}\) \( \newcommand{\norm}[1]{\| #1 \|}\)
\( \newcommand{\inner}[2]{\langle #1, #2 \rangle}\)
\( \newcommand{\Span}{\mathrm{span}}\)
\( \newcommand{\id}{\mathrm{id}}\)
\( \newcommand{\Span}{\mathrm{span}}\)
\( \newcommand{\kernel}{\mathrm{null}\,}\)
\( \newcommand{\range}{\mathrm{range}\,}\)
\( \newcommand{\RealPart}{\mathrm{Re}}\)
\( \newcommand{\ImaginaryPart}{\mathrm{Im}}\)
\( \newcommand{\Argument}{\mathrm{Arg}}\)
\( \newcommand{\norm}[1]{\| #1 \|}\)
\( \newcommand{\inner}[2]{\langle #1, #2 \rangle}\)
\( \newcommand{\Span}{\mathrm{span}}\) \( \newcommand{\AA}{\unicode[.8,0]{x212B}}\)
\( \newcommand{\vectorA}[1]{\vec{#1}} % arrow\)
\( \newcommand{\vectorAt}[1]{\vec{\text{#1}}} % arrow\)
\( \newcommand{\vectorB}[1]{\overset { \scriptstyle \rightharpoonup} {\mathbf{#1}} } \)
\( \newcommand{\vectorC}[1]{\textbf{#1}} \)
\( \newcommand{\vectorD}[1]{\overrightarrow{#1}} \)
\( \newcommand{\vectorDt}[1]{\overrightarrow{\text{#1}}} \)
\( \newcommand{\vectE}[1]{\overset{-\!-\!\rightharpoonup}{\vphantom{a}\smash{\mathbf {#1}}}} \)
\( \newcommand{\vecs}[1]{\overset { \scriptstyle \rightharpoonup} {\mathbf{#1}} } \)
\(\newcommand{\longvect}{\overrightarrow}\)
\( \newcommand{\vecd}[1]{\overset{-\!-\!\rightharpoonup}{\vphantom{a}\smash {#1}}} \)
\(\newcommand{\avec}{\mathbf a}\) \(\newcommand{\bvec}{\mathbf b}\) \(\newcommand{\cvec}{\mathbf c}\) \(\newcommand{\dvec}{\mathbf d}\) \(\newcommand{\dtil}{\widetilde{\mathbf d}}\) \(\newcommand{\evec}{\mathbf e}\) \(\newcommand{\fvec}{\mathbf f}\) \(\newcommand{\nvec}{\mathbf n}\) \(\newcommand{\pvec}{\mathbf p}\) \(\newcommand{\qvec}{\mathbf q}\) \(\newcommand{\svec}{\mathbf s}\) \(\newcommand{\tvec}{\mathbf t}\) \(\newcommand{\uvec}{\mathbf u}\) \(\newcommand{\vvec}{\mathbf v}\) \(\newcommand{\wvec}{\mathbf w}\) \(\newcommand{\xvec}{\mathbf x}\) \(\newcommand{\yvec}{\mathbf y}\) \(\newcommand{\zvec}{\mathbf z}\) \(\newcommand{\rvec}{\mathbf r}\) \(\newcommand{\mvec}{\mathbf m}\) \(\newcommand{\zerovec}{\mathbf 0}\) \(\newcommand{\onevec}{\mathbf 1}\) \(\newcommand{\real}{\mathbb R}\) \(\newcommand{\twovec}[2]{\left[\begin{array}{r}#1 \\ #2 \end{array}\right]}\) \(\newcommand{\ctwovec}[2]{\left[\begin{array}{c}#1 \\ #2 \end{array}\right]}\) \(\newcommand{\threevec}[3]{\left[\begin{array}{r}#1 \\ #2 \\ #3 \end{array}\right]}\) \(\newcommand{\cthreevec}[3]{\left[\begin{array}{c}#1 \\ #2 \\ #3 \end{array}\right]}\) \(\newcommand{\fourvec}[4]{\left[\begin{array}{r}#1 \\ #2 \\ #3 \\ #4 \end{array}\right]}\) \(\newcommand{\cfourvec}[4]{\left[\begin{array}{c}#1 \\ #2 \\ #3 \\ #4 \end{array}\right]}\) \(\newcommand{\fivevec}[5]{\left[\begin{array}{r}#1 \\ #2 \\ #3 \\ #4 \\ #5 \\ \end{array}\right]}\) \(\newcommand{\cfivevec}[5]{\left[\begin{array}{c}#1 \\ #2 \\ #3 \\ #4 \\ #5 \\ \end{array}\right]}\) \(\newcommand{\mattwo}[4]{\left[\begin{array}{rr}#1 \amp #2 \\ #3 \amp #4 \\ \end{array}\right]}\) \(\newcommand{\laspan}[1]{\text{Span}\{#1\}}\) \(\newcommand{\bcal}{\cal B}\) \(\newcommand{\ccal}{\cal C}\) \(\newcommand{\scal}{\cal S}\) \(\newcommand{\wcal}{\cal W}\) \(\newcommand{\ecal}{\cal E}\) \(\newcommand{\coords}[2]{\left\{#1\right\}_{#2}}\) \(\newcommand{\gray}[1]{\color{gray}{#1}}\) \(\newcommand{\lgray}[1]{\color{lightgray}{#1}}\) \(\newcommand{\rank}{\operatorname{rank}}\) \(\newcommand{\row}{\text{Row}}\) \(\newcommand{\col}{\text{Col}}\) \(\renewcommand{\row}{\text{Row}}\) \(\newcommand{\nul}{\text{Nul}}\) \(\newcommand{\var}{\text{Var}}\) \(\newcommand{\corr}{\text{corr}}\) \(\newcommand{\len}[1]{\left|#1\right|}\) \(\newcommand{\bbar}{\overline{\bvec}}\) \(\newcommand{\bhat}{\widehat{\bvec}}\) \(\newcommand{\bperp}{\bvec^\perp}\) \(\newcommand{\xhat}{\widehat{\xvec}}\) \(\newcommand{\vhat}{\widehat{\vvec}}\) \(\newcommand{\uhat}{\widehat{\uvec}}\) \(\newcommand{\what}{\widehat{\wvec}}\) \(\newcommand{\Sighat}{\widehat{\Sigma}}\) \(\newcommand{\lt}{<}\) \(\newcommand{\gt}{>}\) \(\newcommand{\amp}{&}\) \(\definecolor{fillinmathshade}{gray}{0.9}\)- Students should be able to develop an understanding of the principles of liquid-liquid partitioning.
- Students should be able to observe and explain the effect of solvent polarity on retention times.
- Students should be able to interpret a chromatogram and use the information to determine the components in a mixture as well as the concentration of those components.
Introduction
Samples collected from medical patients, industry products, and the environment are usually mixtures of many compounds. Often times, doctors, producers, and researchers are interested in specific components in these mixtures, so these mixtures need to be separated. High-performance liquid chromatography (HPLC) offers the ability to do just that. HPLC data can be used to complement gas chromatography (GC) or be an excellent alternative to GC when the components are nonvolatile or would thermodynamically decompose under high temperatures.
In order to separate mixture components, HPLC takes advantages of partitioning between a mobile and stationary phase under a uniform pressure that is typically between 500 to 5000 psi. High pressure is required to obtain a reasonable flow rate through the column. The process begins when a small amount of liquid sample is injected into the column that has a stream of liquid flowing through (which is known as the mobile phase). In partition chromatography, the column is packed with particles that are coated with the stationary phase. The polarity of the component and the type of HPLC being performed determines which phase the component is more attracted to. If the component is more attracted to the mobile phase, it will flow out of the column and have a shorter retention time. If the component is more attracted to the stationary phase, the component will be retained and will, therefore, have a longer retention time. Similar to Capillary Electrophoresis (CE) or Gas Chromatography (GC), these retention times can be used to determine components. Selecting the mobile phase (or solvent) is one of the most important steps when performing HPLC and is selected based on polarity. Solvent polarity relates to the ability of the components to partition into that phase. The polarity scale for different solvents can be found in Table 2.1. These solvents can be used exclusively or mixed to achieve the desired polarity.
| Solvent | Relative Polarity |
|---|---|
| Fluoroalkanes | <-2 |
| Cyclohexane | .04 |
| 1-Chlorobutane | 1.0 |
| Carbon tetrachloride | 1.6 |
| Toluene | 2.4 |
| Tetrahydrofuran (THF) | 4.0 |
| Ethanol | 4.3 |
| Methanol | 5.1 |
| Acetonitrile | 5.8 |
| Ethylene glycol | 6.9 |
| Water | 10.2 |
HPLC can be performed with fixed or variable solvent composition. When the solvent polarity is fixed, it is known as an isocratic run. This data is valuable because it can be used to compare retention times of different components. This method only works when the components have unique retention times under that condition. When the retention times of the components are very similar or extremely different, not every component will be seen in the chromatogram. When solvent polarity is varied throughout the run, this is known as a gradient run. Gradient conditions can be optimized to improve the chance that all the components will be seen on the chromatogram. While all the retention times are not as comparable due to varying conditions, it is useful to see how many components are in the mixture and characterize the components.
During an HPLC analysis of a mixture, the components will separate based on their retention times. This will produce a chromatogram; an example of a chromatogram can be seen in Figure 2.1. Either the peak height or the peak area can be used to estimate the concentration. This can be done because these values are proportional to the concentration when the peaks are sharp, and the flow rate is carefully controlled. A calibration curve can be prepared by plotting either peak height or peak area as a function of concentration.
Figure 2.1: Reverse Phase (C18) Separation of Amino Acids.
Normal Phase Chromatography
Normal phase is a specific type of partitioning chromatography where the stationary phase is polar, and the mobile phase is non-polar. While the compounds selected might not be particularly polar or non-polar, their relative polarities are the most important. As long as the stationary phase is more polar than the mobile phase, it is considered normal phase chromatography. The stationary phase is usually a column packed with silica particles that have R groups attached. Common R groups for normal phase are -C2H4CN or -C3H6NH2.
When the mixture passes through the column, the polar components will be more attracted to the stationary phase and the non-polar components will be attracted to the mobile phase. This will lead the non-polar components to flow through (or elute) the column first. The more polar a compound is, the longer it will take to elute. By increasing the polarity of the mobile phase, the bound polar component will partition more into the mobile phase and elute from the column.
Reverse Phase Chromatography
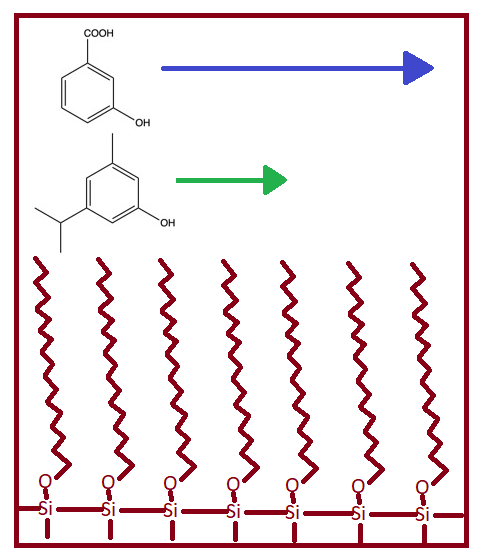
Reversed phase chromatography is another type of partition chromatography but is opposite from normal phase. The mobile phase is more polar than the stationary phase. In this case, the most polar components will elute first. Figure 2.2 provides an image for how components are moving through a reversed phase column. Common R groups found on the silica particles for reverse phase are -n-octyl (C8) or -n-octyldecyl (C18).
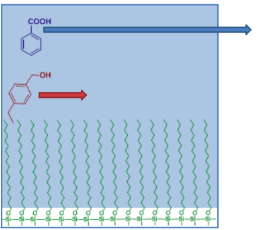
Adsorption Chromatography
The stationary phase is a solid of a polar nature such as particles of hydrated silica or alumina. The mobile phase and the solute (components in the sample) are in competition for active adsorption sites on the stationary phase particles. Thus, more strongly adsorbed components are retained longer than weakly adsorbed components. Because more polar compounds adsorb on a polar surface to a greater degree than do less polar compounds, retention in the column is related to sample polarity.
Ion Exchange Chromatography
Ion exchange HPLC is based on the partition of ions between a polar liquid phase and a stationary phase with ion exchange sites. The ion exchange sites are typically immobilized in small beads of resin that are formed by a cross-linked polymer. Bonded phase columns in which the ion exchanger is bonded to small particles of silica also are available. Cations are separated on cation exchange resins which contain negatively charged functional groups such as SO3- and –COO-. Anions are separated on anion exchange resins which contain positively charged functional groups such as CH2N+ (CH3)3, a quaternary ammonium ion. Separation is based on ions partitioning into the ion exchange phase to varying degrees. The selectivity of a resin for an ion is determined primarily by the charge on the ion and its hydrated radius. Resin affinity increases with increasing charge density.
Instrumentation
The apparatus consists of a container of the mobile phase, a pump capable of pressures up to 4000 psi or greater, a valve for injecting the sample (usually 10 to 500 μL volumes), the column (sometimes thermostatted), a detector, electronics associated with the detector, and a recorder. A schematic of the HPLC instrument can be seen in Figure 2.3. This instrument in this lab used a C18 column.
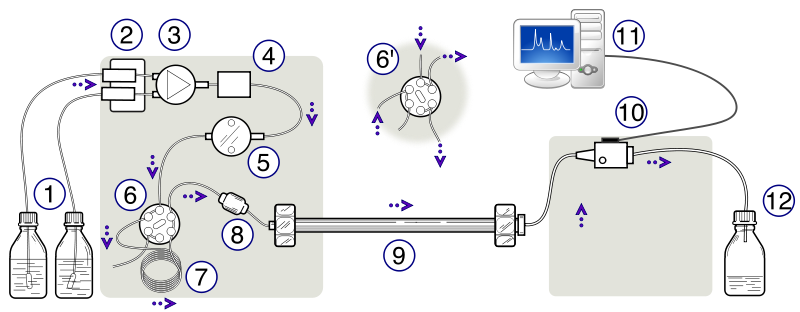
Figure 2.3: Schematic Diagram of a High-Performance Liquid Chromatograph. (1) Solvent reservoirs, (2) Solvent degasser, (3) Gradient valve, (4) Mixing vessel for delivery of the mobile phase, (5) High-pressure pump, (6) Switching valve in "inject position", (6') Switching valve in "load position", (7) Sample injection loop, (8) Pre-column or guard column, (9) Analytical column, (10) Detector (i.e. IR, UV), (11) Data acquisition, (12) Waste or fraction collector. Created by Yassne Mrabet.
UV-visible absorbance is the most commonly used mode of detection. Such detectors enable the component (or effluent) from the column to flow through an 8 to 10 μL spectrophotometric cell for detection of compounds at a particular wavelength (often in the ultraviolet, < 400nm, where many organic molecules absorb). Electrochemical and fluorescence detectors often are used to achieve lower detection limits. The other commonly used detector is based on a measurement of the differential refractive index.
Experimental Procedure
Part 1: Readying the HPLC for Operation
1. Ready the HPLC by making sure the solvent reservoirs are full and the waste bottles have at least 1 Liter of volume available to accommodate the waste solvent.
2. Launch Open Lab by clicking HPLC1 (online) (Figure 2.4)

3. Use the Instrument Control Tab. Confirm that all components are green and indicate “ready.” (Figure 2.5)
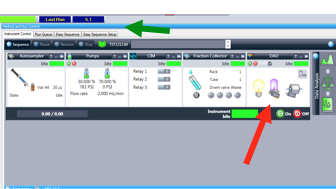
a. If this is not the case, press the “On” button.
b. The DAD will take a few minutes to warm up; if there is a lightning bolt through the purple lamp, wait until it has gone away, and the ready bar has turned green.
c. The fraction collector will not be used in this experiment.

Part 2: Separating a Paraben Mixture
Parabens are a class of chemicals widely used as preservatives in the cosmetic and pharmaceutical industries. Parabens are effective preservatives and are primarily used for their bactericidal and fungicidal properties. Parabens can be found in shampoos, shaving gels, personal lubricants, topical/parenteral pharmaceuticals, spray tanning lotion and toothpaste. Parabens can also be used as food additives. Recently, there has been an in-vivo and in-vitro studies have shown that parabens have weak estrogenic activity. Because parabens are endocrine disrupters, paraben concentrations have been mitigated and must not surpass the maximum permitted levels. Paraben mixtures are often used in order to increase the efficiency of the preservation. Take the time to look up general paraben structures to develop an understanding of their chemical structure.
Because parabens are often found in mixtures, HPLC can be used to separate the individual compounds. To determine the components in the mixture, reverse phase HPLC will be performed through a C18 column. In this portion of the experiment, gradient and isocratic elution data will be collected and compared. The paraben mixture has already been prepared for you and contains 4-hydroxy benzoic acid, methyl-4-hydroxy benzoate, ethyl-4-hydroxy benzoate, and propyl-4-hydroxy benzoate.
To begin, five isocratic experiments will be performed. The conditions for the five experiments are listed in Table 2.2.
| Experimental Run | Mobile Phase Composition |
|---|---|
| 1 | 100 % methanol |
| 2 | 90 % methanol / 10 % water |
| 3 | 80 % methanol / 20 % water |
| 4 | 70 % methanol / 30 % water |
| 5 | 60 % methanol / 40 % water |
Preparing a Sequence for the Paraben mixture
1. Set up six methods. One for each of the 5 isocratic runs and one for the gradient run.**Your TA will be assisting you while you set up your sequence.**
2. Select “PARABENS.S” in the “sequence” menu bar.
3. Go to “sequence” and click “sequence template” and see the order of the samples. Each run will use the same sample which should be vial slot 1.
4. Each method should be different for each run. To check this, click the “method” menu bar, click “method” in the selection menu, and select “edit entire method.”
5. Look through the method with your TA and check that all the parameters are correct. DO NOT change anything in the method unless you confirm with your TA that you are doing so. Save the method once you are done.
6. Confirm that you have enough of the paraben mixture in the sample vial and that the sample vial is in vial slot 1.
7. Click “run sequence.”
8. You can print the reports after each run or after all runs are complete. You can find the data reports by clicking the “data analysis” tab in the bottom.
9. Before moving on, confirm that you have peaks for each of your runs. If you notice any issues with your data, talk with your TA.
*The Paraben mixture runs will take approximately one hour to run, so the caffeine standards and the beverage samples can be prepared while they are running*
Part 3: Analysis of Caffeine in Beverages
Caffeine is a common chemical that we interact with on a daily basis and people have access to it in many forms. They can drink it in many types of beverages, eat it in different types of food, and even take it in pill form. Reverse phase HPLC can be used to determine the amount of caffeine in these items. In this experiment, you will be determining the amount of caffeine in coffee, tea, and a soft drink. If the runs are performed with the same isocratic parameters, retention time can be used as a qualitative measure and peak area or peak height can be used as a quantitative measure of caffeine in a sample. In order to determine the concentration of caffeine in these samples, a calibration curve must be put together using a set of standard solutions comparing either the peak height or peak area to the known concentration of the solution.
Preparing the Standard Caffeine Samples
**DO NOT dispose of these samples; they will be used in Lab 6-Capillary Electrophoresis**
1. Accurately weigh out 10.0 mg of caffeine. The caffeine can be found on the shelf near the weigh station area.
2. Transfer the caffeine into a clean 100 mL volumetric flask.
3. Dilute to the mark with HPLC/CE grade water. The stock solution will have a final concentration of 0.1 g/L.
4. Carry out a series of dilutions to obtain standard solutions of 0.01 g/L, 0.025 g/L, 0.05 g/L, and 0.075 g/L. Make 10 mL of each solution and use HPLC/CE grade water to make the dilutions.
5. Shake each of the mixtures to ensure adequate mixing.
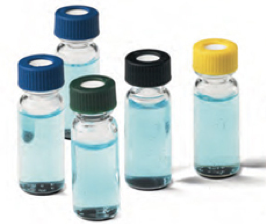
6. Filter the solutions using the provided filter. Do not do this until you are ready to run your samples.
a. The filter and syringe can be reused if the solutions are filtered from low concentration to high concentration.
b. The syringes can be found in the plastic drawers near the door of the lab.
c. Filter approximately 1 mL and dispose of it into a waste beaker to wash the filter.
d. Filter the solution into the appropriate vial. (Figure 2.6) DO NOT put tape on the vials; ask your TA for a sharpie to write directly on the vials.
Preparing the Beverage Samples
**DO NOT dispose of these samples; they will be used in Lab 6-Capillary Electrophoresis**
1. The beverages can be found in the refrigerator in the lab.
2. Prepare the Coffee Sample.
a. Pipette 5 mL of coffee into a clean and Dry 50 mL volumetric flask and dilute to the mark with HPLC/CE grade water.
b. Filter the sample using the provided filter.
c. Rinse the filter by filtering the first 1-2mL of the sample into the waste beaker.
d. Fill a vial with the appropriate volume and label the vial.
3. Prepare the Tea Sample.
a. Pipette 10 mL of tea into a clean and Dry 50 mL volumetric flask and dilute to the mark with HPLC/CE grade water.
b. Filter the sample using the provided filter.
c. Rinse the filter by filtering the first 1-2mL of the sample into the waste beaker.
d. Fill a vial with the appropriate volume and label the vial.
4. Prepare the Soft Drink Sample
a. If the soft drink you selected is carbonated, decarbonate the soft drink by pouring it back and forth between two beakers until the bubbles cease.
b. Pipette 25 mL of the soft drink into a clean and Dry 50 mL volumetric flask and dilute to the mark with HPLC/CE grade water.
c. Filter the sample using the provided filter.
d. Rinse the filter by filtering the first 1-2mL of the sample into the waste beaker.
e. Fill a vial with the appropriate volume and label the vial.
Preparing a Sequence for the Caffeine Standards and Samples
1. Set the method for this experiment. All of the samples will use the same method. **Your TA will be assisting you while you set up your sequence.**
2. Put standard caffeine solutions in slots 1-5 with the least concentrated in slot 1 and the most concentrated in slot 5. Place the beverage samples in slots 6-8.
3. Select “CHE 115 CAFFEINE.M” in the “method” menu bar.
4. Click “method” in the selection menu and select “edit entire method.”
5. Confirm that the solvent mixture is 47% Methanol and 53% Water.
6. Go to “sequence” menu bar and select “CAFFEINE_LC.S.”
7. Click “sequence” followed by “sequence template” and check to see that your samples are in the correct sample order/slots. Click “run sequence.”
8. While the samples are running, make sure all of your bulk samples and caffeine standards are in containers that can be stored and are properly labeled if you are performing this lab before Lab 6 (CE experiment).
9. Confirm with your TA that your data looks appropriate before disposing of any solutions. You can dispose of the small vials for this experiment once you have collected all of your data. If you have already performed Lab 6, then dispose of your samples.
Treatment of Data
1. You can print the reports after each run or after all runs are complete. You can find the data reports by clicking the “data analysis” tab in the bottom.
2. Before completing the lab, confirm that you have peaks for each of your runs. If you notice any issues with your data, talk with your TA.
3. Create a calibration curve using the caffeine standard peak height or area versus the concentration. This can be done in Chemstation in the lab or at home in excel/google sheets.
a. To create a calibration curve in Chemstation, start by clicking the “data analysis” tab in the bottom left corner of the window. This will open and HPLC (offline) window.
b. Go to the CHE 115 file and find your data folder and select it.
c. Double click the first standard run in the sequence window.
d. Find the “Calibration” tab in the menu bar and select “New Calibration Table.”
e. A new window “Calibrate: HPLC1” will appear and select “Automatic setup.”
f. Set the “level” to 1 and put the concentration of the first run in the “Default Amount.” Press “OK.”
g. Double click the second run and go to the “Calibration” menu bar and click “Add Level.”
h. Set the “Level” to 2 and enter the second run’s concentration in the “Default Amount.” Press “OK.”
i. Repeat steps g and h for each of the remaining standard solutions.
j. The Calibration Table and the Calibration Curve can be viewed in the bottom of the window. Confirm that all the points are there.
Post-Lab Questions
Questions for Part 2: Separating a Paraben Mixture
**Include ALL Elution Data Reports**
1. How many compounds are observed in the paraben mixture? Identify each peak on the gradient chromatogram.
2. Compare the results from the isocratic runs to the results from the gradient run.
3. What advantages does the gradient elution offer?
4. What disadvantages does the gradient elution have compared to the isocratic elution?
5. Plot the results of the retention time of the last component (longest retention time in isocratic runs) versus percent Methanol for the series of isocratic runs. (plot log r.t. versus &MeOH). Do you obtain a linear plot? Explain.
Questions for Part 3: Analysis of Caffeine in Beverages
1. Using the calibration curve, determine the concentration of caffeine for each beverage in g/L.
a. Describe whether you used peak height, peak area, or both to estimate the concentration. Discuss the advantages to each method.
b. Make sure you take into account the dilutions you made when preparing the samples.
2. Discuss the errors potentially made during this experiment.
3. Discuss how retention times depends on methanol and the pH of the mobile phase. What factors contribute to the choice of mobile phase composition and pH in the present analysis.
4. If you have already performed Lab 6 – Capillary Electrophoresis, did you get the same concentrations as you calculated in the CE experiment? If the answers are different, discuss possible explanations.
References
- Engeli RT, Rohrer SR, Vuorinen A, et al. Interference of Paraben Compounds with Estrogen Metabolism by Inhibition of 17β-Hydroxysteroid Dehydrogenases. Int J Mol Sci. 2017;18(9):2007. pdf
- Larsson K, Ljung Björklund K, Palm B, et al. Exposure determinants of phthalates, parabens, bisphenol A and triclosan in Swedish mothers and their children. Environ Int. 2014;73:323-33. pdf
- McDevitt, V. L.; Rodriguez, A.; Williams, K. R. Analysis of Soft Drinks: UV Spectrophotometry, Liquid Chromatography, and Capillary Electrophoresis. J. Chem. Ed. 1998, 75, 625-629. pdf
- Skoog, D., Holler, F. J., & Crouch, S. R. (2017). Principles of Instrumental Analysis (Seventh ed.). Boston, MA: Cengage Learning.