
4.2: Lab - Differential Rate Law
- Page ID
- 338912

\( \newcommand{\vecs}[1]{\overset { \scriptstyle \rightharpoonup} {\mathbf{#1}} } \)
\( \newcommand{\vecd}[1]{\overset{-\!-\!\rightharpoonup}{\vphantom{a}\smash {#1}}} \)
\( \newcommand{\id}{\mathrm{id}}\) \( \newcommand{\Span}{\mathrm{span}}\)
( \newcommand{\kernel}{\mathrm{null}\,}\) \( \newcommand{\range}{\mathrm{range}\,}\)
\( \newcommand{\RealPart}{\mathrm{Re}}\) \( \newcommand{\ImaginaryPart}{\mathrm{Im}}\)
\( \newcommand{\Argument}{\mathrm{Arg}}\) \( \newcommand{\norm}[1]{\| #1 \|}\)
\( \newcommand{\inner}[2]{\langle #1, #2 \rangle}\)
\( \newcommand{\Span}{\mathrm{span}}\)
\( \newcommand{\id}{\mathrm{id}}\)
\( \newcommand{\Span}{\mathrm{span}}\)
\( \newcommand{\kernel}{\mathrm{null}\,}\)
\( \newcommand{\range}{\mathrm{range}\,}\)
\( \newcommand{\RealPart}{\mathrm{Re}}\)
\( \newcommand{\ImaginaryPart}{\mathrm{Im}}\)
\( \newcommand{\Argument}{\mathrm{Arg}}\)
\( \newcommand{\norm}[1]{\| #1 \|}\)
\( \newcommand{\inner}[2]{\langle #1, #2 \rangle}\)
\( \newcommand{\Span}{\mathrm{span}}\) \( \newcommand{\AA}{\unicode[.8,0]{x212B}}\)
\( \newcommand{\vectorA}[1]{\vec{#1}} % arrow\)
\( \newcommand{\vectorAt}[1]{\vec{\text{#1}}} % arrow\)
\( \newcommand{\vectorB}[1]{\overset { \scriptstyle \rightharpoonup} {\mathbf{#1}} } \)
\( \newcommand{\vectorC}[1]{\textbf{#1}} \)
\( \newcommand{\vectorD}[1]{\overrightarrow{#1}} \)
\( \newcommand{\vectorDt}[1]{\overrightarrow{\text{#1}}} \)
\( \newcommand{\vectE}[1]{\overset{-\!-\!\rightharpoonup}{\vphantom{a}\smash{\mathbf {#1}}}} \)
\( \newcommand{\vecs}[1]{\overset { \scriptstyle \rightharpoonup} {\mathbf{#1}} } \)
\( \newcommand{\vecd}[1]{\overset{-\!-\!\rightharpoonup}{\vphantom{a}\smash {#1}}} \)
\(\newcommand{\avec}{\mathbf a}\) \(\newcommand{\bvec}{\mathbf b}\) \(\newcommand{\cvec}{\mathbf c}\) \(\newcommand{\dvec}{\mathbf d}\) \(\newcommand{\dtil}{\widetilde{\mathbf d}}\) \(\newcommand{\evec}{\mathbf e}\) \(\newcommand{\fvec}{\mathbf f}\) \(\newcommand{\nvec}{\mathbf n}\) \(\newcommand{\pvec}{\mathbf p}\) \(\newcommand{\qvec}{\mathbf q}\) \(\newcommand{\svec}{\mathbf s}\) \(\newcommand{\tvec}{\mathbf t}\) \(\newcommand{\uvec}{\mathbf u}\) \(\newcommand{\vvec}{\mathbf v}\) \(\newcommand{\wvec}{\mathbf w}\) \(\newcommand{\xvec}{\mathbf x}\) \(\newcommand{\yvec}{\mathbf y}\) \(\newcommand{\zvec}{\mathbf z}\) \(\newcommand{\rvec}{\mathbf r}\) \(\newcommand{\mvec}{\mathbf m}\) \(\newcommand{\zerovec}{\mathbf 0}\) \(\newcommand{\onevec}{\mathbf 1}\) \(\newcommand{\real}{\mathbb R}\) \(\newcommand{\twovec}[2]{\left[\begin{array}{r}#1 \\ #2 \end{array}\right]}\) \(\newcommand{\ctwovec}[2]{\left[\begin{array}{c}#1 \\ #2 \end{array}\right]}\) \(\newcommand{\threevec}[3]{\left[\begin{array}{r}#1 \\ #2 \\ #3 \end{array}\right]}\) \(\newcommand{\cthreevec}[3]{\left[\begin{array}{c}#1 \\ #2 \\ #3 \end{array}\right]}\) \(\newcommand{\fourvec}[4]{\left[\begin{array}{r}#1 \\ #2 \\ #3 \\ #4 \end{array}\right]}\) \(\newcommand{\cfourvec}[4]{\left[\begin{array}{c}#1 \\ #2 \\ #3 \\ #4 \end{array}\right]}\) \(\newcommand{\fivevec}[5]{\left[\begin{array}{r}#1 \\ #2 \\ #3 \\ #4 \\ #5 \\ \end{array}\right]}\) \(\newcommand{\cfivevec}[5]{\left[\begin{array}{c}#1 \\ #2 \\ #3 \\ #4 \\ #5 \\ \end{array}\right]}\) \(\newcommand{\mattwo}[4]{\left[\begin{array}{rr}#1 \amp #2 \\ #3 \amp #4 \\ \end{array}\right]}\) \(\newcommand{\laspan}[1]{\text{Span}\{#1\}}\) \(\newcommand{\bcal}{\cal B}\) \(\newcommand{\ccal}{\cal C}\) \(\newcommand{\scal}{\cal S}\) \(\newcommand{\wcal}{\cal W}\) \(\newcommand{\ecal}{\cal E}\) \(\newcommand{\coords}[2]{\left\{#1\right\}_{#2}}\) \(\newcommand{\gray}[1]{\color{gray}{#1}}\) \(\newcommand{\lgray}[1]{\color{lightgray}{#1}}\) \(\newcommand{\rank}{\operatorname{rank}}\) \(\newcommand{\row}{\text{Row}}\) \(\newcommand{\col}{\text{Col}}\) \(\renewcommand{\row}{\text{Row}}\) \(\newcommand{\nul}{\text{Nul}}\) \(\newcommand{\var}{\text{Var}}\) \(\newcommand{\corr}{\text{corr}}\) \(\newcommand{\len}[1]{\left|#1\right|}\) \(\newcommand{\bbar}{\overline{\bvec}}\) \(\newcommand{\bhat}{\widehat{\bvec}}\) \(\newcommand{\bperp}{\bvec^\perp}\) \(\newcommand{\xhat}{\widehat{\xvec}}\) \(\newcommand{\vhat}{\widehat{\vvec}}\) \(\newcommand{\uhat}{\widehat{\uvec}}\) \(\newcommand{\what}{\widehat{\wvec}}\) \(\newcommand{\Sighat}{\widehat{\Sigma}}\) \(\newcommand{\lt}{<}\) \(\newcommand{\gt}{>}\) \(\newcommand{\amp}{&}\) \(\definecolor{fillinmathshade}{gray}{0.9}\)
Learning Objectives
Goals:
- Mathematically determine the rate of reaction's dependence on concentration and temperature for a specific chemical reaction
By the end of this lab, students should be able to:
- design, and run an experiment to calculate the constants in the rate law for a chemical reaction involving two reacting species..
- generate log-log plots to calculate the orders of reaction for various reactants..
- Use Arrhenius Equation to determine the activation energy from the temperature dependence of the rate for a chemical reaction.
Prior knowledge:
Concurrent Reading & Additional Resources
Safety
- Emergency Preparedness
- Eye protection is mandatory in this lab, and you should not wear shorts or open toed shoes.
- FeNO3 PubChem LCSS
- HNO3 PubChem LCSS
- KI PubChem LCSS
- Na2S2O3 PubChem LCSS
- Minimize Risk
- Check the cord on the hotplate, inform the instructor if it is frayed.
- Make sure the electrical cord never touches the surface of the hotplate
- label all containers
- Recognize Hazards
- All solutions should be considered harmful and care should be taken to avoid contact with your skin or other body tissues.
- In event of contact with reagents you should flush contacted area with water and notify instructor immediately.
- All waste is placed in the labeled container in the hood and will be recycled when the lab is over. Contact your instructor if the waste container is full, or about full.
Equipment and materials needed
| 6 50mL Burettes | 250 mL Erlenmeyer flask | 150 ml beaker |
| 0.04M FeNO3 | 0.15M HNO3 | 0.04M KI |
| distilled H2O | 0.004M Na2S2O3(aq) | 2% Starch |
| hot plate | Ice bath | 2 thermometers |
Background
Kinetics deals with the rate at which a process occurs and chemical kinetics deals with the rates of chemical reactions. This lab will investigate the kinetics associated with the following reaction.
\[\underbrace{2Fe^{+3}(aq)}_{\text{Ferric Iron}} + \underbrace{2I^-(aq)}_{Iodide} \rightarrow \underbrace{2Fe^{+2}(aq)}_{\text{Ferrous Iron}} + \underbrace{I_2(aq)}_{\text{iodide}} \]
This reaction is called an iodine clock reaction because we can measure the effect of varing reagent concentrations and temperature on the time it takes for the iodine to react with starch and turn blue. The following video from Thammasat University in Thailand demonstrates this reaction.
Video \(\PageIndex{1}\): The last 46 seconds of a video showing the reduction of Iron(III) by Iodide reaction that we will be studying, uploaded by Kanchanok Duangkhai (https://youtu.be/azUuxhclcm0).
The rate law is
\[R = k [Fe^{+3}]^m [I^-]^n\]
where R is the depedent variable. Although it looks like there are there are two independent variables,([Fe+3], [I-]), there are really three as \(k=Ae^{-\frac{E_A}{RT}}\) and so T is also an independent variable. We will run three sets of experiments, where you vary one of the three independent variables ([Fe+3], [I-] or T) while holding the other two constant and measure the effect on the rate (dependent variable).
The Reactions
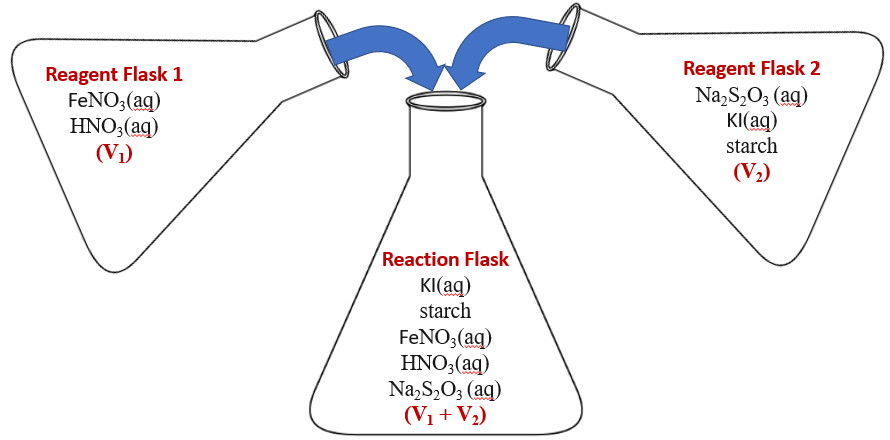
In this experiment, we will mix two solutions as in video \(\PageIndex{1}\) and measure the time for the mixture to turn blue. Figure \(\PageIndex{1}\) shows the two reagents in each of the two reagent flasks (see table \(\PageIndex{1}\) of the experimental procedures to see the experimental concentrations).
 Figure
 The chemical reactions in this equation are described below. The basis of the reaction is once the iodine reaches a sufficient concentration it reacts with the starch and the system turns blue, but this can not happen until all the thiosulfate (S2O3-2) is consumed.
\[\begin{align} 2Fe^{+3}(aq) + 2I^-(aq) & \rightarrow 2Fe^{+2}(aq) + {\color{red}I_2(aq)} \; \; \; \;\; \; \;\text{Relatively Slow Step}\\ {\color{red}I_2(aq)} + 2S_2O_3^{-2}(aq) & \rightarrow 2I^-(aq) + S_4O_6^{-2}(aq) \; \; \;\ \; \text{Very Fast Step}\\ {\color{red}I_2(aq)} + Starch(aq) & \rightarrow \underbrace{\color{blue}{I_2\text{-Starch Complex}}}_{ \textcolor{blue}{(\large{DARK BLUE})}} \end{align}\]
Note how the iodine (in red) produced in the first step is consumed in both the second and third steps. That is, there are two competing reactions that are trying to consume the iodine generated in the first step. The thiosulfate (S2O3-2) of the second step reacts so fast that it is considered to be an "iodine scavenger" and as long as there is thiosulfate present the iodine never accumulates to a sufficient concentration to react with the starch of the third step and turn blue. But once the thiosulfate is consumed the iodine accumulates, reacts with the starch and the solution turns blue.
Measuring the Rate
In section 14.1 we learned that the rate of a reaction can be expressed in terms of the consumption of any reactant or the production of any product. Lets define rate on consumption of ferric ion (-\(\frac{[Fe^{+3}]}{\Delta t}\)). We need to know how much ferric iron is consumed from the moment we mixed the solutions until they turned blue. Thiosulfate (S2O3-2) reacts so fast that it is considered to be an "iodine scavenger" and as long as there is thiosulfate present the iodine never accumulates to a sufficient concentration to react with the starch and turn blue. But once the thiosulfate is consumed the iodine accumulates, reacts with the starch and the solution turns blue. So we need to relate the ferrous ion concentration to the thiosulfate concentration. If we add equations 5.2 and 5.3 (which are coupled by the iodine intermediate) we get:
\[2Fe^{+3}(aq) + 2S_2O_3^{-2}(aq) \rightarrow 2Fe^{+2}(aq) + S_4O_6^{-2}(aq)\]
If we look at the relative rates (sections 14.1.4) we see
\[ R=-\frac{1}{2} \frac{\Delta [S_2O_3^{-2}]}{\Delta t}=-\frac{1}{2}\frac{\Delta [Fe^{+3}]}{\Delta t}\]
so
\[ R= \frac{\Delta [S_2O_3^{-2}]}{\Delta t}=\frac{\Delta [Fe^{+3}]}{\Delta t}\]
and since we know the thiosulfate goes from the initial concentration to zero, we can calculate the rate of ferrous ion consumption by measuring the rate of thiosulfate consumption
Note, for this to work
\[ [S_2O_3^{-2}]<<[Fe^{+3}]
\]
and so if we know the concentration of thiosulfate ([S2O3-2]) and measure the time to turn blue, we can determine the rate of reaction.
Experimental Design Considerations
Before proceeding with this experiment you should review section 14.3 and section 14.5.2 on the rate law and the Arrhenius equation. The rate law for this equation is
\[R = k [Fe^{+3}]^m [I^-]^n\]
If we substitute the Arrhenius Equation (\(k=e^{-\frac{R_a}{RT}}\)) we get
\[\underbrace{R}_{\textcolor{red}{R=Rate}}=\underbrace{Ae^{-\frac{E_A}{RT}}[Fe^{+3}]^m[I^-]^n}_{\textcolor{red}{\text{R in RT is the Ideal Gas Constant}}} \]
This is a multivariable equation (section 14.4.3) with one dependent, three independent variables and five constants (m,n,R,A & EA)
R=Rate (Dependent)
[Fe+3] = Ferrous ion concentration (independent)
[I-] = Iodide concentration (independent)
T = Temperature (independent)
When we make a plot we measure the affect of the independent variable on the dependent variable. That is, for the generic function Y=fct(X) we change X and measure the value of Y. So we need to run three sets of experiments where we successively hold two of the variables constant.
Consideration \(\PageIndex{1a}\): Rate Dependence on Fe+3
Describe the overall design of how you could design an experiment that would allow you to measure the affect of ferric ion concentration on the rate? Explain what would be varied and what would be held constant, do not explain how you would actually make the measurements. Describe the function relating the rate dependence on ferrous ion concentration under these conditions.
- Answer
-
You would vary [Fe+3] at constant T and [I-] and measure the initial rate at the different concentrations. Since T and [I-] are constant the complete rate law becomes
\[R=k'[Fe^{+3}]^m \\ \text{where} \\ k'=Ae^{-\frac{E_A}{RT}}[I^-]^n\nonumber \]
Consideration \(\PageIndex{1b}\)
For the above consideration, what would you plot to get a straight line relationship, and how would you determine the order of reaction with respect to the iron concentration
- Answer
-
Since the above equation is a power function would would make a log/log plot and the slope of the line would be the order of reaction with respect to ferrous ion concentration. The equation would be
\[logR=mlog[Fe^{+3}] + logk' \nonumber \]
Consideration \(\PageIndex{2a}\): Rate Dependence on I-
Describe the overall design of how you could design an experiment that would allow you to measure the affect of iodide ion concentration on the rate? Explain what would be varied and what would be held constant, do not explain how you would actually make the measurements. Write the equation and show what is held constant
- Answer
-
You would vary [I-] at constant T and [Fe+3] and measure the initial rate at the different concentrations. Since T and [Fe+] are constant the complete rate law becomes
\[R=k''[I^-]^n \\ \text{where} \\ k''=Ae^{-\frac{E_A}{RT}}[Fe^{+3}]^m\nonumber \]
Consideration \(\PageIndex{2b}\)
For the above consideration, what would you plot to get a straight line relationship, and how would you determine the order of reaction with respect to the iodide concentration
- Answer
-
Since the above equation is a power function would would make a log/log plot and the slope of the line would be the order of reaction with respect to ferrous ion concentration. The equation would be
\[logR=mlog[I^{-}] + logk'' \nonumber \]
Consideration \(\PageIndex{3a}\): Rate Dependence on T
Describe the overall design of how you could design an experiment that would allow you to measure the affect of temperature (T) on the rate? Explain what would be varied and what would be held constant, do not explain how you would actually make the measurements. Describe what the function relating the rate dependence on temperature under these conditions.
- Answer
-
You would vary the temperature while keeping [Fe+3] and [I-] constant. The rate law becomes:
\[R=k'''e^{-\frac{E_A}{RT}} where K''' = A[Fe^{+3}]^m [I^-]^n \nonumber \]
Consideration \(\PageIndex{3b}\)
For the above consideration, what would you plot to get a straight line relationship, and how would you determine the Energy of Activation (Ea)?
- Answer
-
The above equation is an exponential function you would think we would plot the natural log of R as a function of the reciprocal temperature, and we could
\[lnR=-\frac{E_a}{RT}+ lnk''' \nonumber \]
but that is not what we normally do. Instead, we solve the value of k using the known values of [Fe+3] and [I-] ,
\[R = k [Fe^{+3}]^m [I^-]^n \\ to \\ \frac{R}{[Fe^{+3}]^m[I^-]^n} = \nonumber\]
noting
\[k=e^-\frac{E_a}{RT} \nonumber\]
and then using the Arrhenius equation we plot
\[lnk=\frac{-E_a}{R}\left ( \frac{1}{T} \right ) + lnA \nonumber \]
The slope of the line is -\(\frac{E_a}{R}\), where R=8.314\(\frac{J}{mol \cdot K}\)
Consideration \(\PageIndex{1}\)
Why can't you just use the ratio method of the two state technique (section 14.3.3.2) for this lab report?
- Answer
-
There will be a lot error because "seeing" the solution turn blue is subjective. If your data is exact, you can choose any two points.
 Figure \(\PageIndex{1}\): The slope between two points varies a lot when there is a lot of random error in the data (Copyright; Bob Belford CC0)
Consideration \(\PageIndex{1}\)
Discuss the challenges of measuring the temperature for the hot and cold runs (experiments 6 & 7)
- Answer
-
The room is the final heat sink and the building's heating and ventilation system is maintaining a constant temperature, so the hot run will cool to room temperature and the cold will warm. The problem is the rate of heat flow (and thus the rate in change in temperature ) is an exponential function of the temperature difference between the system and the room. If the room is 25 oC a hot object at 99oC will cool to 98oC much faster than an object at 27oC will cool to 26oC. If the solution cools while you are waiting for it to turn blue you will not have an accurate measure of the temperature, as the temperature changed while you were making your measurement.
Consideration \(\PageIndex{1}\)
Why do we not want to run the experiment at real hot temperatures.
- Answer
-
There are essentially three reasons.
- The hotter it is the easier it is to get burned, and so it is safer.
- At high temperatures it cools real fast and so the temperature will change quickly and it will be harder to run the experiment at constant temperature.
- The reaction speeds up and could be so fast that you may have difficulties measuring it. (If it changes in a second or two, the relative error will be very great)
There is an additional reason, and that is that at high temperatures you may also start seeing competing reactions occurring.
Consideration \(\PageIndex{1}\)
What could we do to prevent the temperature from changing during the experiment?
- Answer
-
We could use a calorimeter to hold the solutions so that no heat flows between the solution and the room.
Consideration \(\PageIndex{1}\)
You may come up with a non-integer order of reaction and we want you to round off to an integer. Please look at the reactions in equations 4.2.3 and 4.2.4. In the first, iodide reduces ferric iron to ferrous iron. In the second reaction thisulfate reduces iodine back to iodide. Can you come up with a competing reaction for the consumption of ferric iron that may interfere with our estimate of its order of reaction.
- Answer
-
Both iodide and thiosulfate are reducing agents, and so the thiosulfate can also reduce ferric iron to ferrous iron
\[2Fe^{+3}(aq) + 2S_2O_3^{-2}(aq) \rightarrow 2Fe^{+2}(aq) + S_4O_6^{-2}(aq) \nonumber \]
This is a competing reaction, fortunately it is slower than the reaction we are investigating, but when you have competing reactions that you are not taking into account, you may end up with non-integer orders of reaction.
Experimental Procedures
In this experiment you will mix a solution containing ferric iron with another containing iodide, and then measure the time it takes for the solution to turn blue, when you can conclude all the thiosulfate was consumed. Everyone should start with experiment 3 and show the instructor the results before proceeding. All groups should have roughly the same amount of time (it will depend on the temperature of the room). If a group has a radically different time they should bring this to the attention of the instructor and possibly repeat the experiment. All data needs to be uploaded to a Google Sheet after class as it is shared across the class. Note the data from experiment 3 is used in all three graphs.
The Reagents
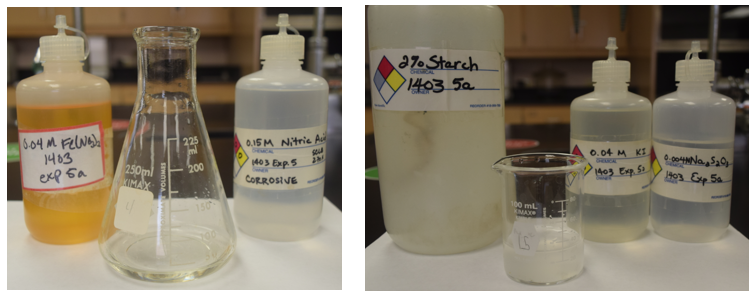 Figure \(\PageIndex{2}\): Reagents and flasks (Copyright; Liliane Poirot CC0)
|
Reagent 1
250 mL Erlenmeyer Flask |
Reagent 2 150 mL Beaker |
Conditions |
|||||||||
| Exp. # |
0.04M |
0.15M |
H2O |
Exp. # |
0.04M |
0.004M S2O3-2 |
Starch, (mL) |
H2O, (mL) |
Temp |
Time (sec) | |
| 1 | 20.00 | 20.00 | 10.00 |
1 |
10.00 |
10.00 |
5.00 |
25.00 | room | ||
| 2 | 15.00 | 20.00 | 15.00 |
2 |
10.00 |
10.00 |
5.00 |
25.00 | room | ||
| 3 | 10.00 | 20.00 | 20.00 |
3 |
10.00 |
10.00 |
5.00 |
25.00 |
room or variable |
||
| 4 | 10.00 | 20.00 | 20.00 |
4 |
15.00 |
10.00 |
5.00 |
20.00 | room | ||
| 5 | 10.00 | 20.00 | 20.00 |
5 |
20.00 |
10.00 |
5.00 |
15.00 | room | ||
| 6 | 10.00 | 20.00 | 20.00 | 6 |
10.00 |
10.00 |
5.00 |
25.00 | THOT | ||
| 7 | 10.00 | 20.00 | 20.00 | 7 |
10.00 |
10.00 |
5.00 |
25.00 | TCOLD | ||
Part 1: Room Temperature Kinetics
- Record room temperature on your data sheet
- Starting with Exp 3 go to the ferric iron dispensing burettes and pour solutions for reagent 1 into a 250 ml Erlenmeyer Flask, the total volume should be 50 mL.
- Remember Burettes are Labeled TD and read from top to bottom!
- Continuing with Exp 3 go to the iodide dispensing burettes and pour solutions for reagent 2 into a 150 ml beaker, the total volume should be 50 mL.
- Place the Erlenmeyer Flask on a white piece of paper
- Note the time and pour the contents of the beaker into the Erlenmeyer flask (you may want to use a stopwatch)
- Gently swirl the contents, then let the flask sit still and record on your data sheet the time it takes to turn blue.
- For the first trial (experiment 3) report your results to the instructor and proceed if your data is deemed acceptable.
- Repeat for experiments 1,2,4 & 5 and record the times in your data sheet (remember there are 60 seconds to a minute and so 1:20 is 80 seconds, not 120 seconds)
Part 2: Temperature Effects
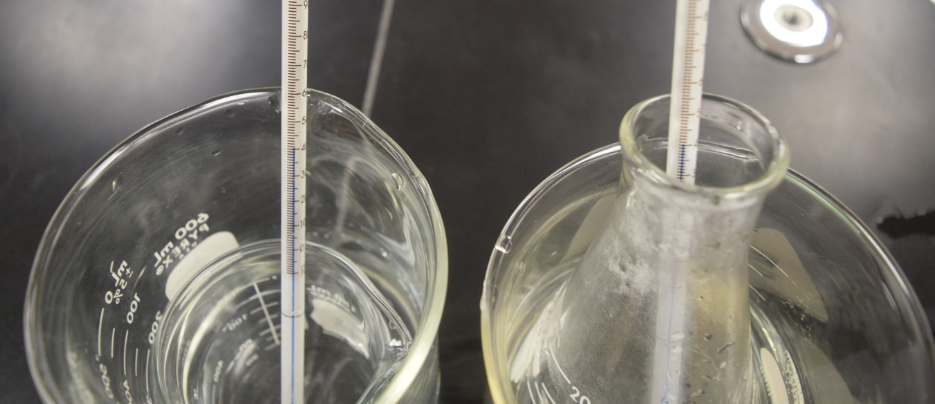 Figure \(\PageIndex{3}\): Iodine solution in left and ferric iron in the right in hot water bath where both solutuions are at same temperature (40 oC). (Copyright; Bob Belford CC0)
- Repeat steps 2 & 3 from part 1 for the reagents in Exp 3.
- Take two 600 mL beakers pour about 3/4 inch hot tap into the first and about 1.5 inches in the second. Add the 150 mL beaker with iodide solution to the shallower flask and the 250 mL Erlenmeyer flask to the deeper one.
- Place thermometers in both solutions and wait until they reach the same constant temperature, which needs to be around 10 degrees higher than room temperature (figure \(\PageIndex{3}\)). If needed, carefully replace the hot water in the bath (being sure not to get any into the reagent flasks)
- Do not heat above 52 oC.
- Remove the thermometer from the 150 mL beaker and carefully transfer the solution to the 250 mL Erelenmeyer Flask and record the time it takes to turn blue
- Record the time it takes to turn blue after the solutions are mixed.
- Record the temperature at the time you mixed the solutions and at the time it turned blue.
- Repeat the above procedures using a cold water bath instead of hot water bath.
- Pour cold water into one of the 600 mL beakers until it has about 2.5 inches deep and measure the temperature. You want it to be about 10 degrees colder than room temperature. If necessary add an ice cube (but make sure it all melts before proceeding)
- When you are happy with the temperature pour some of the water into the other 600 mL beaker so it is around 3/4 inch deep. Now proceed to add the 150 mL beaker to the shallow water bath and the 250 Erlenmeyer flask to the deeper, and repeat steps 3 and 4, just using a cold water bath instead of a hot one.
- NOTE: the chances of the temperature changing during the cold experiment is greater than the hot, as it takes longer.
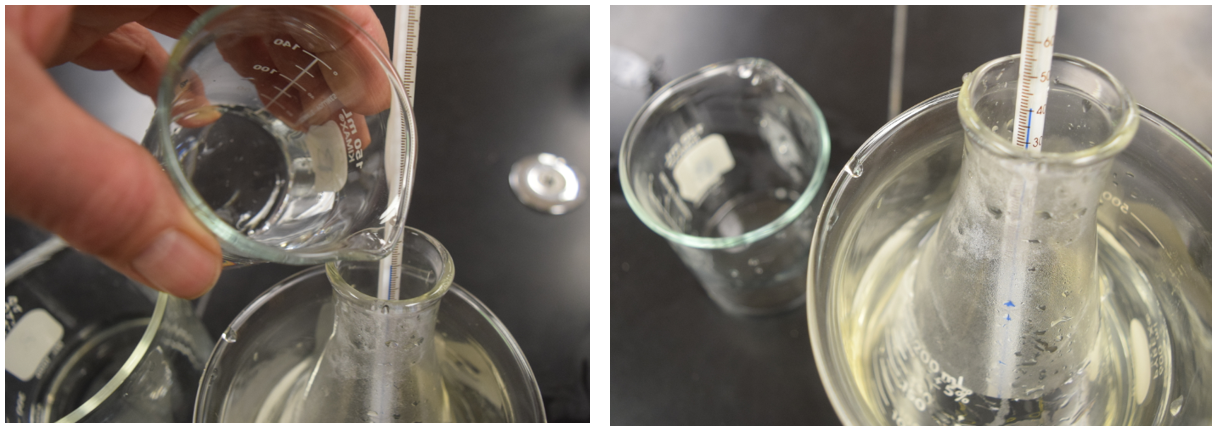 Figure \(\PageIndex{4}\): After the two solutions have reached the same constant temperature transfer the solution in the beaker to the Erlenmeyer flask. Start your stopwatch the moment you mix them, keep the flask in its water bath and record the temperature right after you mix them, and the moment it turns blue. In the ice bath it may change during the process and you will need to decide the best temperature to use. (Copyright; Bob Belford CC0)
Part 3: Upload data to class sheet
THIS SHOULD BE DONE DURING CLASS, and you can use the SCLB 263 computer lab if needed. If you can not do this during class you have up to four hours after class to complete the task or the instructor will upload your data and everyone in your group will lose 10 points.
- Identify a student who will upload your data to the class data sheet.
- Go to the class data sheet (links for each lab section are in the Downloads & Forms).
- Insert your data (figure \(\PageIndex{5}\))
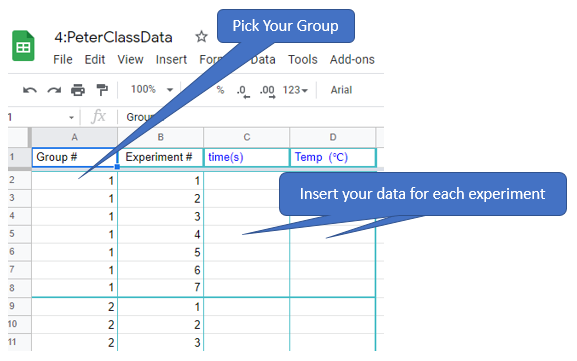 Figure \(\PageIndex{5}\): Copy and Paste Caption here. (Copyright; author via source)
- email your lab instructor and your lab partners that you have completed the task. This needs to be done within 4 hours of completion of the lab or the instructor will upload your data and everyone in your group will lose 10 points.
Tips for getting good data
- Place a piece of white paper under the Erlenmeyer Flask so you can clearly see blue.
- Have the same person pour from the beaker into the Erlenmeyer Flask and do so in a consistent manner.
- Have the same person "read the blue" for all experiments and do so at a consistent color.
- If possible use a stop watch to read the time.
- Gently swirl the flask for 5 seconds and then leave alone. Be consistent with all experiments. Although it would be nice to swirl all the time, it will be difficult to do so consistently, especially for the low temperature run that will take a long time.
- Assign one student to Reagent 1 and another to reagent 2. Do not stock pile the solutions, that is, do not collect reagents for multiple runs at once.
- Be careful reading burettes. Remember, they read from top to bottom, so the mark that is half way above the number 20 is 19.5, not 20.5
- For the non room temperature experiments you may want to record any temperature changes that occur during the course of the experiment.
Data Analysis
We need to develop three graphs and want to do this with the least number of solutions.
- Graph 1: Experiments 1-3: Order of rxn with respect to [Fe+3 ] at T3 = room, [I-]= constant.
- Graph 2: Experiments 3-5: Order of rxn with respect to [I-] at T3 = room, [Fe+3] = constant
- Graph 3: Experiment 3: Arrhenius constant, at different T3 , with [Fe+3] and [I-] held constant
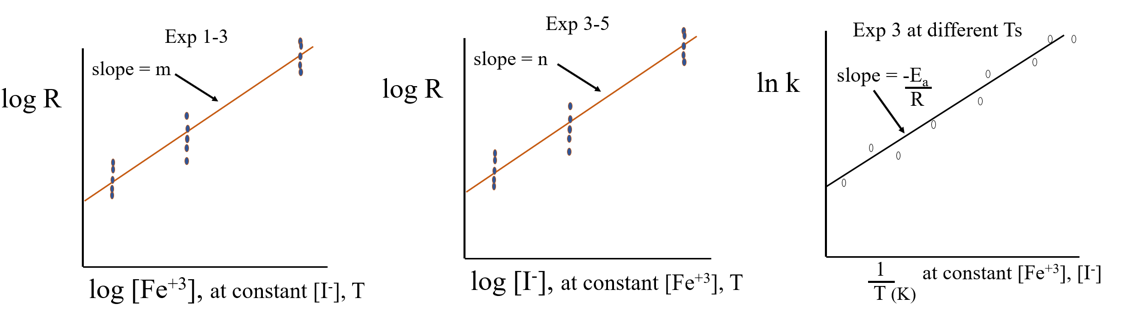 Figure \(\PageIndex{1}\): Three graphs we will be collecting data for. (CC-BY; Belford)
Cover Page
As always the first page of the Workbook is the Cover Page (figure \(\PageIndex{5}\)) and on this you will post your answers and Copies of the three graphs (from the other pages of the workbook, which can be accessed via the tabs at the bottom of the page).
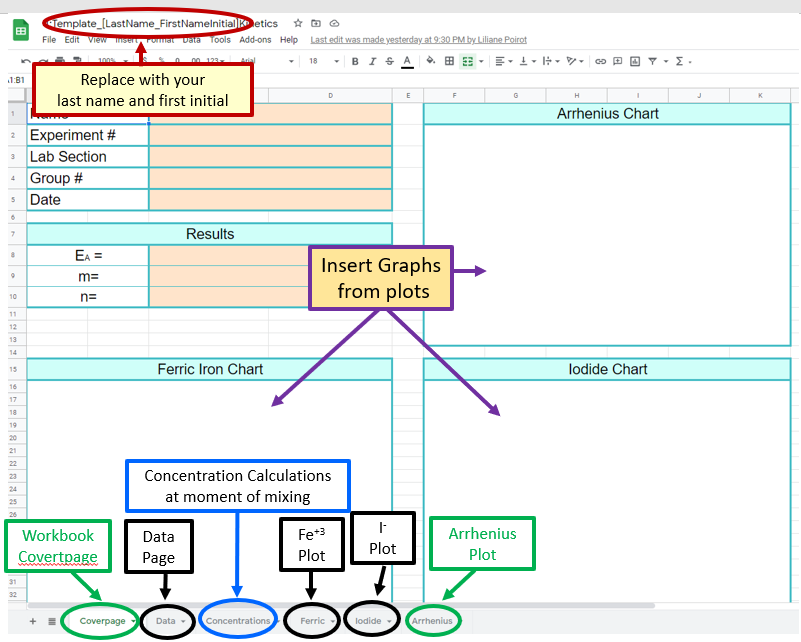 Figure \(\PageIndex{5}\): Screen Capture of the Front Page of the Google Sheet's Workbook and Paste Caption here. (Belford)
Be sure to replace the [Template_[Last_Firstname_Initial] with your lastname and initial, like Belford_B
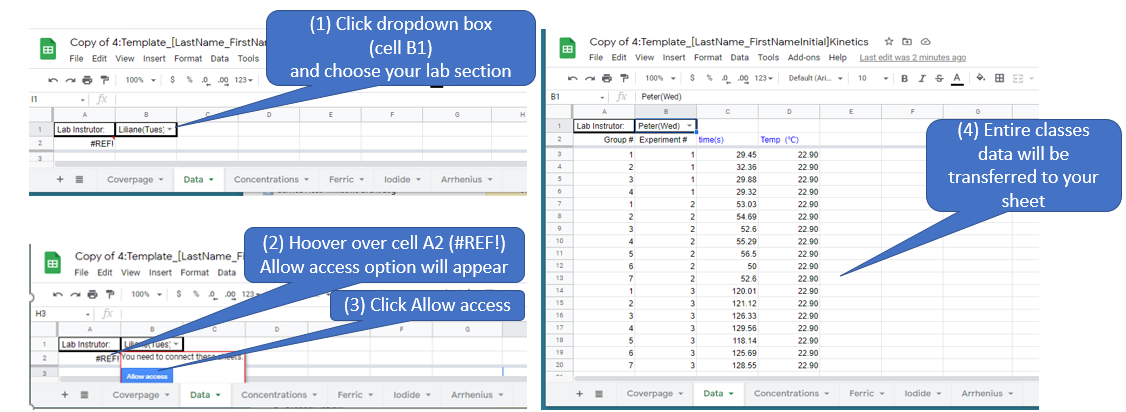
Data Page
The Data tab takes you to the Data Sheet. The class is pooling data and right after class you must uploaded your data a special Google Sheet (see Downloads and Forms in Section 4.3). The data sheet allows you to obtain that data from the entire class and insert it into your own workbook. If your group does not upload your data within 4 hours of the end of the lab your instructor will do it for you and deduct 10 points of off everyone in your groups lab grade. The instructor will then check the data and once all data is uploaded the instructor will lock the sheet and email the entire class to let you know that all sections have uploaded their data and you can proceed to work up the results.
Note, do not start working up the data until the instructor notifies you that the entire class's data has been uploaded.
Concentration Page
You goal is to calculate the Rate at t=0 (moment of mixing) as the reaction starts the moment the two solutions are mixed. Table \(\PageIndex{1}\) gives all volumes and concentrations used. If both of the above flasks have 50 mL the total of the combined solution will be 100 mL. To calculate the concentration of any reagent at the moment of mixing you use the dilution equation, please review section 4.4.3
\[M_iV_i=M_fV_f\]
Where Mi is the initial Molarity (added to either reagent flask), Vi is the initial volume (added to either reagent flask), Mf is the final molarity (in the reaction flask) and Vf is the final volume of the mixture (100 ml). So
\[M_f=M_i \frac{V_i}{V_f}\]
note, the term \(\frac{V_i}{V_f}\) is often called the dilution factor, and is dimensionless if both volumes have the same units.
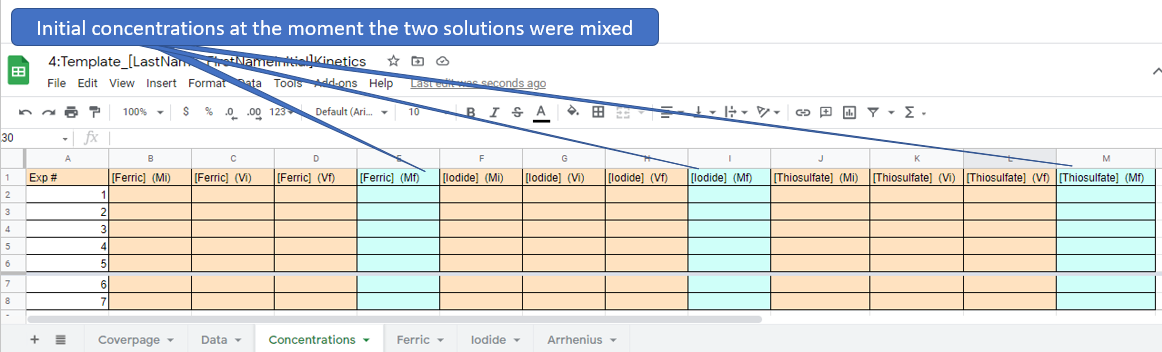 Figure \(\PageIndex{7}\): Copy and Paste Caption here. (Copyright; author via source)
There are actually only 5 different concentrations used as experiment 3,6 and 7 had identical concentrations. Before proceeding with the log/log and Arhenius plots you need to determine the concentrations of the ferric, iodide and thiosulfate ions. NOTE: it is advised that you learn how to use functions and you may want to review section 0.3 on Data Manipulation in Google Sheets. That is, you can place a function in the blue cells that pulls data from the brown cells and save yourself a lot of time.
Review Mathematics in Google Sheets Video
This video goes over making a formula
- Instructions
-
You can do simple calculations using formulas. Start all formulas by typing =
Addition +
Subtraction -
Multiplication *
Division /
Exponent ^
Parentheses ()
So for example if we can use the sheet to calculate the gravitational force between two objects
Video \(\PageIndex{1}\): 1:40 Video example of how to do basic calculations in sheets ()
Figure \(\PageIndex{1}\): Calculating the gravitational force of two objects. Formula used : =D2*((A2*B2)/C2^2) (Poirot)
- Lets look at how we could write the formula for the dilution equation. In cell with reference ID of E2 we could write =(Cell Ref1)*(Cell Ref2)/(Cell Ref3) where the Cell Ref# is the ID like A1 of a cell with data used in that experiment. Once we have loaded the equation with the proper data we hit enter and it calculates the value. We then use the small black square to scroll down and calculate those values for all the other rows of data.
Hint \(\PageIndex{1}\)
This hint shows a shortcut for inserting data
- Hint
-
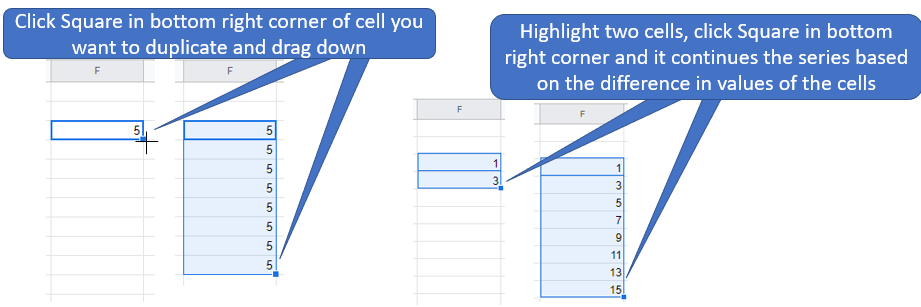
Figure \(\PageIndex{4}\): Highlighting a cell and dragging will copy its content while highlighting two cells and dragging creates a series of values based on the difference of the two cells(Bob Belford; LibreTexts CC0)
Ferric Ion Page
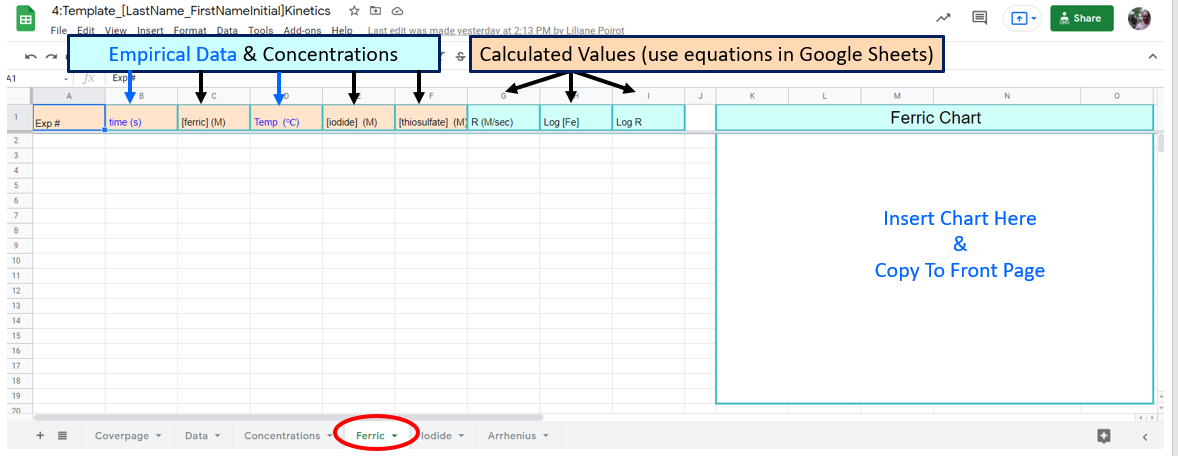 Figure \(\PageIndex{8}\): Note the blue text data is taken from the data tab and the black text values are taken from the concentration tab. You may want to "paste values" (when you paste do a "right click" choose "paste special" and "paste values only"
In this page of the workbook you will calculate "m", the order of reaction with respect to ferric iron by working up data from three experiments where [iodide] and T are constant.
\[R=k[Fe^{+3}]^m[I^-]^n\] reduces down to \[R=k'[Fe^{+3}]^m \\ \; \\ \text{and you can determine the value of the exponent in a log-log plot} \\ \; \\ logR=mlog[Fe^{+3}] + logk' \]
where \(k'=k[I^-]^n\)
Note how all the data for Iodide is constant, and you never used it in your equations.
Lets look at some of the functions you could write based on your data and the above spreadsheet. From section 4.2.3 we saw
\[R=\frac{\Delta [S_2O_3^{-2}]}{\Delta t}\]
and so you should use functions for calculating R, log[Fe] and log[R]. In fact you could skip the R column, but we want you to do it.
Hint \(\PageIndex{1}\)
This hint has a screenshot on pasting values.
- Answer
-
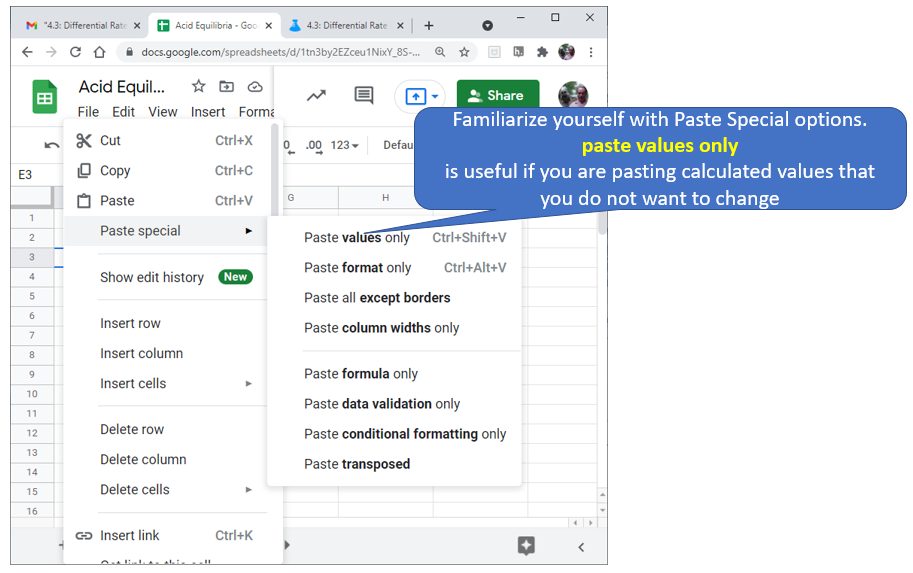 Figure \(\PageIndex{5}\): Familiarize yourself with options like paste value only. (Copyright; author via source)
Iodide Ion Page
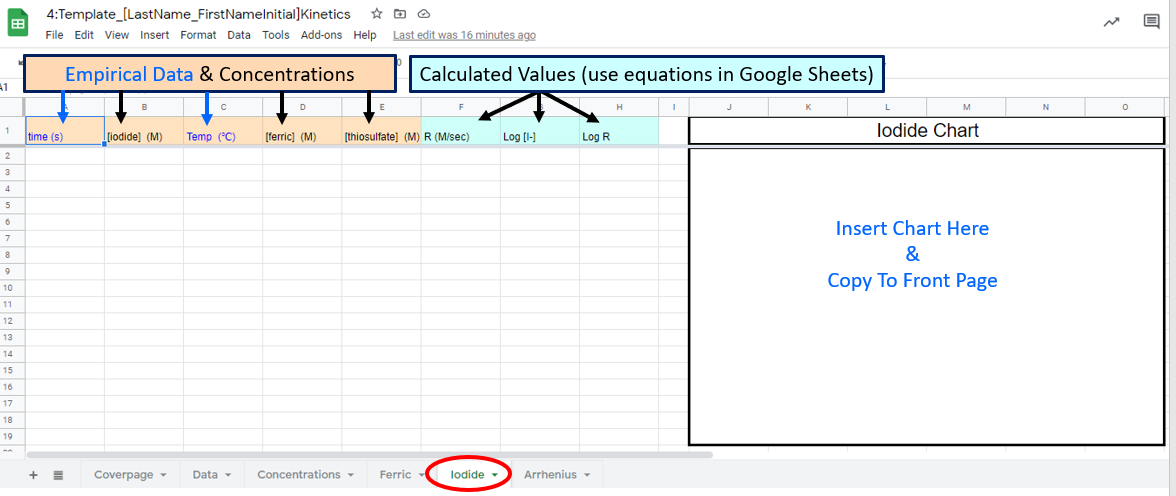 Figure \(\PageIndex{8}\): Google Sheet students need to fill out
In this page of the workbook you will calculate "n", the order of reaction with respect to iodide by working up data from experiments where you kept [ferric ion] and Temperature constant. You should also use calculations with your Google Sheets, and properly label all axis on the graph (chart).
\[R=k[Fe^{+3}]^m[I^-]^n\] reduces down to \[R=k''[I^{-}]^n] \\ \; \\ \text{and you can determine the value of the exponent in a log-log plot} \\ \; \\ logR=nlog[I^{-}] + logk'' \]
where \(k''=k[Fe^{+3}]^m\)
Arrhenius Graph
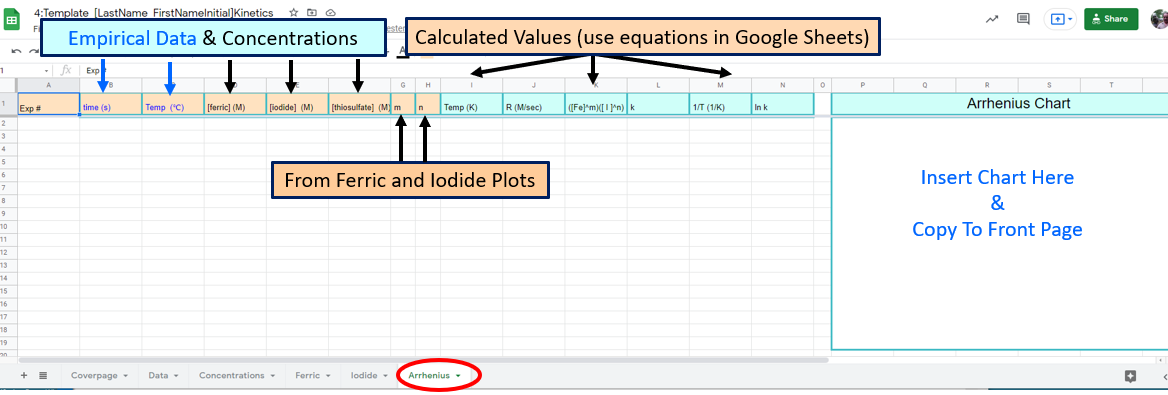 Figure \(\PageIndex{9}\): Google Sheet students need to fill
This is the most complicated graph, you need to report the Arrhenius constant and plot all the appropriate data where the ferric iron and iodide constants were held constant, which was experiment three, You will also need to use the orders of reaction from the ferric iron and iodide pages.
Note, you could have calculated the lnk in one equation but we had you solve it in 4 If you look at the Rate Law, where R stands for the reaction rate
\[R=k[Fe^{+3}]^m[I^-]^n\] can be solved for k
\[k=\frac{R}{[Fe^{+3}]^m[I^-]^n} \] and the denominator of this equation is column J of the spreadsheet. It is important that you use the spreadsheet as structured as there is a grading template that will validate your work, and that uses this framework. But yes, you could have skiped columns I,J and K and gone straight to lnk (Column M), but our goal is to get you to look at the chemistry, and so we broke this into steps that had meaning, and would hopefully be easier to follow.
It should be noted that the k here is the k of the Arrhenius equation \[k=Ae^-\frac{E_A}{RT}\] (where R stands for the ideal gas constant) and we are plotting the natural log form of it
\[lnk = -\frac{E_A}{R}\left ( \frac{1}{T} \right ) + lnA\] and the slope of the line is equal to -\(\frac{E_A}{R}\).
Hint \(\PageIndex{1}\)
You can copy data from exp 1-3 from the ferric ion page and experiments 4 & 5 from the iodide page (use paste values)
- Answer
-
Figure \(\PageIndex{5}\): Familiarize yourself with options like paste value only. (Copyright; author via source)