
12.5: Phase Diagrams
- Page ID
- 43273

\( \newcommand{\vecs}[1]{\overset { \scriptstyle \rightharpoonup} {\mathbf{#1}} } \)
\( \newcommand{\vecd}[1]{\overset{-\!-\!\rightharpoonup}{\vphantom{a}\smash {#1}}} \)
\( \newcommand{\id}{\mathrm{id}}\) \( \newcommand{\Span}{\mathrm{span}}\)
( \newcommand{\kernel}{\mathrm{null}\,}\) \( \newcommand{\range}{\mathrm{range}\,}\)
\( \newcommand{\RealPart}{\mathrm{Re}}\) \( \newcommand{\ImaginaryPart}{\mathrm{Im}}\)
\( \newcommand{\Argument}{\mathrm{Arg}}\) \( \newcommand{\norm}[1]{\| #1 \|}\)
\( \newcommand{\inner}[2]{\langle #1, #2 \rangle}\)
\( \newcommand{\Span}{\mathrm{span}}\)
\( \newcommand{\id}{\mathrm{id}}\)
\( \newcommand{\Span}{\mathrm{span}}\)
\( \newcommand{\kernel}{\mathrm{null}\,}\)
\( \newcommand{\range}{\mathrm{range}\,}\)
\( \newcommand{\RealPart}{\mathrm{Re}}\)
\( \newcommand{\ImaginaryPart}{\mathrm{Im}}\)
\( \newcommand{\Argument}{\mathrm{Arg}}\)
\( \newcommand{\norm}[1]{\| #1 \|}\)
\( \newcommand{\inner}[2]{\langle #1, #2 \rangle}\)
\( \newcommand{\Span}{\mathrm{span}}\) \( \newcommand{\AA}{\unicode[.8,0]{x212B}}\)
\( \newcommand{\vectorA}[1]{\vec{#1}} % arrow\)
\( \newcommand{\vectorAt}[1]{\vec{\text{#1}}} % arrow\)
\( \newcommand{\vectorB}[1]{\overset { \scriptstyle \rightharpoonup} {\mathbf{#1}} } \)
\( \newcommand{\vectorC}[1]{\textbf{#1}} \)
\( \newcommand{\vectorD}[1]{\overrightarrow{#1}} \)
\( \newcommand{\vectorDt}[1]{\overrightarrow{\text{#1}}} \)
\( \newcommand{\vectE}[1]{\overset{-\!-\!\rightharpoonup}{\vphantom{a}\smash{\mathbf {#1}}}} \)
\( \newcommand{\vecs}[1]{\overset { \scriptstyle \rightharpoonup} {\mathbf{#1}} } \)
\( \newcommand{\vecd}[1]{\overset{-\!-\!\rightharpoonup}{\vphantom{a}\smash {#1}}} \)
\(\newcommand{\avec}{\mathbf a}\) \(\newcommand{\bvec}{\mathbf b}\) \(\newcommand{\cvec}{\mathbf c}\) \(\newcommand{\dvec}{\mathbf d}\) \(\newcommand{\dtil}{\widetilde{\mathbf d}}\) \(\newcommand{\evec}{\mathbf e}\) \(\newcommand{\fvec}{\mathbf f}\) \(\newcommand{\nvec}{\mathbf n}\) \(\newcommand{\pvec}{\mathbf p}\) \(\newcommand{\qvec}{\mathbf q}\) \(\newcommand{\svec}{\mathbf s}\) \(\newcommand{\tvec}{\mathbf t}\) \(\newcommand{\uvec}{\mathbf u}\) \(\newcommand{\vvec}{\mathbf v}\) \(\newcommand{\wvec}{\mathbf w}\) \(\newcommand{\xvec}{\mathbf x}\) \(\newcommand{\yvec}{\mathbf y}\) \(\newcommand{\zvec}{\mathbf z}\) \(\newcommand{\rvec}{\mathbf r}\) \(\newcommand{\mvec}{\mathbf m}\) \(\newcommand{\zerovec}{\mathbf 0}\) \(\newcommand{\onevec}{\mathbf 1}\) \(\newcommand{\real}{\mathbb R}\) \(\newcommand{\twovec}[2]{\left[\begin{array}{r}#1 \\ #2 \end{array}\right]}\) \(\newcommand{\ctwovec}[2]{\left[\begin{array}{c}#1 \\ #2 \end{array}\right]}\) \(\newcommand{\threevec}[3]{\left[\begin{array}{r}#1 \\ #2 \\ #3 \end{array}\right]}\) \(\newcommand{\cthreevec}[3]{\left[\begin{array}{c}#1 \\ #2 \\ #3 \end{array}\right]}\) \(\newcommand{\fourvec}[4]{\left[\begin{array}{r}#1 \\ #2 \\ #3 \\ #4 \end{array}\right]}\) \(\newcommand{\cfourvec}[4]{\left[\begin{array}{c}#1 \\ #2 \\ #3 \\ #4 \end{array}\right]}\) \(\newcommand{\fivevec}[5]{\left[\begin{array}{r}#1 \\ #2 \\ #3 \\ #4 \\ #5 \\ \end{array}\right]}\) \(\newcommand{\cfivevec}[5]{\left[\begin{array}{c}#1 \\ #2 \\ #3 \\ #4 \\ #5 \\ \end{array}\right]}\) \(\newcommand{\mattwo}[4]{\left[\begin{array}{rr}#1 \amp #2 \\ #3 \amp #4 \\ \end{array}\right]}\) \(\newcommand{\laspan}[1]{\text{Span}\{#1\}}\) \(\newcommand{\bcal}{\cal B}\) \(\newcommand{\ccal}{\cal C}\) \(\newcommand{\scal}{\cal S}\) \(\newcommand{\wcal}{\cal W}\) \(\newcommand{\ecal}{\cal E}\) \(\newcommand{\coords}[2]{\left\{#1\right\}_{#2}}\) \(\newcommand{\gray}[1]{\color{gray}{#1}}\) \(\newcommand{\lgray}[1]{\color{lightgray}{#1}}\) \(\newcommand{\rank}{\operatorname{rank}}\) \(\newcommand{\row}{\text{Row}}\) \(\newcommand{\col}{\text{Col}}\) \(\renewcommand{\row}{\text{Row}}\) \(\newcommand{\nul}{\text{Nul}}\) \(\newcommand{\var}{\text{Var}}\) \(\newcommand{\corr}{\text{corr}}\) \(\newcommand{\len}[1]{\left|#1\right|}\) \(\newcommand{\bbar}{\overline{\bvec}}\) \(\newcommand{\bhat}{\widehat{\bvec}}\) \(\newcommand{\bperp}{\bvec^\perp}\) \(\newcommand{\xhat}{\widehat{\xvec}}\) \(\newcommand{\vhat}{\widehat{\vvec}}\) \(\newcommand{\uhat}{\widehat{\uvec}}\) \(\newcommand{\what}{\widehat{\wvec}}\) \(\newcommand{\Sighat}{\widehat{\Sigma}}\) \(\newcommand{\lt}{<}\) \(\newcommand{\gt}{>}\) \(\newcommand{\amp}{&}\) \(\definecolor{fillinmathshade}{gray}{0.9}\)Introduction
So far we have covered 6 phase transitions, 4 involving solids.
Sublimation (solid --> gas)
Deposition (gas--> solid)
Fusion (solid --> liquid)
Freezing (liquid --> solid)
evaporation (liquid --> gas)
condensation (gas --> liquid)
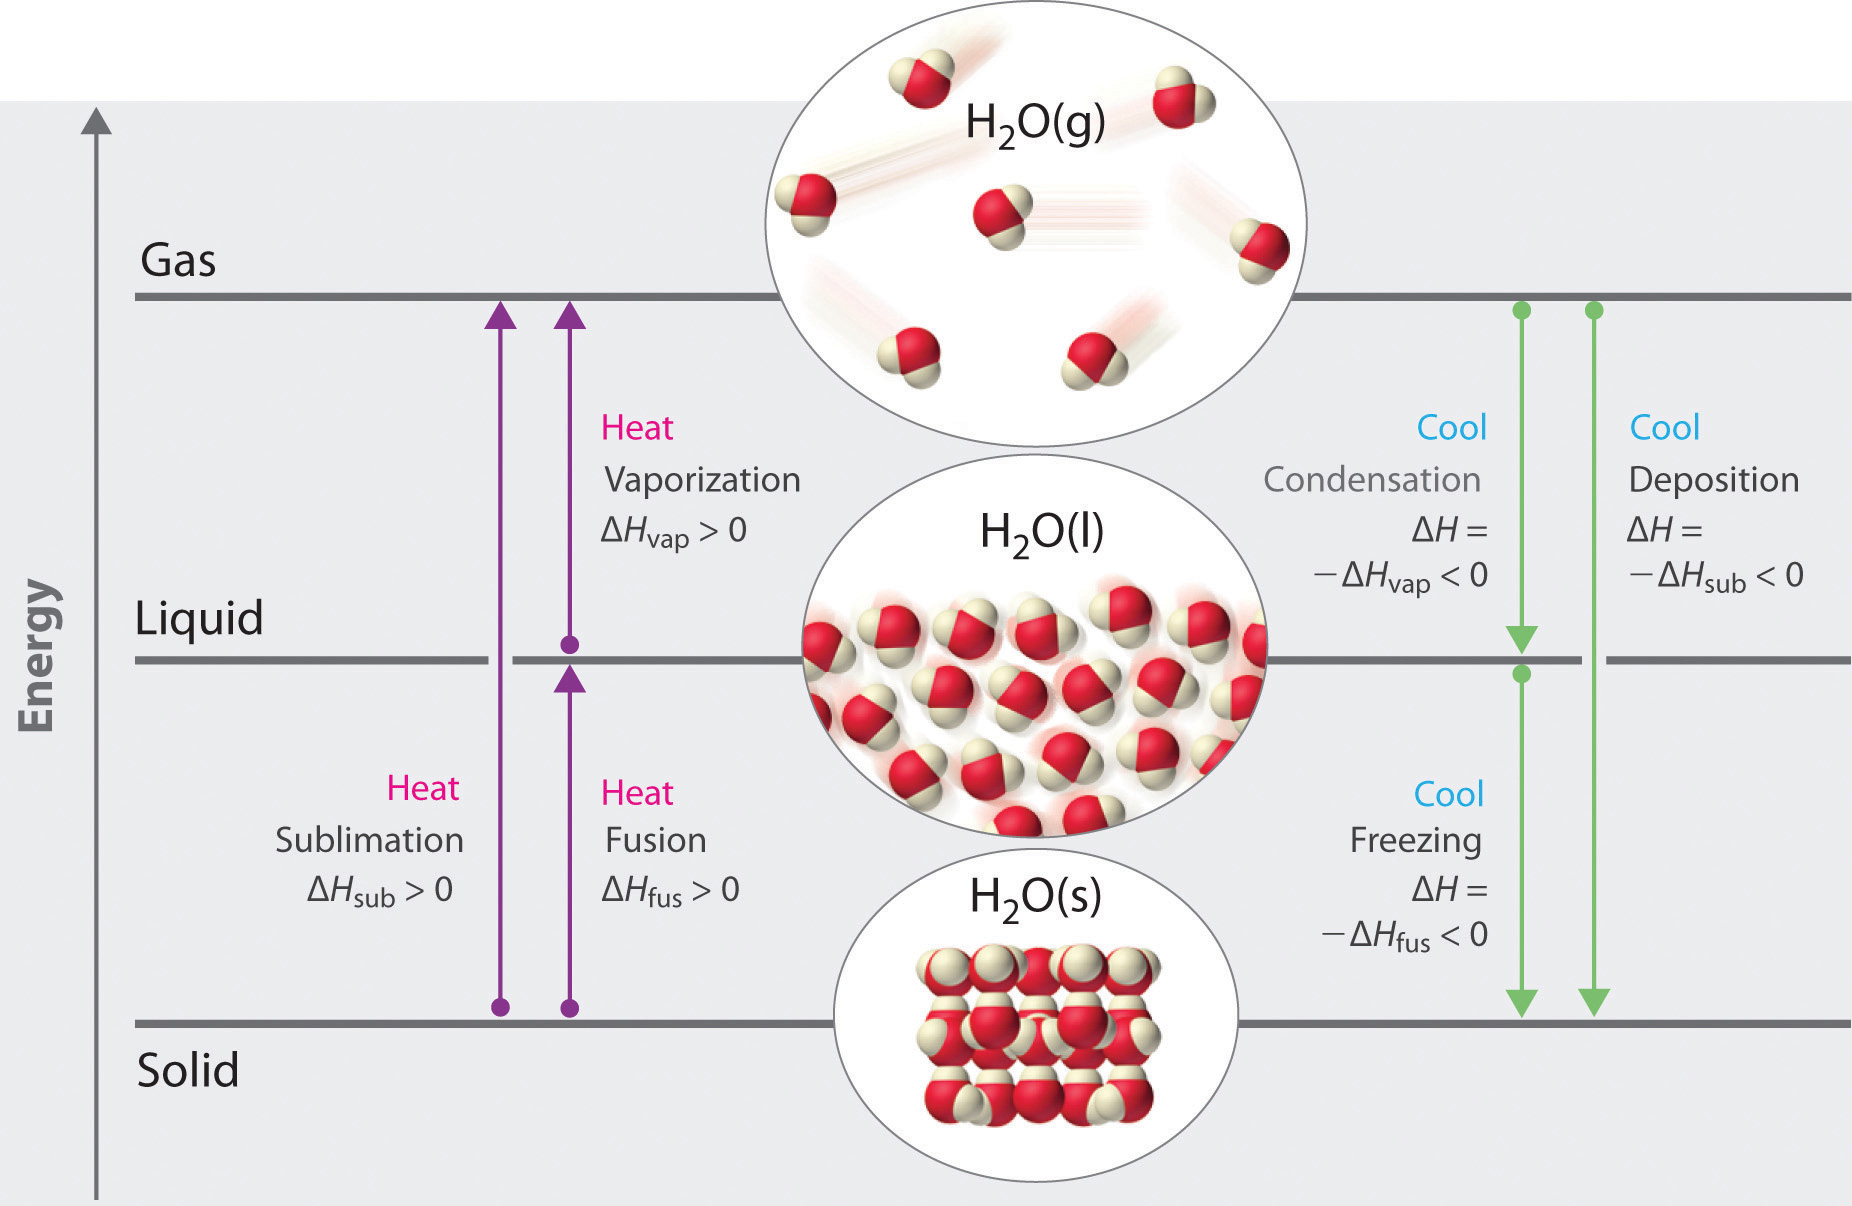 Figure \(\PageIndex{1}\): 6 phase transitions
Sublimation
Iodine is a substance that sublimes, as can be seen in the following YouTube.
Video \(\PageIndex{1}\): 1:39 min YouTube demonstrating the sublimation and deposition of iodine (https://youtu.be/jX9pskbKSw0)
This Youtube shows Iodine subliming at room temperature (an endothermic process absorbing energy), and then they place a cold surface above it, and demonstrate deposition as the vapor converts directly to a solid (an exothermic process).
Carbon dioxide (dry ice) is a common substance that sublimes, and liquid carbon dioxide can not exist at atmospheric pressure. A phase diagram can help you predict the stable phase of matter as a function of Pressure and temperature.
Phase Diagrams
Phase diagrams describe the stable state (or states) of matter as a function of pressure and temperature, so if you know the pressure and temperature of a system, you can determine the stable state. Figure \(\PageIndex{2}\) shows a generic state diagram. We note there are four regions in this diagram (solid, liquid, gas and supercritical fluid). We also see boundary lines between the solid, liquid and gaseous phases, which describe the pressure and temperature at which the two phases can exist in equilibrium. For example, if you took a piece of solid and placed it at a P&T where that substance is stable as a liquid, the solid will melt.
At high temperature and pressure there is a fourth phase where the boundary between the two fluid phases disappears, that is represented by B, the critical point. If you increase the temperature or pressure above this point you have a supercritical fluid. That is, at high temperature the system has so much kinetic energy that it wants to act as a gas, while at high pressure the molecules are so close together that it acts as a liquid, and the boundary between the gas and liquid phase disappears, resulting in a. Supercritical fluids were introduced in chapter 11 (sec 11.6.5). You will also note a point where the three phase boundaries converge, this is the triple point (point c on the diagram.)
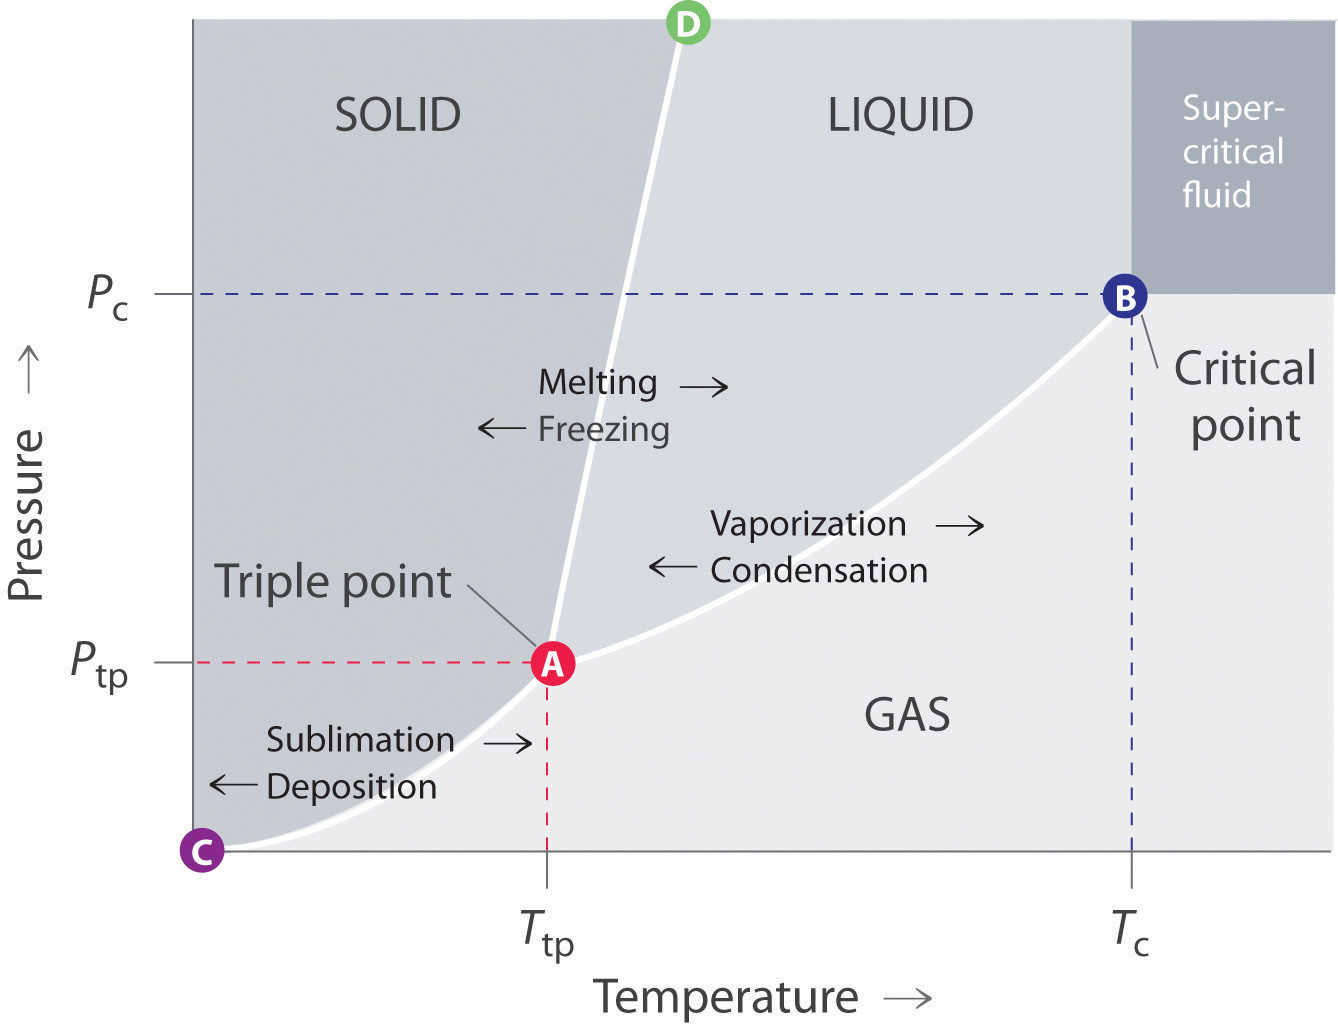 Figure \(\PageIndex{2}\): Copy and Paste Caption here. (Copyright; author via source)
Figure 12.7.a: Typical phase diagram of a substance showing solid, liquid and gaseous phases.
Features of the Phase Diagram
There are several things you need to know in a phase diagram
Regions: (phase regions)
- Solid Region - only a solid is stable in this range of P&T, (a liquid or gas would spontaneously convert to a solid).
- Liquid Region - only a liquid is stable in this range of P&T, (a solid would spontaneously melt and a gas condense).
- Gaseous Region - only a vapor is stable in this range of P&T, (solids and liquids would spontaneously convert to a vapor).
Boundaries Lines (two phase equilibrium boundaries)
- Solid/Gas Two Phase Line (pts. A to C) - both a solid and gas can coexist in equilibrium at these T&P, adding heat causes sublimation, removing it causes deposition.
- Solid/Liquid Two Phase Line (pts. A to D) - both solid and liquid can coexist in equilibrium at these T&P, adding heat causes melting, removing it causes freezing.
- Liquid/Gas Two Phase Line (pts. A to C) - both liquid and gas can coexist in equilibrium at these T&P, adding heat causes vaporization, removing it causes condensation.
Points
- Triple Point (point A) - the pressure and temperature at which all three phases can coexist. Note, up until May 20, 2019 the definition of the Kelvin (and degree Celsius) is 1/273.16 the triple point of water. Today the Kelvin is based on 4 fundamental constants (Boltzmann's, Planck's, speed of light and Cs frequency, see section 1B.3.3.1.2)
- Critical Point (point B) - the highest temperature and pressure at which there is a phase boundary between a gas and a liquid (see section 4 of 11.6)
Note most systems are not energetically isolated. A substance on the solid/liquid equilibrium line would maintain a constant ratio of the solid to liquid as long as no energy was entering or leaving the system. So we say two phases can coexist and be stable in a two phase region, you could have a stable system as 25% water and 75% ice and it would not change over time, but if heat entered, ice would melt, and if heat left, water would freeze. At the triple point three regions can coexist in equilibrium.
Video \(\PageIndex{2}\): 10:52 min Youtube uploaded by Georgianna Allen that describes the regions of a phase diagram and phase changes involved with isothermal and isobaric paths. (https://youtu.be/ejg27ozbPA8)
Triple Point
The triple point is the temperature and pressure where all three phases are stable and can coexist in an isolated system where no energy is being added or lost. As there is only one temperature and pressure where all three phases can coexist, the triple point is an exact point that can be reproduced in the laboratory. Because of this, it is used to define the SI unit of temperature, the Kelvin, which is defined as 1/273.16 the triple temperature of water (P,T = 0.0060373 atm, 273.16K). This is also the definition of the Celsius degree, which is much better than the centigrade scale, which is 1/00 the difference between the boiling and freezing point of water at 1 atm (which is harder to reproduce in the lab). It should also be noted that the slope of the solid/liquid equilibrium line of water of figure 12.7.d is exaggerated to show that it is negative, and the normal freezing point of water is 273.15K .
YoutubePageIndex{3}\): 2:05 min Youtube video of Triple Point demonstration of Tert-Butyl, (is https://youtu.be/BLRqpJN9zeA).
Critical Point
At pressures and temperatures above the critical point the boundary between the two fluid phases (gas and liquid) disappear and you have a supercritical fluid (section 11.6.6). One of the goals of green chemistry (sec 1A.2) is to reduce waste streams, which often are the results of solvents used in synthesis processes. In the next section (sec. 13.0) we will learn that "like dissolves in like", that is, polar solvents dissolve polar compounds and nonpolar solvents dissolve nonpolar compounds. Supercritical carbon dioxide are green alternatives to common organic solvents like benzene and carbon tetrachloride, both of which are toxic and dangerous to the environment. The following YouTube uses a phase diagram to show how supercritical carbon dioxide is used to extract an organic compound from plant matter, the pressure is then lowered below the critical point and the CO2 turns to a gas and is separated from the solute, and then recompressed back to a supercritical fluid and recycled, removing the solvent from the waste stream.
Video \(\PageIndex{4}\): 1:56 min Youtube on "The Science Behind Supercritical CO2 Extraction". (https://youtu.be/AipBc6yBOF4)
Isobaric and Isothermal Transitions
- Isobar - Horizontal path along phase diagram (at constant pressure).
- Isotherm - Vertical path along phase diagram (at constant temperature).
Isobaric Transitions
(Isos = Greek for "equal", Barps = Greek for weight, although isobar actually means constant pressure, as in barometric pressure and not weight).
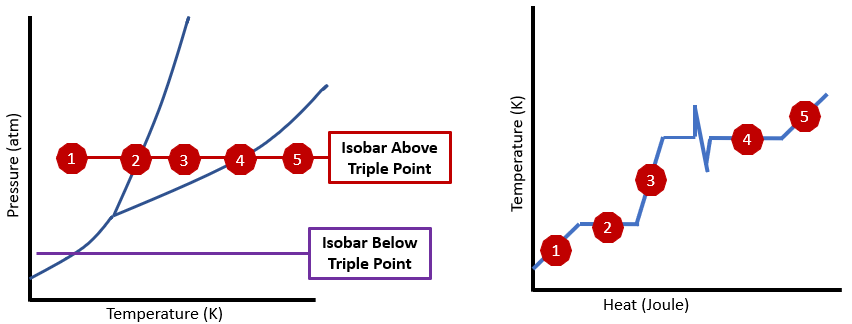 Figure \(\PageIndex{3}\): Phase diagram for water showing two isobaric transitions (left) above the triple point (red) and below the triple point (purple), and heating curve for water (right) correlated to the isobaric transition above the triple point (red). (CC.0 Bob Belford)
The left part of \(\PageIndex{3}\) shows two isobaric transitions for converting a solid to a gas. The top transition is above the triple point and so liquid water is stable, while the lower transition is below the triple point and the solid sublimes to a gas without ever forming a liquid phase. The graph on the right represents a heating curve as covered in gen chem 1 (sec 5.3.3).
- Represents a region on both diagrams related to heating ice from -10 to the freezing point and the heat Q1=mcsolid\(\Delta\)T
- Is a point on the phase diagram and the region on the heating curve related to melting the ice, Q2 = n\(\Delta\)Hfus.
- Represents a region on both diagrams related to heating ice from -10 to the freezing point and the heat Q3=mliquid\(\Delta\)T
- Is a point on the phase diagram and the region on the heating curve related to melting the ice, Q4 = n\(\Delta\)Hvap.
- Represents a region on both diagrams related to heating ice from -10 to the freezing point and the heat Q5=mcvap\(\Delta\)T
It is important to understand the relationship of these graphs and the differences. The phase diagram represents the phase that would exist for a system at equilibrium as a function of the pressure and temperature. The right diagram shows how the temperature changes as heat is added (or lost), which if done at constant pressure, moves a substance along an isobar on the phase diagram. The numbers in red of the two diagrams correlate to each other.
Isothermal Transition
(Isos = Greek for "equal", Therme = Greek for heat, although isotherm actually means constant temperature, not heat)
An isothermal is a vertical line, as in figure
Figure 12.7.c.
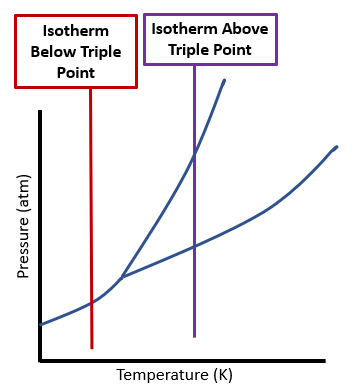 Figure \(\PageIndex{4}\): Two isothermal transitions where on the left, a solid sublimes to a gas, while on the right, it first melts and then vaporizes. (CC0 Bob Belford)
Figure 12.7.d, Phase diagram of carbon dioxide (left) and water (right).
There are several things to note in figure 12.7.d. First, the solid/liquid equilibrium line has a negative slope for water and a positive slope for carbon dioxide, with the consequence that ice floats. This is very rare, as most solid phases are more dense than liquid, and sink, not float in their own liquid. Second, the normal isobar (1 atm) is below the triple point for carbon dioxide and above the triple point for water, which is why carbon dioxide sublimes and gaseous carbon dioxide can not be cooled to a liquid, while water can form a liquid at atmospheric pressure.
Additional Information
Many substance have more than one stable solid phase and phase diagrams are useful in identifying the conditions required for each phase. For example, water has multiple crystal structures, and a phase diagram of carbon can tell you which conditions favor diamond over graphite

Figure \(\PageIndex{5}\): Phase diagram of Carbon (Public Domain, Wikimedia Commons) and water (CC 3.0, author uncertain, WikiMedia Commons)
As the above two phase diagrams demonstrate, there can be more than one stable phase to a substance, in fact there are 18 phases of water.
In Class Activities
ADAPT \(\PageIndex{1}\)
Contributors and Attributions
Robert E. Belford (University of Arkansas Little Rock; Department of Chemistry). The breadth, depth and veracity of this work is the responsibility of Robert E. Belford, rebelford@ualr.edu. You should contact him if you have any concerns. This material has both original contributions, and content built upon prior contributions of the LibreTexts Community and other resources, including but not limited to:
Robert E. Belford (University of Arkansas Little Rock; Department of Chemistry). The breadth, depth and veracity of this work is the responsibility of Robert E. Belford, rebelford@ualr.edu. You should contact him if you have any concerns. This material has both original contributions, and content built upon prior contributions of the LibreTexts Community and other resources, including but not limited to:
Images from Chris Schaller, Wikipedia