
5.3: Energy and Phase Transitions
- Page ID
- 158434
\( \newcommand{\vecs}[1]{\overset { \scriptstyle \rightharpoonup} {\mathbf{#1}} } \)
\( \newcommand{\vecd}[1]{\overset{-\!-\!\rightharpoonup}{\vphantom{a}\smash {#1}}} \)
\( \newcommand{\id}{\mathrm{id}}\) \( \newcommand{\Span}{\mathrm{span}}\)
( \newcommand{\kernel}{\mathrm{null}\,}\) \( \newcommand{\range}{\mathrm{range}\,}\)
\( \newcommand{\RealPart}{\mathrm{Re}}\) \( \newcommand{\ImaginaryPart}{\mathrm{Im}}\)
\( \newcommand{\Argument}{\mathrm{Arg}}\) \( \newcommand{\norm}[1]{\| #1 \|}\)
\( \newcommand{\inner}[2]{\langle #1, #2 \rangle}\)
\( \newcommand{\Span}{\mathrm{span}}\)
\( \newcommand{\id}{\mathrm{id}}\)
\( \newcommand{\Span}{\mathrm{span}}\)
\( \newcommand{\kernel}{\mathrm{null}\,}\)
\( \newcommand{\range}{\mathrm{range}\,}\)
\( \newcommand{\RealPart}{\mathrm{Re}}\)
\( \newcommand{\ImaginaryPart}{\mathrm{Im}}\)
\( \newcommand{\Argument}{\mathrm{Arg}}\)
\( \newcommand{\norm}[1]{\| #1 \|}\)
\( \newcommand{\inner}[2]{\langle #1, #2 \rangle}\)
\( \newcommand{\Span}{\mathrm{span}}\) \( \newcommand{\AA}{\unicode[.8,0]{x212B}}\)
\( \newcommand{\vectorA}[1]{\vec{#1}} % arrow\)
\( \newcommand{\vectorAt}[1]{\vec{\text{#1}}} % arrow\)
\( \newcommand{\vectorB}[1]{\overset { \scriptstyle \rightharpoonup} {\mathbf{#1}} } \)
\( \newcommand{\vectorC}[1]{\textbf{#1}} \)
\( \newcommand{\vectorD}[1]{\overrightarrow{#1}} \)
\( \newcommand{\vectorDt}[1]{\overrightarrow{\text{#1}}} \)
\( \newcommand{\vectE}[1]{\overset{-\!-\!\rightharpoonup}{\vphantom{a}\smash{\mathbf {#1}}}} \)
\( \newcommand{\vecs}[1]{\overset { \scriptstyle \rightharpoonup} {\mathbf{#1}} } \)
\( \newcommand{\vecd}[1]{\overset{-\!-\!\rightharpoonup}{\vphantom{a}\smash {#1}}} \)
\(\newcommand{\avec}{\mathbf a}\) \(\newcommand{\bvec}{\mathbf b}\) \(\newcommand{\cvec}{\mathbf c}\) \(\newcommand{\dvec}{\mathbf d}\) \(\newcommand{\dtil}{\widetilde{\mathbf d}}\) \(\newcommand{\evec}{\mathbf e}\) \(\newcommand{\fvec}{\mathbf f}\) \(\newcommand{\nvec}{\mathbf n}\) \(\newcommand{\pvec}{\mathbf p}\) \(\newcommand{\qvec}{\mathbf q}\) \(\newcommand{\svec}{\mathbf s}\) \(\newcommand{\tvec}{\mathbf t}\) \(\newcommand{\uvec}{\mathbf u}\) \(\newcommand{\vvec}{\mathbf v}\) \(\newcommand{\wvec}{\mathbf w}\) \(\newcommand{\xvec}{\mathbf x}\) \(\newcommand{\yvec}{\mathbf y}\) \(\newcommand{\zvec}{\mathbf z}\) \(\newcommand{\rvec}{\mathbf r}\) \(\newcommand{\mvec}{\mathbf m}\) \(\newcommand{\zerovec}{\mathbf 0}\) \(\newcommand{\onevec}{\mathbf 1}\) \(\newcommand{\real}{\mathbb R}\) \(\newcommand{\twovec}[2]{\left[\begin{array}{r}#1 \\ #2 \end{array}\right]}\) \(\newcommand{\ctwovec}[2]{\left[\begin{array}{c}#1 \\ #2 \end{array}\right]}\) \(\newcommand{\threevec}[3]{\left[\begin{array}{r}#1 \\ #2 \\ #3 \end{array}\right]}\) \(\newcommand{\cthreevec}[3]{\left[\begin{array}{c}#1 \\ #2 \\ #3 \end{array}\right]}\) \(\newcommand{\fourvec}[4]{\left[\begin{array}{r}#1 \\ #2 \\ #3 \\ #4 \end{array}\right]}\) \(\newcommand{\cfourvec}[4]{\left[\begin{array}{c}#1 \\ #2 \\ #3 \\ #4 \end{array}\right]}\) \(\newcommand{\fivevec}[5]{\left[\begin{array}{r}#1 \\ #2 \\ #3 \\ #4 \\ #5 \\ \end{array}\right]}\) \(\newcommand{\cfivevec}[5]{\left[\begin{array}{c}#1 \\ #2 \\ #3 \\ #4 \\ #5 \\ \end{array}\right]}\) \(\newcommand{\mattwo}[4]{\left[\begin{array}{rr}#1 \amp #2 \\ #3 \amp #4 \\ \end{array}\right]}\) \(\newcommand{\laspan}[1]{\text{Span}\{#1\}}\) \(\newcommand{\bcal}{\cal B}\) \(\newcommand{\ccal}{\cal C}\) \(\newcommand{\scal}{\cal S}\) \(\newcommand{\wcal}{\cal W}\) \(\newcommand{\ecal}{\cal E}\) \(\newcommand{\coords}[2]{\left\{#1\right\}_{#2}}\) \(\newcommand{\gray}[1]{\color{gray}{#1}}\) \(\newcommand{\lgray}[1]{\color{lightgray}{#1}}\) \(\newcommand{\rank}{\operatorname{rank}}\) \(\newcommand{\row}{\text{Row}}\) \(\newcommand{\col}{\text{Col}}\) \(\renewcommand{\row}{\text{Row}}\) \(\newcommand{\nul}{\text{Nul}}\) \(\newcommand{\var}{\text{Var}}\) \(\newcommand{\corr}{\text{corr}}\) \(\newcommand{\len}[1]{\left|#1\right|}\) \(\newcommand{\bbar}{\overline{\bvec}}\) \(\newcommand{\bhat}{\widehat{\bvec}}\) \(\newcommand{\bperp}{\bvec^\perp}\) \(\newcommand{\xhat}{\widehat{\xvec}}\) \(\newcommand{\vhat}{\widehat{\vvec}}\) \(\newcommand{\uhat}{\widehat{\uvec}}\) \(\newcommand{\what}{\widehat{\wvec}}\) \(\newcommand{\Sighat}{\widehat{\Sigma}}\) \(\newcommand{\lt}{<}\) \(\newcommand{\gt}{>}\) \(\newcommand{\amp}{&}\) \(\definecolor{fillinmathshade}{gray}{0.9}\)Learning Objectives
- Define heat of fusion and heat of vaporization
- Relate heat of fusion and heat of vaporization to heat of freezing and heat of condensation
- Label various part of a heating curve
- Using a heating curve, calculate the heat input/output associated with phase changes and temperature changes using the proper equation(s)
- Using a heating curve, calculate the final temperature for a given quantity of heat input/out.
Phase Changes
When adding or removing heat from a system, one of three things can occur:
- Temperature change within a phase (physical change)
- Phase change between two phases (physical change)
- A chemical reaction (chemical change)
In this section, we will study the process of changing phases in detail. In reality there are 4 states of matter, solid, liquid, gas and plasma, although in this class we will focus on the three common states, and their transitions.
Video 5.3.1 (0:49) YouTube describing the four states of matter
fig 5.3.1 Energy diagrams showing phase transitions. The diagram on the left shows all 4 states, while the one on the right shows the three common states. This class will not be dealing with transitions to the plasma state, but you should be aware of it. There are several things to note on the right diagram.
- Transitions going up (increased energy) are endothermic and require energy ,while those going down (decreased energy) are exothermic and release energy.
- The energies absorbed in the endothermic steps are identical in magnitude to the energies released in the exothermic steps for the same transition, but opposite in direction.
ΔHFusion = -ΔHFreezing
ΔHVaporization = -ΔHCondensation
ΔHSublimation = -ΔHDeposition. - Energy is conserved
ΔHSublimation = ΔHFusion + ΔHVaporization
ΔHDeposition = ΔHCondensation + ΔHFreezing
Exercise \(\PageIndex{1}\)
A)Is the process of freezing water an endothermic or exothermic process? B) Does it cool or warm the surroundings?
- Answer
-
A) Exothermic. B) Warms the surroundings. It is easier for us to think about the opposite process of melting. It takes energy to melt ice, so heat is flowing into the system(the ice cube) and out of the surroundings (the air, let's say). So the surroundings (air) during the process of melting the ice. The opposite of melting ice is freezing water. So, you expect this process to be exothermic, releasing heat to the surroundings, and therefore, warming the surrounds.
Not all substance must transition to the liquid phase before proceeding to the vapor phase. Here is an example showing the sublimation of iodine.
Video 5.3.2 (1:39) YouTube showing sublimation of Iodine
Quantifying Phase Changes
We have seen how heat is either released or absorbed during phase changes. Now, we will study the quantity of energy associated with those phase changes. In order to carry out those calculations, we need to establish a standard bases for comparison, the molar heat of the phase transition, or the heat required for one mole of substance to change phase. Particularly, molar heat of fusion, refers to the amount of heat (in kJ) it takes for one mole of substance to transition from the solid state to the liquid state (melt). The molar heat of vaporization, is the amount of heat (in kJ) it takes for one mole of a substance to transition from the liquid state to the vapor phase. Since we are not always working with exactly one mole of each substance, we will use this equation to figure out the heat for the particular number of moles that we have according to the following equation:
q = nΔHtransition
where n is the number of moles, and H is the heat or enthalpy required for one mole of a substance to go through the phase transition at the temperature where it occurs (which depends on the pressure). Unless otherwise noted, you can assume these are the boiling points and freezing point at 1 atm pressure. As you can see from Table 1, these values are usually given and tabulated. Since, we typically deal with the mass of substance, there are some tables that also give you the heat of transition of a substance on a per gram bases (usually reported as J/g) Here is a link the following tables heat of fusion and heat of vaporization tables:
B2: Heats of Vaporization (Reference Table)
B3: Heats of Fusion (Reference Table)
Table 5.3.1 Enthalpies of Fusion (melting) and Vaporization for some common substances, and the transition temperature where they occur (at normal pressure of 1 atm).
Molar Heat of Freezing and Condensation
You may have wondered why the tables only provide the molar heat of fusion and vaporization, and not the opposite processes of freezing and condensation. For example, if we wanted to quantify the amount of heat it takes to freeze a certain mass of N2, what would be the molar heat of freezing? This is actually the negative of molar heat of melting or fusion, which is the heat energy required to melt one mole of a substance. So from the above diagram, it is - 0.71 kJ/mol. Note, this is a consequence of the First Law of Thermodynamics, the law of the conservation of energy, which we will discuss in detail in the next section. What it is stating is that the energy you must add to melt a mole of a substance is the same as the energy released when a mole freezes, because energy is conserved, but the energy flows in the opposite direction. Therefore, the above table not only gives you the enthalpies of fusion and vaporization, but also of freezing and condensation.
ΔHFusion = - ΔHfreezing
ΔHvaporization = -ΔHcondensation
Quantifying Heat Associated with Temperature Changes within a Phase
The heat being pumped into the system does not always go toward changing the phase of a substance. It may go into changing the temperature of a substance. For example, if want to melt an ice cube that is at -10°C, you have to heat the ice to 0°C, before you can actually start the melting process. In order to quantity the amount of heat required to change the temperature (in the same phase, ice) from -10°C to 0°C, you can use the specific heat capacity equation that we covered in 5.2.
specific heat capacity, q = mCΔT (section 5.2)
Note: remember, the specific heat capacity (C), is different depending on which phase that the substance is in.
Heating Curves
A \heating curve is a graph of the temperature of a substance as a function of the amount of heat added (moving to the right) or removed (moving to the left), as depicted in Fig. 5.3.2. Note the flat regions represent phase changes, and the slope of the line in the rising regions is related to the capacitance of the sample being measured (it is actually the reciprocal, or 1/mc).
The concept of the heating curve is very important as it helps us figure out what equation to use to quantify the heat associated with phase changes and temperature changes (watch the two videos below). At the beginning of this section, we stated that two of the three things that could happen when you add heat to a substance is that either it will undergo a phase change, or its temperature will rise. These are the two effects being described by the heating/cooling curve. The mathematical equations are:
q=mc ΔT (energy of a temperature change within a phase)
q=n ΔHtransition (energy of a phase transition)
It needs to be realized that if you add heat, you move to the right, and if you remove heat, you move to the left. Also, many heating/cooling curves have temperature on the X axis instead of energy. Those curves are correlating the temperature and phase changes to the time it takes for them to occur, which is an observable phenomena, that is contingent on the kinetics, that describe the rates of which heat is transferred. In this class we will stick to the thermodynamics, and use heat on the X axis.
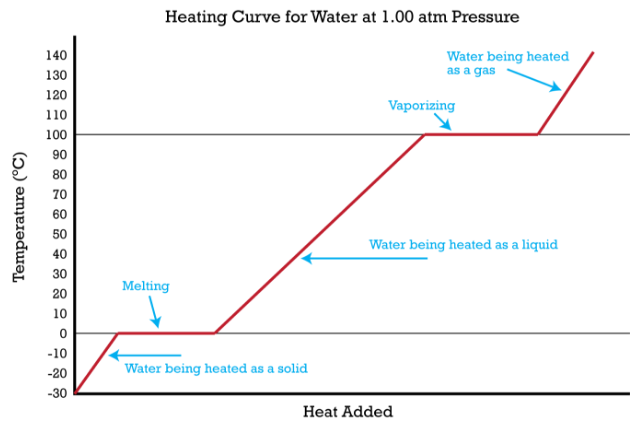
Fig. 5.3.2 Heating Curve for Water. Note, Increasing heat moves to the right, removing heat moves to the left.
Note: What is wrong with the slopes of the lines in figure 5.3.2?
For water c(liq) = 4.184(J/g-degC), c(ice) = 2.06(J/g-degC) and c(steam)=2.01(J/g-degC).
The slopes would be different, and the slopes of the ice and steam would roughly be twice as steep as the water. That is, it takes more energy to raise the temperature of liquid water by 1 deg than it does for either steam or ice.
Let's take a look at a few examples of how to use heat curves for calculations to calculate the final temperature of substance (in this case, water), after adding various amounts of heat.
Example \(\PageIndex{1}\)
What is the final temperature when 1.6 kJ of heat is added to 100.0 grams of ice at -10.0°C?
Solution
Video Tutor:
Do You Need A Review?
How to calculate molar mass? Section 2.12 molecules, compounds and the mole
Conversions between SI prefixes? Section 1B.1 units of measurement
Example \(\PageIndex{2}\)
What is the final temperature when 25.00 kJ of heat is added to 100.0 gram of ice at -10.0°C?
Solution
Video Tutor:
When we added 25.0 kJ it took 2.06 kJ to raise the water to the melting point, leaving 22.94kJ to melt the ice. As it would take 33.42 kJ to melt all the ice, we end up with a 2 phase mixture of ice and water, and so the final temperature is 0oC.
Exercise \(\PageIndex{2}\)
From the above problem, once all the ice the melts has melted, is there more ice, or liquid water?
- Answer
-
Since it takes 33.24kJ to melt all the ice, and you have 22.94 left over after bring the supercooled ice to its freezing point, you have effectively applied the 22.94 kJ to the ice at zero degrees, and so the fraction melted is what you applied over what was required to melt it all. So 22.94/33.24 = 0.69, so it is 69% liquid water and 31% ice (69 grams of the 100 grams melted, and 31 are still frozen).
Example \(\PageIndex{3}\)
What is the final temperature when 310.0 kJ of heat is added to 100.0 of ice at -10.0°C?
Solution
Video Tutor:
After adding 310 kJ you have enough energy to raise the super cooled water from -10.0oC to its freezing point (2.06kJ), melt the ice (33.42kJ), heat the liquid water to its boiling point (41.84kJ) and boil all the water (225.37kJ) using a total of 303.7 kJ, with 7.3kJ left to raise the temperature of the super-heated steam to a final temperature of 136oC. Notice how the majority of the energy was used in the fourth step, the boiling of the the water (225.37kJ out of 310kJ, or 72.7% of the entire energy). This makes sense, as in going from a liquid to a gas you are overcoming all of the forces holding the water molecules together.
Contributors:
- Robert Belford (UA of Little Rock)
- Ronia Kattoum (UA of Little Rock)