
10: Intermolecular Forces
- Page ID
- 316205
\( \newcommand{\vecs}[1]{\overset { \scriptstyle \rightharpoonup} {\mathbf{#1}} } \)
\( \newcommand{\vecd}[1]{\overset{-\!-\!\rightharpoonup}{\vphantom{a}\smash {#1}}} \)
\( \newcommand{\dsum}{\displaystyle\sum\limits} \)
\( \newcommand{\dint}{\displaystyle\int\limits} \)
\( \newcommand{\dlim}{\displaystyle\lim\limits} \)
\( \newcommand{\id}{\mathrm{id}}\) \( \newcommand{\Span}{\mathrm{span}}\)
( \newcommand{\kernel}{\mathrm{null}\,}\) \( \newcommand{\range}{\mathrm{range}\,}\)
\( \newcommand{\RealPart}{\mathrm{Re}}\) \( \newcommand{\ImaginaryPart}{\mathrm{Im}}\)
\( \newcommand{\Argument}{\mathrm{Arg}}\) \( \newcommand{\norm}[1]{\| #1 \|}\)
\( \newcommand{\inner}[2]{\langle #1, #2 \rangle}\)
\( \newcommand{\Span}{\mathrm{span}}\)
\( \newcommand{\id}{\mathrm{id}}\)
\( \newcommand{\Span}{\mathrm{span}}\)
\( \newcommand{\kernel}{\mathrm{null}\,}\)
\( \newcommand{\range}{\mathrm{range}\,}\)
\( \newcommand{\RealPart}{\mathrm{Re}}\)
\( \newcommand{\ImaginaryPart}{\mathrm{Im}}\)
\( \newcommand{\Argument}{\mathrm{Arg}}\)
\( \newcommand{\norm}[1]{\| #1 \|}\)
\( \newcommand{\inner}[2]{\langle #1, #2 \rangle}\)
\( \newcommand{\Span}{\mathrm{span}}\) \( \newcommand{\AA}{\unicode[.8,0]{x212B}}\)
\( \newcommand{\vectorA}[1]{\vec{#1}} % arrow\)
\( \newcommand{\vectorAt}[1]{\vec{\text{#1}}} % arrow\)
\( \newcommand{\vectorB}[1]{\overset { \scriptstyle \rightharpoonup} {\mathbf{#1}} } \)
\( \newcommand{\vectorC}[1]{\textbf{#1}} \)
\( \newcommand{\vectorD}[1]{\overrightarrow{#1}} \)
\( \newcommand{\vectorDt}[1]{\overrightarrow{\text{#1}}} \)
\( \newcommand{\vectE}[1]{\overset{-\!-\!\rightharpoonup}{\vphantom{a}\smash{\mathbf {#1}}}} \)
\( \newcommand{\vecs}[1]{\overset { \scriptstyle \rightharpoonup} {\mathbf{#1}} } \)
\(\newcommand{\longvect}{\overrightarrow}\)
\( \newcommand{\vecd}[1]{\overset{-\!-\!\rightharpoonup}{\vphantom{a}\smash {#1}}} \)
\(\newcommand{\avec}{\mathbf a}\) \(\newcommand{\bvec}{\mathbf b}\) \(\newcommand{\cvec}{\mathbf c}\) \(\newcommand{\dvec}{\mathbf d}\) \(\newcommand{\dtil}{\widetilde{\mathbf d}}\) \(\newcommand{\evec}{\mathbf e}\) \(\newcommand{\fvec}{\mathbf f}\) \(\newcommand{\nvec}{\mathbf n}\) \(\newcommand{\pvec}{\mathbf p}\) \(\newcommand{\qvec}{\mathbf q}\) \(\newcommand{\svec}{\mathbf s}\) \(\newcommand{\tvec}{\mathbf t}\) \(\newcommand{\uvec}{\mathbf u}\) \(\newcommand{\vvec}{\mathbf v}\) \(\newcommand{\wvec}{\mathbf w}\) \(\newcommand{\xvec}{\mathbf x}\) \(\newcommand{\yvec}{\mathbf y}\) \(\newcommand{\zvec}{\mathbf z}\) \(\newcommand{\rvec}{\mathbf r}\) \(\newcommand{\mvec}{\mathbf m}\) \(\newcommand{\zerovec}{\mathbf 0}\) \(\newcommand{\onevec}{\mathbf 1}\) \(\newcommand{\real}{\mathbb R}\) \(\newcommand{\twovec}[2]{\left[\begin{array}{r}#1 \\ #2 \end{array}\right]}\) \(\newcommand{\ctwovec}[2]{\left[\begin{array}{c}#1 \\ #2 \end{array}\right]}\) \(\newcommand{\threevec}[3]{\left[\begin{array}{r}#1 \\ #2 \\ #3 \end{array}\right]}\) \(\newcommand{\cthreevec}[3]{\left[\begin{array}{c}#1 \\ #2 \\ #3 \end{array}\right]}\) \(\newcommand{\fourvec}[4]{\left[\begin{array}{r}#1 \\ #2 \\ #3 \\ #4 \end{array}\right]}\) \(\newcommand{\cfourvec}[4]{\left[\begin{array}{c}#1 \\ #2 \\ #3 \\ #4 \end{array}\right]}\) \(\newcommand{\fivevec}[5]{\left[\begin{array}{r}#1 \\ #2 \\ #3 \\ #4 \\ #5 \\ \end{array}\right]}\) \(\newcommand{\cfivevec}[5]{\left[\begin{array}{c}#1 \\ #2 \\ #3 \\ #4 \\ #5 \\ \end{array}\right]}\) \(\newcommand{\mattwo}[4]{\left[\begin{array}{rr}#1 \amp #2 \\ #3 \amp #4 \\ \end{array}\right]}\) \(\newcommand{\laspan}[1]{\text{Span}\{#1\}}\) \(\newcommand{\bcal}{\cal B}\) \(\newcommand{\ccal}{\cal C}\) \(\newcommand{\scal}{\cal S}\) \(\newcommand{\wcal}{\cal W}\) \(\newcommand{\ecal}{\cal E}\) \(\newcommand{\coords}[2]{\left\{#1\right\}_{#2}}\) \(\newcommand{\gray}[1]{\color{gray}{#1}}\) \(\newcommand{\lgray}[1]{\color{lightgray}{#1}}\) \(\newcommand{\rank}{\operatorname{rank}}\) \(\newcommand{\row}{\text{Row}}\) \(\newcommand{\col}{\text{Col}}\) \(\renewcommand{\row}{\text{Row}}\) \(\newcommand{\nul}{\text{Nul}}\) \(\newcommand{\var}{\text{Var}}\) \(\newcommand{\corr}{\text{corr}}\) \(\newcommand{\len}[1]{\left|#1\right|}\) \(\newcommand{\bbar}{\overline{\bvec}}\) \(\newcommand{\bhat}{\widehat{\bvec}}\) \(\newcommand{\bperp}{\bvec^\perp}\) \(\newcommand{\xhat}{\widehat{\xvec}}\) \(\newcommand{\vhat}{\widehat{\vvec}}\) \(\newcommand{\uhat}{\widehat{\uvec}}\) \(\newcommand{\what}{\widehat{\wvec}}\) \(\newcommand{\Sighat}{\widehat{\Sigma}}\) \(\newcommand{\lt}{<}\) \(\newcommand{\gt}{>}\) \(\newcommand{\amp}{&}\) \(\definecolor{fillinmathshade}{gray}{0.9}\)Learning Objectives
- To research data in the chemical literature and evaluate the sources.
- To examine the relationship between molecular structure and evaporation.
- To examine the relationship between molecular structure and boiling point.
- To examine the relationship between evaporation and boiling point.
- To graph data and use these plots to interpret chemical data and the relationship to the properties of the compounds studied.
- To orally present the results of the experiment to an audience.
Pre Lab Video
Pre-Lab Assignment
Before coming to lab, you need to look up the boiling points of the following compounds: methanol (\(\ce{CH_{3}OH}\)), ethanol (\(\ce{CH_{3}CH_{2}OH}\)), 1-propanol (\(\ce{CH_{3}CH_{2}CH_{2}OH}\)), 1-pentanol (\(\ce{CH_{3}CH_{2}CH_{2}CH_{2}CH_{2}OH}\)), pentane (\(\ce{C_{5}H_{12}}\)), hexane (\(\ce{C_{6}H_{14}}\)), heptane (\(\ce{C_{7}H_{16}}\)), octane (\(\ce{C_{8}H_{18}}\)), acetone (a.k.a. propanone) (\(\ce{CH_{3}COCH_{3}}\)), 2-butanone (a.k.a. methyl ethyl ketone) (\(\ce{CH_{3}COCH_{2}CH_{3}}\)), 2-pentanone (\(\ce{CH_{3}COCH_{2}CH_{2}CH_{3}}\)), water (a.k.a. dihydrogen oxide) (\(\ce{H_{2}O}\)). You will need find the data from two different sources and cite the sources from which you obtained the information. Note: it is OK if the sources do not agree; we will discuss the data collection in pre-lab.
You should also draw the Lewis structures of these molecules. For hexane, pentane, heptane and octane, draw the linear structure (normally referred as n-alkane) where each carbon atom is attached to two other carbon atoms. You should also have calculated the molecular weights for all of the compounds as well.
Experiment Week 1
Caution
The compounds used in this experiment are flammable and poisonous. Aviod inhaling their vapors. Be sure there are no open flames in the lab during this experiment.
Step 1
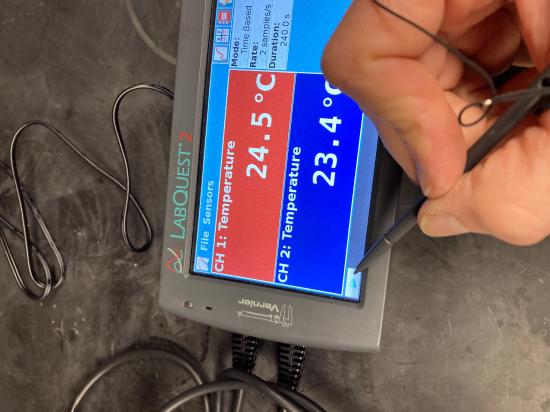
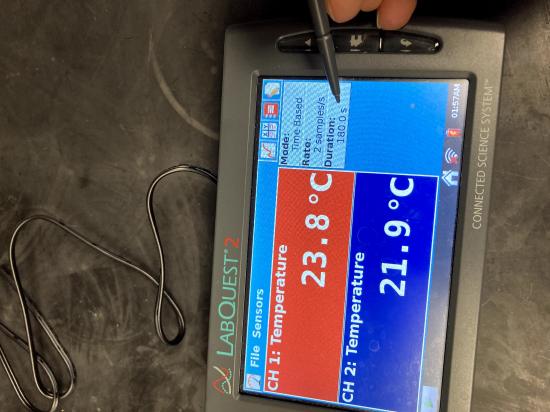 Set-up the LabQuest. Connect the Temperature Probes to LabQuest and choose New from the File
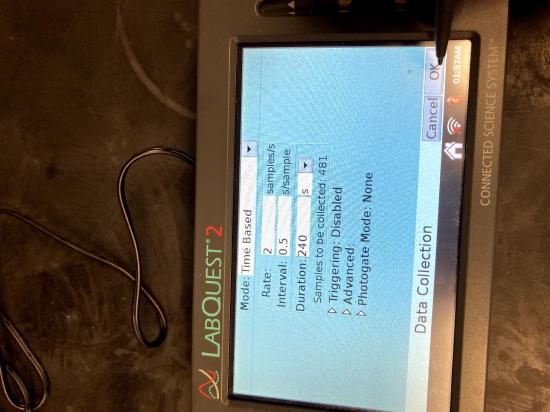 menu. On the Meter screen, tap Duration. Change the data-collection length to 240 seconds. Select OK. Data collection will last 4 minutes.
Step 2
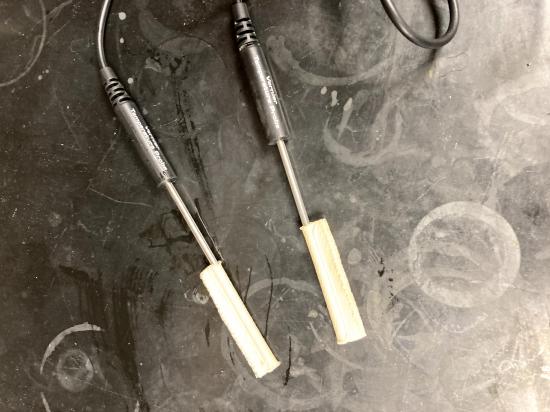 Insert the probe inside a dry cotton “sleeve” as shown.
Step 3
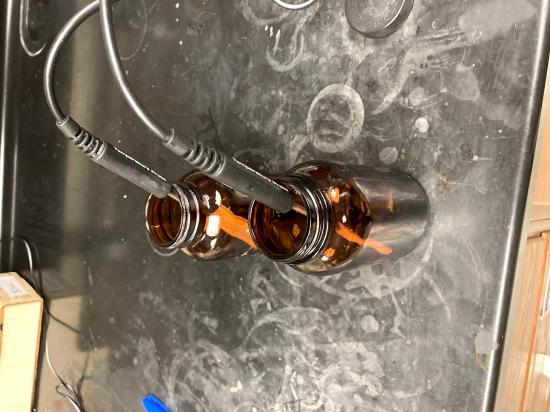 Place the sleeved probe into a container with solvent. Both solvents can be run at the same time, just be sure to determine the channel of each liquid by tracing the wires back to the LabQuest.
Step 4
 After the probe has been in the liquid for at least 30 seconds, begin data collection by clicking the “Collect” button (the green triangle on the bottom left) on the right side at the top of the screen.
Step 5
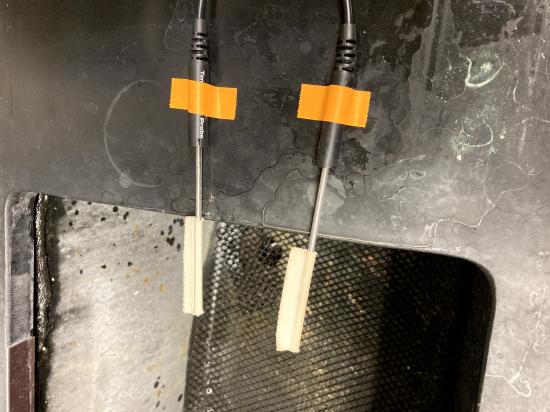 Monitor the temperature for 15 seconds to establish the initial temperature of each liquid then remove the probe from the liquid and tape it so the probe tip extend over the edge of the table top as shown.
Step 6
Monitor the temperature as it is being recorded and let the experiment run for the full 240 seconds.
Step 7
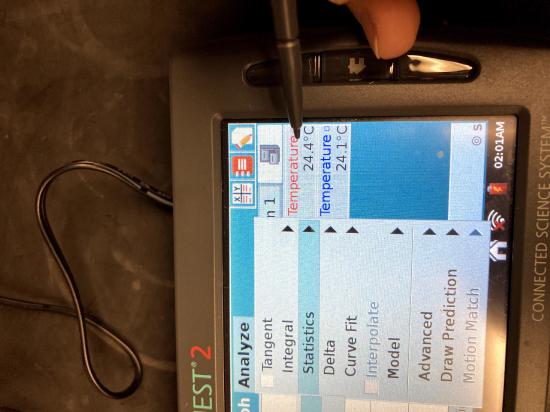 Once the run has stopped, you will need to obtain the minimum and maximum temperatures. To do this, click on the “analyze” menu and choose statistics. Select one of your runs. The statistics (including minimum and maximum temperatures) will appear on the right. Record these in your notebook with the identity of your liquid. Repeat for your other run. You may need to scroll the window on the right down to see both data sets.
Step 8
Move to the next station when it is available and repeat steps 3 thru 7.
Step 9
Repeat this procedure for each of the 12 liquids. Do not contaminate the liquids.
Data Analysis:
Using Spartan, you will draw the molecules and calculate their dipole moments. Collect this data in your lab notebook.
Step 1
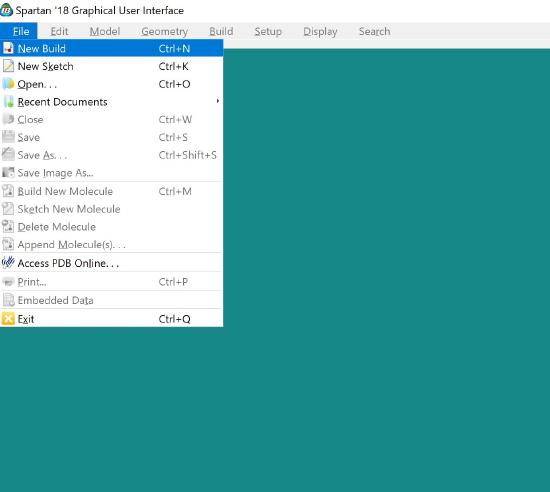 Build the molecule in Spartan as you did previously.
Step 2
 Minimize the energy as you did before with the button (down arrow/E)
Step 3
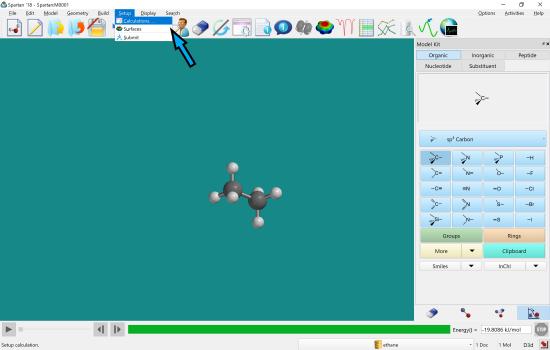 In the “Setup” menu, choose “Calculation”
Step 4
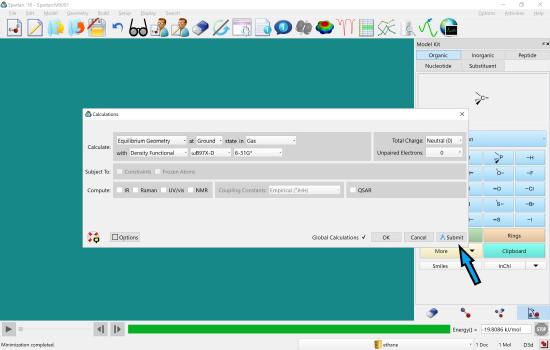 Leave all of the selections as they are and click on “submit”. You must click submit. Do not click OK.
Step 5
Choose a file name and let it run. Click OK (should need to do so twice).
Step 6
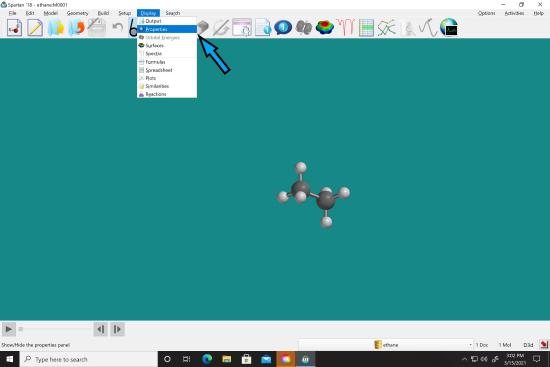 After it says it is done, go to “display” menu and select “Properties”.
 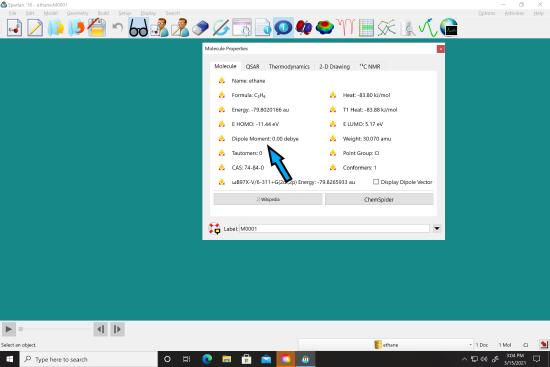 The dipole moment should be displayed in the box. Record this in your notebook.
Step 7
Repeat for the other molecules.
Post Lab
You will prepare four graphs containing the following plots:
- \(\Delta T\) versus boiling point for all of the compounds together on one plot line.
- Boiling point versus dipole moment with a plot line for each class of compound (alkanes, alcohols and ketones) This requires that there be three different plot lines on one graph with a trend line for each line.
- Boiling point versus MW with a plot line for each class of compound (alkanes, alcohols and ketones) - three different plot lines on one graph.
- \(\Delta T\) versus MW for each class of compound (alkanes, alcohols and ketones) – three lines on one graph.
Experiment Week 2:
You will be given a set of compounds that you have not yet measured. Measure their \(\Delta T\) as you did in Week 1. Follow the same procedure, recording your observations and the value of your \(\Delta T\). You will need to then look up the boiling points from the same site you obtained the previous set (if they were reasonable), draw the Lewis structures and calculate the dipole moments. You will then spend the remainder of the lab period working with your lab partner on the following:
- Examine how your new compounds fit into your previous data set. Do they make sense? Explain why or why not.
- Prepare a brief presentation (as a pair) to be given during the laboratory session next week that explains your approach to answering the above question. You should use the data from the previous week to analyze your data and what you know about the structure of the molecule and intermolecular forces to explain your data. See the report guidelines for a rubric that will be used to grade the presentation.