
5.9: Molecular Speed Distribution
- Page ID
- 169982
\( \newcommand{\vecs}[1]{\overset { \scriptstyle \rightharpoonup} {\mathbf{#1}} } \)
\( \newcommand{\vecd}[1]{\overset{-\!-\!\rightharpoonup}{\vphantom{a}\smash {#1}}} \)
\( \newcommand{\id}{\mathrm{id}}\) \( \newcommand{\Span}{\mathrm{span}}\)
( \newcommand{\kernel}{\mathrm{null}\,}\) \( \newcommand{\range}{\mathrm{range}\,}\)
\( \newcommand{\RealPart}{\mathrm{Re}}\) \( \newcommand{\ImaginaryPart}{\mathrm{Im}}\)
\( \newcommand{\Argument}{\mathrm{Arg}}\) \( \newcommand{\norm}[1]{\| #1 \|}\)
\( \newcommand{\inner}[2]{\langle #1, #2 \rangle}\)
\( \newcommand{\Span}{\mathrm{span}}\)
\( \newcommand{\id}{\mathrm{id}}\)
\( \newcommand{\Span}{\mathrm{span}}\)
\( \newcommand{\kernel}{\mathrm{null}\,}\)
\( \newcommand{\range}{\mathrm{range}\,}\)
\( \newcommand{\RealPart}{\mathrm{Re}}\)
\( \newcommand{\ImaginaryPart}{\mathrm{Im}}\)
\( \newcommand{\Argument}{\mathrm{Arg}}\)
\( \newcommand{\norm}[1]{\| #1 \|}\)
\( \newcommand{\inner}[2]{\langle #1, #2 \rangle}\)
\( \newcommand{\Span}{\mathrm{span}}\) \( \newcommand{\AA}{\unicode[.8,0]{x212B}}\)
\( \newcommand{\vectorA}[1]{\vec{#1}} % arrow\)
\( \newcommand{\vectorAt}[1]{\vec{\text{#1}}} % arrow\)
\( \newcommand{\vectorB}[1]{\overset { \scriptstyle \rightharpoonup} {\mathbf{#1}} } \)
\( \newcommand{\vectorC}[1]{\textbf{#1}} \)
\( \newcommand{\vectorD}[1]{\overrightarrow{#1}} \)
\( \newcommand{\vectorDt}[1]{\overrightarrow{\text{#1}}} \)
\( \newcommand{\vectE}[1]{\overset{-\!-\!\rightharpoonup}{\vphantom{a}\smash{\mathbf {#1}}}} \)
\( \newcommand{\vecs}[1]{\overset { \scriptstyle \rightharpoonup} {\mathbf{#1}} } \)
\( \newcommand{\vecd}[1]{\overset{-\!-\!\rightharpoonup}{\vphantom{a}\smash {#1}}} \)
\(\newcommand{\avec}{\mathbf a}\) \(\newcommand{\bvec}{\mathbf b}\) \(\newcommand{\cvec}{\mathbf c}\) \(\newcommand{\dvec}{\mathbf d}\) \(\newcommand{\dtil}{\widetilde{\mathbf d}}\) \(\newcommand{\evec}{\mathbf e}\) \(\newcommand{\fvec}{\mathbf f}\) \(\newcommand{\nvec}{\mathbf n}\) \(\newcommand{\pvec}{\mathbf p}\) \(\newcommand{\qvec}{\mathbf q}\) \(\newcommand{\svec}{\mathbf s}\) \(\newcommand{\tvec}{\mathbf t}\) \(\newcommand{\uvec}{\mathbf u}\) \(\newcommand{\vvec}{\mathbf v}\) \(\newcommand{\wvec}{\mathbf w}\) \(\newcommand{\xvec}{\mathbf x}\) \(\newcommand{\yvec}{\mathbf y}\) \(\newcommand{\zvec}{\mathbf z}\) \(\newcommand{\rvec}{\mathbf r}\) \(\newcommand{\mvec}{\mathbf m}\) \(\newcommand{\zerovec}{\mathbf 0}\) \(\newcommand{\onevec}{\mathbf 1}\) \(\newcommand{\real}{\mathbb R}\) \(\newcommand{\twovec}[2]{\left[\begin{array}{r}#1 \\ #2 \end{array}\right]}\) \(\newcommand{\ctwovec}[2]{\left[\begin{array}{c}#1 \\ #2 \end{array}\right]}\) \(\newcommand{\threevec}[3]{\left[\begin{array}{r}#1 \\ #2 \\ #3 \end{array}\right]}\) \(\newcommand{\cthreevec}[3]{\left[\begin{array}{c}#1 \\ #2 \\ #3 \end{array}\right]}\) \(\newcommand{\fourvec}[4]{\left[\begin{array}{r}#1 \\ #2 \\ #3 \\ #4 \end{array}\right]}\) \(\newcommand{\cfourvec}[4]{\left[\begin{array}{c}#1 \\ #2 \\ #3 \\ #4 \end{array}\right]}\) \(\newcommand{\fivevec}[5]{\left[\begin{array}{r}#1 \\ #2 \\ #3 \\ #4 \\ #5 \\ \end{array}\right]}\) \(\newcommand{\cfivevec}[5]{\left[\begin{array}{c}#1 \\ #2 \\ #3 \\ #4 \\ #5 \\ \end{array}\right]}\) \(\newcommand{\mattwo}[4]{\left[\begin{array}{rr}#1 \amp #2 \\ #3 \amp #4 \\ \end{array}\right]}\) \(\newcommand{\laspan}[1]{\text{Span}\{#1\}}\) \(\newcommand{\bcal}{\cal B}\) \(\newcommand{\ccal}{\cal C}\) \(\newcommand{\scal}{\cal S}\) \(\newcommand{\wcal}{\cal W}\) \(\newcommand{\ecal}{\cal E}\) \(\newcommand{\coords}[2]{\left\{#1\right\}_{#2}}\) \(\newcommand{\gray}[1]{\color{gray}{#1}}\) \(\newcommand{\lgray}[1]{\color{lightgray}{#1}}\) \(\newcommand{\rank}{\operatorname{rank}}\) \(\newcommand{\row}{\text{Row}}\) \(\newcommand{\col}{\text{Col}}\) \(\renewcommand{\row}{\text{Row}}\) \(\newcommand{\nul}{\text{Nul}}\) \(\newcommand{\var}{\text{Var}}\) \(\newcommand{\corr}{\text{corr}}\) \(\newcommand{\len}[1]{\left|#1\right|}\) \(\newcommand{\bbar}{\overline{\bvec}}\) \(\newcommand{\bhat}{\widehat{\bvec}}\) \(\newcommand{\bperp}{\bvec^\perp}\) \(\newcommand{\xhat}{\widehat{\xvec}}\) \(\newcommand{\vhat}{\widehat{\vvec}}\) \(\newcommand{\uhat}{\widehat{\uvec}}\) \(\newcommand{\what}{\widehat{\wvec}}\) \(\newcommand{\Sighat}{\widehat{\Sigma}}\) \(\newcommand{\lt}{<}\) \(\newcommand{\gt}{>}\) \(\newcommand{\amp}{&}\) \(\definecolor{fillinmathshade}{gray}{0.9}\)Distributions of the Value of Molecular Speed
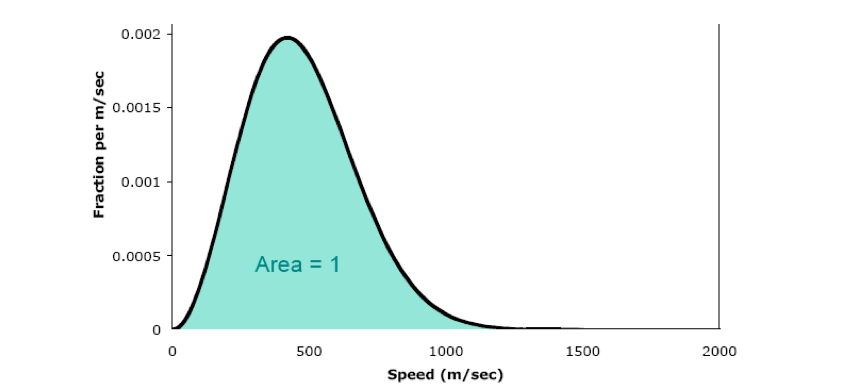
In the mid-19th century, James Maxwell and Ludwig Boltzmann derived an equation for the distribution of molecular speeds in a gas. Graphing this equation gives us the Maxwell-Boltzmann distribution of speeds. The Maxwell-Boltzmann speed distribution curve for N2 at 25ºC is shown below.

For example, when the speed is 500 m/sec, the y value is 0.00185. This tells us that the fraction of molecules that have speeds near 500 m/sec is 0.00185. Note: if you are struggling with the concept of the fraction, translate it into a percentage (multiply by 100): 0.185% of the molecules have speeds in this range. The higher the curve at a given speed, the more molecules travel at that speed. For example, many molecules have speeds around 500 m/sec, whereas few molecules have speeds around 1000 m/sec.
The speed that corresponds to the peak of the curve is called the most probable speed. More molecules travel at (or close to) this speed than any other. For N2 at 25ºC, the most probable speed is 421 m/sec. The average speed is a little larger than the most probable speed. For N2 at 25ºC, the average speed is 475 m/sec. The root-mean-square speed is the speed that corresponds to the average kinetic energy of the molecules. For N2 at 25ºC, the root-mean-square speed is 515 m/sec.
For any gas, these speeds can be calculated by the following formulas:
most probable speed, \(v_{mp}\):
\[v_{mp} = \sqrt{\dfrac{2RT}{M}},\]
average speed, \(v_{ave}\):
\[v_{ave} = \sqrt{\dfrac{8RT}{\pi M}},\]
root-mean-square speed, \(v_{rms}\):
\[v_{rms} = \sqrt{\dfrac{3RT}{M}},\]
where \(T\) is the kelvin temperature, \(R\) is the gas constant expressed in units of J/mol-K (8.314 J/mol-K), and \(M\) is the molar mass of the gas expressed in units of kg/mol.
Fraction of Molecules in a Wide Range of Speeds
Suppose we wanted to know the fraction of molecules that have speeds in a wide range, say 500 to 1000 m/sec. In principle, we could add up the fractions for each individual speed in this range, just as we added up the sizes of the bars in our histogram. However, in practice this is not practical, because there would be way too many “bars” to add up (for this particular range we’d need to add up 500 “bars”!!) A far better way to determine the fraction of molecules in a wide range of speeds is to measure the area of the region under the Maxwell-Boltzmann curve.
The area under the entire Maxwell-Boltzmann curve is exactly 1. Therefore, the area under any part of the curve equals the fraction of molecules in the corresponding velocity range.
For example, if we want to determine the fraction of molecules that have velocities between 500 and 1000 m/sec, we need to measure the area of the shaded region below.
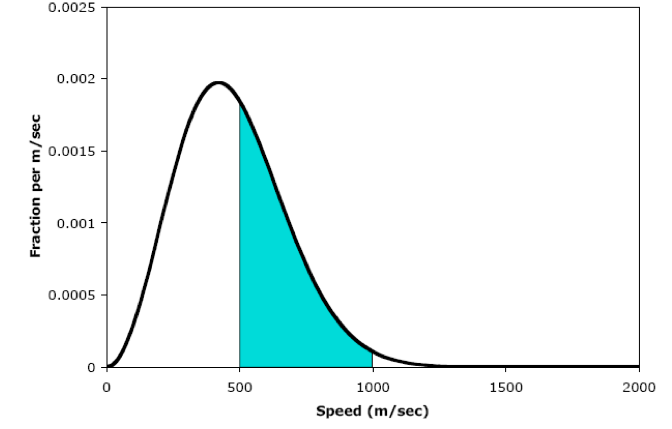
There are several ways to estimate this area. The simplest, which you will do in the lab, is to cut out and weigh the graph. In principle, we could use calculus to determine the exact area under the curve, since the equation that generates the Maxwell-Boltzmann curve is known. Unfortunately, this equation cannot be integrated analytically. If you’re curious, though, the area of the shaded region is 0.392, so the fraction of molecules that have speeds between 500 and 1000 m/sec is 0.392. (As always, we can think of this as a percentage: 39.2%.)
The Shape of a Speed Distribution Curve
A great deal of information about a gas can be gleaned by considering the overall shape of the speed distribution curve. The speed distribution curve shape will vary with both temperature and molar mass of the gas.
When we consider a gas at increasing temperature:
- The Maxwell-Boltzmann curve spreads and flattens out.
- The most probable speed increases (the peak shifts to the right).
- The fraction of fast-moving molecules increases.
- The fraction of slow-moving molecules decreases.
Maxwell-Boltzmann speed distribution for nitrogen at four different temperatures
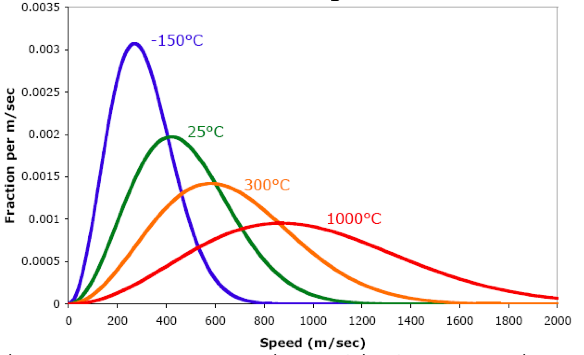
Observe that when the temperature goes up, the particles in a gas tend to move faster. As a result, the entire distribution shifts to the right, toward higher speeds. When we raise the temperature, the most probable speed increases (the highest point on the curve shifts to the right). In addition, the entire curve gets wider and lower: we have a wider range of speeds, but we have fewer molecules at the most probable speed.

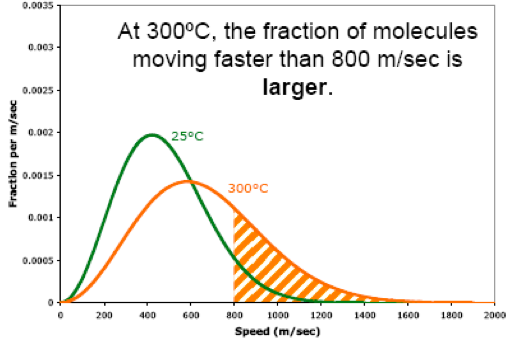
Also, when we raise the temperature, the fraction of molecules moving at high speeds increases. For example, when we raise the temperature from 25ºC to 300ºC, the fraction of molecules moving faster than 800 m/sec becomes larger.
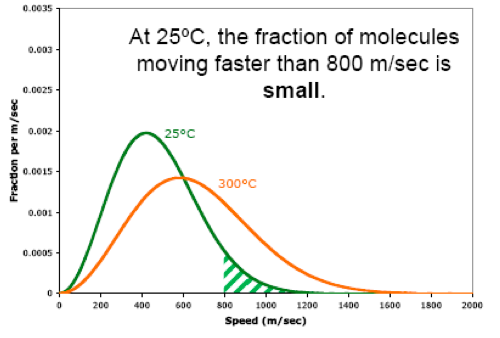
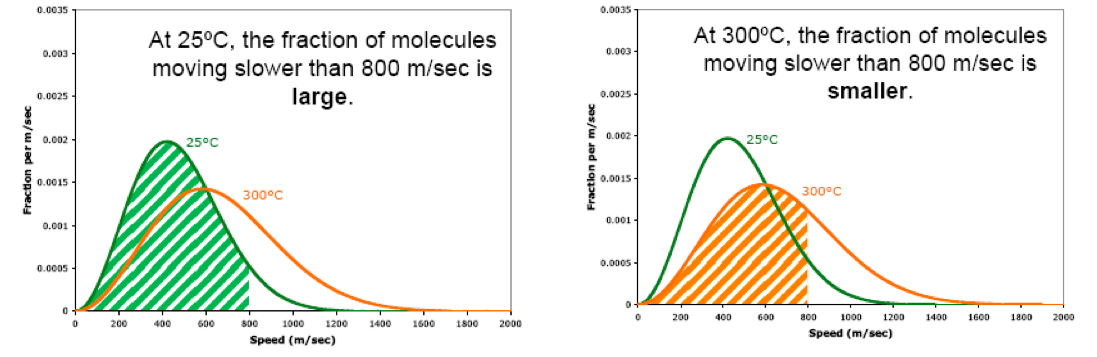
Likewise, when we raise the temperature, the fraction of molecules moving at low speeds decreases. For example, when we raise the temperature from 25ºC to 300ºC, the fraction of molecules moving slower than 800 m/sec becomes smaller.
When we consider gases of increasing molar mass:
- The Maxwell-Boltzmann curve gets taller and narrower.
- The most probable speed decreases (the peak shifts left).
- The fraction of fast-moving molecules decreases.
- The fraction of slow-moving molecules increases.
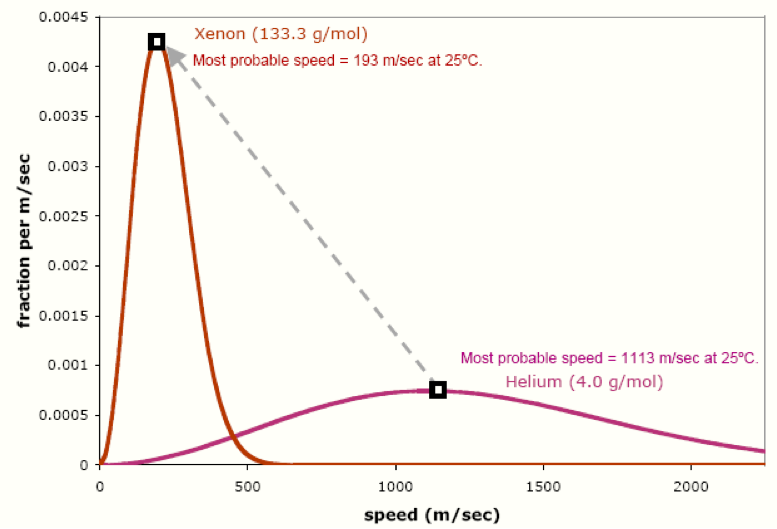
Maxwell-Boltzmann speed distribution curves for three different gases
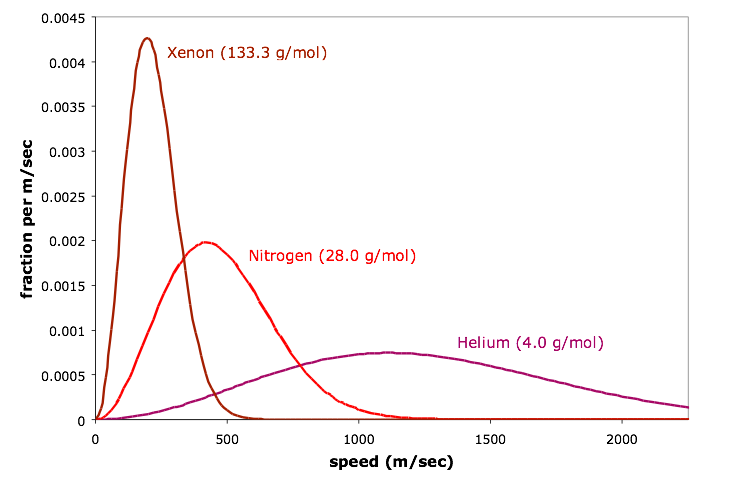
Observe that the gas with the lowest molar mass (helium) has the highest molecular speeds, while the gas with the highest molar mass (xenon) has the lowest molecular speeds. When we increase the molar mass, the most probable speed decreases (the highest point on the curve shifts to the left). In addition, the entire curve gets narrower and taller: we have a smaller range of speeds, but we have more molecules at the most probable speed.
Example \(\PageIndex{1}\): Which is larger?
For each of the following pairs of quantities, tell which one is larger and explain your answer. If they are equal, say so and explain how you can tell. (“KE” means kinetic energy)
a) The rms velocity of nitrogen at 25ºC or the rms velocity of oxygen at 75ºC.
b) The average velocity of hydrogen or the average velocity of helium at the same temperature.
c) The fraction of \(CH_4\) molecules with velocities greater than 500 m/sec, or the fraction of \(NH_3\) molecules with velocities greater than 500 m/sec at the same temperature.
Solutions:
a) Oxygen at 75ºC is larger. The rms velocity depends on both the molar mass and the temperature, so it is easiest to just calculate the rms velocity for each gas, vrms for N2 is 515 m/s and for O2 is 521 m/s.
b) Hydrogen is larger. If the temperature is constant, the velocity distribution is inversely dependent on the molar mass; the smaller the molar mass, the faster the molecules.
c) The fraction of CH4 molecules with velocities greater than 500 m/sec is larger. This is similar to part c. The gas with the smaller molar mass will have a larger fraction of “fast molecules” and a smaller fraction of “slow molecules”, no matter where we choose the cutoff between “fast” and “slow”.