
3.1.11: Kinetic Energy Distribution
- Page ID
- 169983
\( \newcommand{\vecs}[1]{\overset { \scriptstyle \rightharpoonup} {\mathbf{#1}} } \)
\( \newcommand{\vecd}[1]{\overset{-\!-\!\rightharpoonup}{\vphantom{a}\smash {#1}}} \)
\( \newcommand{\dsum}{\displaystyle\sum\limits} \)
\( \newcommand{\dint}{\displaystyle\int\limits} \)
\( \newcommand{\dlim}{\displaystyle\lim\limits} \)
\( \newcommand{\id}{\mathrm{id}}\) \( \newcommand{\Span}{\mathrm{span}}\)
( \newcommand{\kernel}{\mathrm{null}\,}\) \( \newcommand{\range}{\mathrm{range}\,}\)
\( \newcommand{\RealPart}{\mathrm{Re}}\) \( \newcommand{\ImaginaryPart}{\mathrm{Im}}\)
\( \newcommand{\Argument}{\mathrm{Arg}}\) \( \newcommand{\norm}[1]{\| #1 \|}\)
\( \newcommand{\inner}[2]{\langle #1, #2 \rangle}\)
\( \newcommand{\Span}{\mathrm{span}}\)
\( \newcommand{\id}{\mathrm{id}}\)
\( \newcommand{\Span}{\mathrm{span}}\)
\( \newcommand{\kernel}{\mathrm{null}\,}\)
\( \newcommand{\range}{\mathrm{range}\,}\)
\( \newcommand{\RealPart}{\mathrm{Re}}\)
\( \newcommand{\ImaginaryPart}{\mathrm{Im}}\)
\( \newcommand{\Argument}{\mathrm{Arg}}\)
\( \newcommand{\norm}[1]{\| #1 \|}\)
\( \newcommand{\inner}[2]{\langle #1, #2 \rangle}\)
\( \newcommand{\Span}{\mathrm{span}}\) \( \newcommand{\AA}{\unicode[.8,0]{x212B}}\)
\( \newcommand{\vectorA}[1]{\vec{#1}} % arrow\)
\( \newcommand{\vectorAt}[1]{\vec{\text{#1}}} % arrow\)
\( \newcommand{\vectorB}[1]{\overset { \scriptstyle \rightharpoonup} {\mathbf{#1}} } \)
\( \newcommand{\vectorC}[1]{\textbf{#1}} \)
\( \newcommand{\vectorD}[1]{\overrightarrow{#1}} \)
\( \newcommand{\vectorDt}[1]{\overrightarrow{\text{#1}}} \)
\( \newcommand{\vectE}[1]{\overset{-\!-\!\rightharpoonup}{\vphantom{a}\smash{\mathbf {#1}}}} \)
\( \newcommand{\vecs}[1]{\overset { \scriptstyle \rightharpoonup} {\mathbf{#1}} } \)
\(\newcommand{\longvect}{\overrightarrow}\)
\( \newcommand{\vecd}[1]{\overset{-\!-\!\rightharpoonup}{\vphantom{a}\smash {#1}}} \)
\(\newcommand{\avec}{\mathbf a}\) \(\newcommand{\bvec}{\mathbf b}\) \(\newcommand{\cvec}{\mathbf c}\) \(\newcommand{\dvec}{\mathbf d}\) \(\newcommand{\dtil}{\widetilde{\mathbf d}}\) \(\newcommand{\evec}{\mathbf e}\) \(\newcommand{\fvec}{\mathbf f}\) \(\newcommand{\nvec}{\mathbf n}\) \(\newcommand{\pvec}{\mathbf p}\) \(\newcommand{\qvec}{\mathbf q}\) \(\newcommand{\svec}{\mathbf s}\) \(\newcommand{\tvec}{\mathbf t}\) \(\newcommand{\uvec}{\mathbf u}\) \(\newcommand{\vvec}{\mathbf v}\) \(\newcommand{\wvec}{\mathbf w}\) \(\newcommand{\xvec}{\mathbf x}\) \(\newcommand{\yvec}{\mathbf y}\) \(\newcommand{\zvec}{\mathbf z}\) \(\newcommand{\rvec}{\mathbf r}\) \(\newcommand{\mvec}{\mathbf m}\) \(\newcommand{\zerovec}{\mathbf 0}\) \(\newcommand{\onevec}{\mathbf 1}\) \(\newcommand{\real}{\mathbb R}\) \(\newcommand{\twovec}[2]{\left[\begin{array}{r}#1 \\ #2 \end{array}\right]}\) \(\newcommand{\ctwovec}[2]{\left[\begin{array}{c}#1 \\ #2 \end{array}\right]}\) \(\newcommand{\threevec}[3]{\left[\begin{array}{r}#1 \\ #2 \\ #3 \end{array}\right]}\) \(\newcommand{\cthreevec}[3]{\left[\begin{array}{c}#1 \\ #2 \\ #3 \end{array}\right]}\) \(\newcommand{\fourvec}[4]{\left[\begin{array}{r}#1 \\ #2 \\ #3 \\ #4 \end{array}\right]}\) \(\newcommand{\cfourvec}[4]{\left[\begin{array}{c}#1 \\ #2 \\ #3 \\ #4 \end{array}\right]}\) \(\newcommand{\fivevec}[5]{\left[\begin{array}{r}#1 \\ #2 \\ #3 \\ #4 \\ #5 \\ \end{array}\right]}\) \(\newcommand{\cfivevec}[5]{\left[\begin{array}{c}#1 \\ #2 \\ #3 \\ #4 \\ #5 \\ \end{array}\right]}\) \(\newcommand{\mattwo}[4]{\left[\begin{array}{rr}#1 \amp #2 \\ #3 \amp #4 \\ \end{array}\right]}\) \(\newcommand{\laspan}[1]{\text{Span}\{#1\}}\) \(\newcommand{\bcal}{\cal B}\) \(\newcommand{\ccal}{\cal C}\) \(\newcommand{\scal}{\cal S}\) \(\newcommand{\wcal}{\cal W}\) \(\newcommand{\ecal}{\cal E}\) \(\newcommand{\coords}[2]{\left\{#1\right\}_{#2}}\) \(\newcommand{\gray}[1]{\color{gray}{#1}}\) \(\newcommand{\lgray}[1]{\color{lightgray}{#1}}\) \(\newcommand{\rank}{\operatorname{rank}}\) \(\newcommand{\row}{\text{Row}}\) \(\newcommand{\col}{\text{Col}}\) \(\renewcommand{\row}{\text{Row}}\) \(\newcommand{\nul}{\text{Nul}}\) \(\newcommand{\var}{\text{Var}}\) \(\newcommand{\corr}{\text{corr}}\) \(\newcommand{\len}[1]{\left|#1\right|}\) \(\newcommand{\bbar}{\overline{\bvec}}\) \(\newcommand{\bhat}{\widehat{\bvec}}\) \(\newcommand{\bperp}{\bvec^\perp}\) \(\newcommand{\xhat}{\widehat{\xvec}}\) \(\newcommand{\vhat}{\widehat{\vvec}}\) \(\newcommand{\uhat}{\widehat{\uvec}}\) \(\newcommand{\what}{\widehat{\wvec}}\) \(\newcommand{\Sighat}{\widehat{\Sigma}}\) \(\newcommand{\lt}{<}\) \(\newcommand{\gt}{>}\) \(\newcommand{\amp}{&}\) \(\definecolor{fillinmathshade}{gray}{0.9}\)Distributions of the Value of Molecular Kinetic Energy
The Maxwell-Boltzmann equation can also be expressed in terms of the distribution of molecular kinetic energies in a gas. Graphing this equation gives us the Maxwell-Boltzmann distribution of kinetic energies. The Maxwell-Boltzmann kinetic energy distribution curve for N2 at 25ºC is shown below.
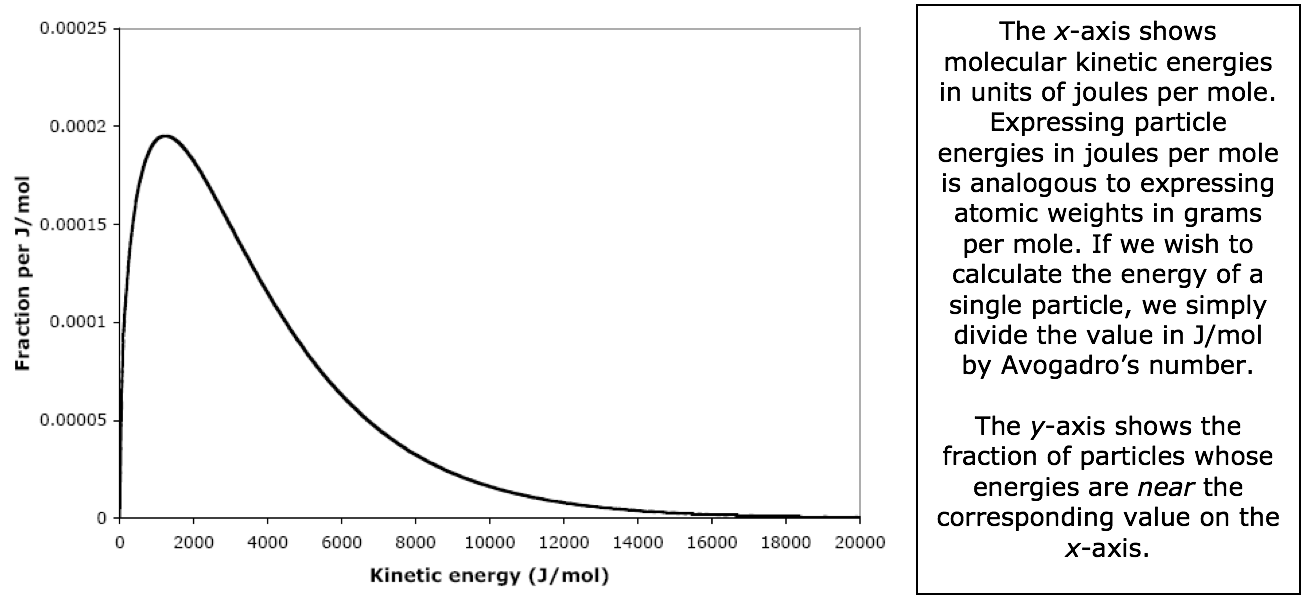
For instance, the fraction of molecules that have kinetic energies near 4000. J/mol (the range 4000 ± 0.5 J/mol) is 0.000115. Another way to say the same thing is: “0.0115% of the nitrogen molecules have kinetic energies near 4000. J/mol.”
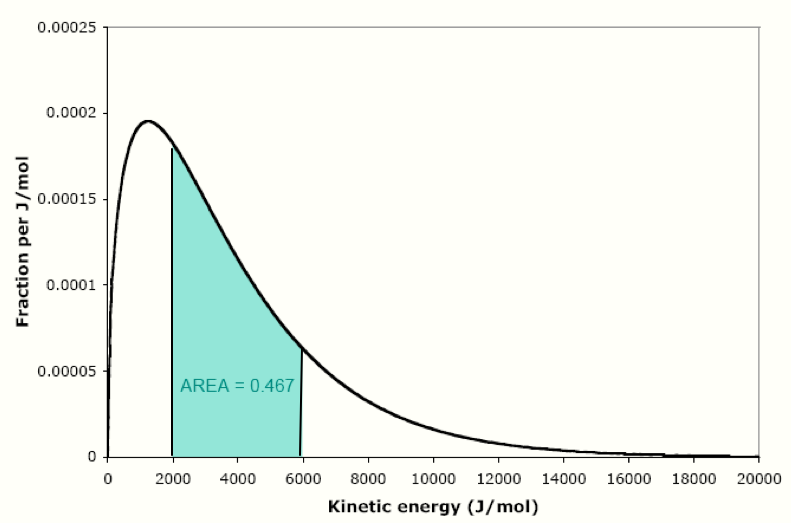
We can measure the fraction of molecules having a wide range of energies by measuring the area under the curve. For instance, the fraction of area of the shaded region is 0.467, so the fraction of nitrogen molecules that have energies between 2000 and 6000 J/mol is 0.467 (that’s 46.7%). Recall that the total area under this curve is exactly 1.
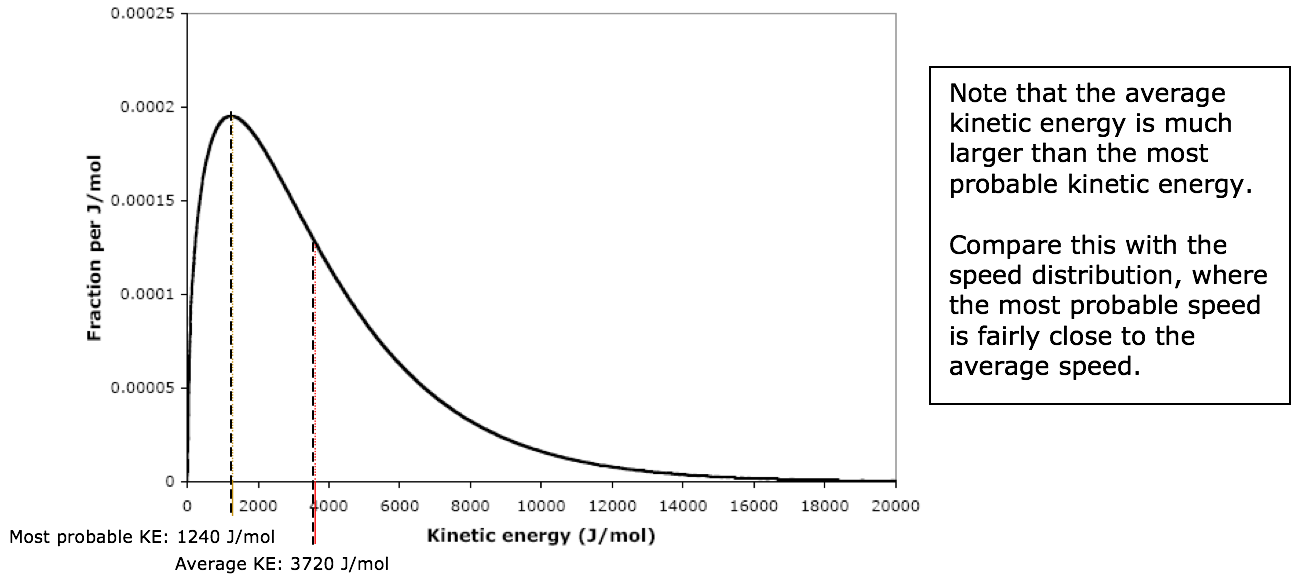
The kinetic energy corresponding to the peak of the curve is called the most probable kinetic energy. The average kinetic energy is much larger than the most probable kinetic energy. For any gas, these kinetic energy values can be calculated by the following formulas:
most probable kinetic energy, \(KE_{mp}\):
\[KE_{mp} = \dfrac{1}{2}RT\]
average kinetic energy, \(KE_{ave}\):
\[KE_{ave} = \dfrac{3}{2}RT\]
where \(T\) is the kelvin temperature, \(R\) is the gas constant expressed in units of J/mol-K (8.314 J/mol-K). For N2 at 25ºC, the most probable KE is 1240 J/mol and the average KE is 3720 J/mol.
The Shape of a Kinetic Energy Distribution Curve
The kinetic energy distribution curve shape will vary with temperature only. The shape of the kinetic energy distribution is independent of the molar mass of the gas.
When we consider a gas at increasing temperature:
- The Kinetic Energy distribution curve spreads and flattens out.
- The most probable kinetic energy increases (the peak shifts to the right).
- The fraction of higher-energy molecules increases.
- The fraction of lower-energy molecules decreases.
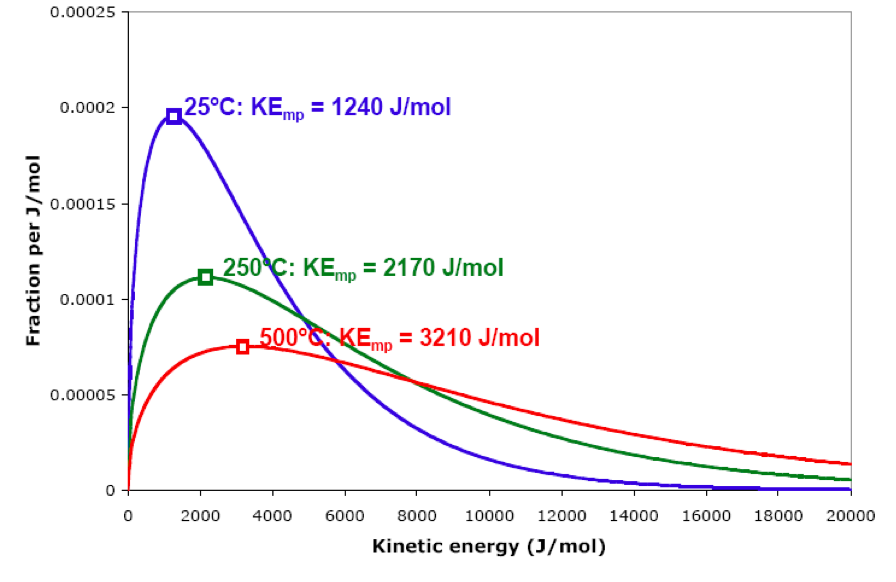
Consider the following graphs for nitrogen gas at 25ºC, 250ºC, and 500ºC. Increasing the temperature increases the most probable KE, and it shifts the entire graph toward higher kinetic energies. Note the change in shape of the distribution. Notice that at higher temperatures, the fraction of molecules with kinetic energies higher than a particular value, such as 4000 J/mol, increases significantly.
Note that the kinetic energy distribution is the same for any gas, as long as the gases are at the same temperature. The mass of the individual particles has no effect on the shape of kinetic energy distribution. The graph shown for N2 at 25ºC can represent the kinetic energy distribution of H2, He, O2, CO2, Ar, Xe, or any other substance that is a gas at 25ºC.
When we consider different gases at the same temperature:
- The Kinetic Energy distribution curves are identical.
- The shape of a kinetic energy distribution curve is independent of molar mass.
Example \(\PageIndex{1}\): Which is larger?
For each of the following pairs of quantities, tell which one is larger and explain your answer. If they are equal, say so and explain how you can tell. (“KE” means kinetic energy)
a) The most probable KE for argon at 25ºC or the most probable KE for neon at 25ºC.
b) The fraction of He atoms with kinetic energies between 100 and 200 J/mol, or the fraction of Ne atoms with kinetic energies between 100 and 200 J/mol, if both gases are at 100ºC.
Solutions:
a) They have the same most probable kinetic energies. The kinetic energy distribution depends only on temperature.
b) Exactly the same fraction of atoms with kinetic energies in any range we select.To work this out, we must recognize that the kinetic energy distribution depends only on temperature, not on molar mass. Therefore, the helium and the neon will have exactly the same fraction of atoms with kinetic energies in any range we select.