
16.8: Climate Change – An Effect of Global Warming
- Page ID
- 434974
\( \newcommand{\vecs}[1]{\overset { \scriptstyle \rightharpoonup} {\mathbf{#1}} } \)
\( \newcommand{\vecd}[1]{\overset{-\!-\!\rightharpoonup}{\vphantom{a}\smash {#1}}} \)
\( \newcommand{\id}{\mathrm{id}}\) \( \newcommand{\Span}{\mathrm{span}}\)
( \newcommand{\kernel}{\mathrm{null}\,}\) \( \newcommand{\range}{\mathrm{range}\,}\)
\( \newcommand{\RealPart}{\mathrm{Re}}\) \( \newcommand{\ImaginaryPart}{\mathrm{Im}}\)
\( \newcommand{\Argument}{\mathrm{Arg}}\) \( \newcommand{\norm}[1]{\| #1 \|}\)
\( \newcommand{\inner}[2]{\langle #1, #2 \rangle}\)
\( \newcommand{\Span}{\mathrm{span}}\)
\( \newcommand{\id}{\mathrm{id}}\)
\( \newcommand{\Span}{\mathrm{span}}\)
\( \newcommand{\kernel}{\mathrm{null}\,}\)
\( \newcommand{\range}{\mathrm{range}\,}\)
\( \newcommand{\RealPart}{\mathrm{Re}}\)
\( \newcommand{\ImaginaryPart}{\mathrm{Im}}\)
\( \newcommand{\Argument}{\mathrm{Arg}}\)
\( \newcommand{\norm}[1]{\| #1 \|}\)
\( \newcommand{\inner}[2]{\langle #1, #2 \rangle}\)
\( \newcommand{\Span}{\mathrm{span}}\) \( \newcommand{\AA}{\unicode[.8,0]{x212B}}\)
\( \newcommand{\vectorA}[1]{\vec{#1}} % arrow\)
\( \newcommand{\vectorAt}[1]{\vec{\text{#1}}} % arrow\)
\( \newcommand{\vectorB}[1]{\overset { \scriptstyle \rightharpoonup} {\mathbf{#1}} } \)
\( \newcommand{\vectorC}[1]{\textbf{#1}} \)
\( \newcommand{\vectorD}[1]{\overrightarrow{#1}} \)
\( \newcommand{\vectorDt}[1]{\overrightarrow{\text{#1}}} \)
\( \newcommand{\vectE}[1]{\overset{-\!-\!\rightharpoonup}{\vphantom{a}\smash{\mathbf {#1}}}} \)
\( \newcommand{\vecs}[1]{\overset { \scriptstyle \rightharpoonup} {\mathbf{#1}} } \)
\( \newcommand{\vecd}[1]{\overset{-\!-\!\rightharpoonup}{\vphantom{a}\smash {#1}}} \)
\(\newcommand{\avec}{\mathbf a}\) \(\newcommand{\bvec}{\mathbf b}\) \(\newcommand{\cvec}{\mathbf c}\) \(\newcommand{\dvec}{\mathbf d}\) \(\newcommand{\dtil}{\widetilde{\mathbf d}}\) \(\newcommand{\evec}{\mathbf e}\) \(\newcommand{\fvec}{\mathbf f}\) \(\newcommand{\nvec}{\mathbf n}\) \(\newcommand{\pvec}{\mathbf p}\) \(\newcommand{\qvec}{\mathbf q}\) \(\newcommand{\svec}{\mathbf s}\) \(\newcommand{\tvec}{\mathbf t}\) \(\newcommand{\uvec}{\mathbf u}\) \(\newcommand{\vvec}{\mathbf v}\) \(\newcommand{\wvec}{\mathbf w}\) \(\newcommand{\xvec}{\mathbf x}\) \(\newcommand{\yvec}{\mathbf y}\) \(\newcommand{\zvec}{\mathbf z}\) \(\newcommand{\rvec}{\mathbf r}\) \(\newcommand{\mvec}{\mathbf m}\) \(\newcommand{\zerovec}{\mathbf 0}\) \(\newcommand{\onevec}{\mathbf 1}\) \(\newcommand{\real}{\mathbb R}\) \(\newcommand{\twovec}[2]{\left[\begin{array}{r}#1 \\ #2 \end{array}\right]}\) \(\newcommand{\ctwovec}[2]{\left[\begin{array}{c}#1 \\ #2 \end{array}\right]}\) \(\newcommand{\threevec}[3]{\left[\begin{array}{r}#1 \\ #2 \\ #3 \end{array}\right]}\) \(\newcommand{\cthreevec}[3]{\left[\begin{array}{c}#1 \\ #2 \\ #3 \end{array}\right]}\) \(\newcommand{\fourvec}[4]{\left[\begin{array}{r}#1 \\ #2 \\ #3 \\ #4 \end{array}\right]}\) \(\newcommand{\cfourvec}[4]{\left[\begin{array}{c}#1 \\ #2 \\ #3 \\ #4 \end{array}\right]}\) \(\newcommand{\fivevec}[5]{\left[\begin{array}{r}#1 \\ #2 \\ #3 \\ #4 \\ #5 \\ \end{array}\right]}\) \(\newcommand{\cfivevec}[5]{\left[\begin{array}{c}#1 \\ #2 \\ #3 \\ #4 \\ #5 \\ \end{array}\right]}\) \(\newcommand{\mattwo}[4]{\left[\begin{array}{rr}#1 \amp #2 \\ #3 \amp #4 \\ \end{array}\right]}\) \(\newcommand{\laspan}[1]{\text{Span}\{#1\}}\) \(\newcommand{\bcal}{\cal B}\) \(\newcommand{\ccal}{\cal C}\) \(\newcommand{\scal}{\cal S}\) \(\newcommand{\wcal}{\cal W}\) \(\newcommand{\ecal}{\cal E}\) \(\newcommand{\coords}[2]{\left\{#1\right\}_{#2}}\) \(\newcommand{\gray}[1]{\color{gray}{#1}}\) \(\newcommand{\lgray}[1]{\color{lightgray}{#1}}\) \(\newcommand{\rank}{\operatorname{rank}}\) \(\newcommand{\row}{\text{Row}}\) \(\newcommand{\col}{\text{Col}}\) \(\renewcommand{\row}{\text{Row}}\) \(\newcommand{\nul}{\text{Nul}}\) \(\newcommand{\var}{\text{Var}}\) \(\newcommand{\corr}{\text{corr}}\) \(\newcommand{\len}[1]{\left|#1\right|}\) \(\newcommand{\bbar}{\overline{\bvec}}\) \(\newcommand{\bhat}{\widehat{\bvec}}\) \(\newcommand{\bperp}{\bvec^\perp}\) \(\newcommand{\xhat}{\widehat{\xvec}}\) \(\newcommand{\vhat}{\widehat{\vvec}}\) \(\newcommand{\uhat}{\widehat{\uvec}}\) \(\newcommand{\what}{\widehat{\wvec}}\) \(\newcommand{\Sighat}{\widehat{\Sigma}}\) \(\newcommand{\lt}{<}\) \(\newcommand{\gt}{>}\) \(\newcommand{\amp}{&}\) \(\definecolor{fillinmathshade}{gray}{0.9}\)- Describe how water is able to redistribute energy around the Earth.
- Describe how changes in temperature in one area of the Earth can cause changes in precipitation in others.
- Describe how changes in temperature can cause sea levels to rise and the effects of that rise.
- Describe how elevated levels of CO2 in the atmosphere contribute to the acidification of the oceans.
The most important aspect of the atmosphere for humans and other living beings is climate. Climate consists of long-term trends in weather and varies a lot over Earth’s surface. For example, the climate in desert regions of the world may be relatively hot and dry, but the weather in such regions may at times produce torrential rainfall or frigid temperatures. Of all the things that humans might do to irreversibly and catastrophically harm Mother Earth, the only home that they have or ever can have, the potential to change climate is the most serious. It is well established that climate has changed markedly in past times, most notably during several ice ages that each lasted for thousands of years. Volcanic eruptions noted in historical accounts have caused temporary cooling of the atmosphere and widespread hunger when summer growing seasons were cut short as a result. Tree-ring data indicate centuries-long droughts in parts of the world in the past, which resulted in the decline of some civilizations in the present-day U.S. Southwest, for example. Although these were natural events, recent weather data indicate changes in microclimate due to human activities. For example, some urban areas in Southeast Asia have become darker in recent decades due to particulate air pollution.
Weather refers to relatively short term variations in the state of the atmosphere as expressed by temperature, cloud cover, precipitation, relative humidity, atmospheric pressure and wind. Weather is driven by redistribution of energy in the atmosphere. A particularly important aspect of this redistribution is the energy released when precipitation forms. Earth receives solar energy most directly at the equator, so equatorial regions are warmer than regions farther north and south. A significant fraction of this energy moves away from the equator. This is largely done by convection in which heat is carried by masses of air. However, heat can also be carried as latent heat in the form of water vapor. The heat of vaporization of water is 2,259 joules per gram (J/g) meaning that 2,259 joules of heat energy are required to evaporate a gram of water without raising its temperature. This is a very high value, meaning that the evaporation of ocean water by solar energy falling on it in warmer regions absorbs an enormous amount of heat to form water vapor. This vapor may be carried elsewhere and condense to form rainfall. The heat energy released as the vapor condenses raises the temperature of the surrounding atmosphere.
As an example, heat energy from sunlight and from hot masses of air is converted to latent heat by the evaporation of ocean water off the west coast of Africa. Prevailing winds drive masses of air laden with water vapor westward across the ocean. Rainfall forms, releasing the energy from the latent heat of water and warming the air mass. The hot mass of air that results rises, creating a region of low pressure into which air flows in a circular manner. This can result in the formation of a whirling mass of air in the form of a hurricane that may strike Puerto Rico, Cuba, Florida, or other areas thousands of miles from the area where the water was originally evaporated from the ocean.
When the long-term trends in weather begin to significantly shift, the climate is said to change. Of all the things that humans may be doing that could change climate, emissions of large quantities of gases that cause atmospheric warming are the most serious. Although there could be some benefits of mild global warming, the net effect would almost certainly be bad, perhaps catastrophic. Climate models (which have been impressively accurate since they began in the 1970s) predict an average global temperature increase of 1.5–5 ̊ C by 2100 (Video\(\PageIndex{1}\)). That does not sound like much, but it is about as much as the temperature increase that occurred from the last ice age until now. As the global temperature warms, the types of energy redistribution that create hurricanes and other weather phenomena are predicted to happen more frequently. Especially if the warming is toward the high side of the projected range, this would greatly affect climate and rainfall. Some of these effects are described below.
Temperature and Precipitation
Temperature and precipitation are the two most direct impacts on the Earth’s climate due to climate change. As we saw in section 16.7, greenhouse gases in the atmosphere trap and prevent heat from leaving the Earth. Thus, increases in the levels of these gases cause more heat to be trapped and increase in the overall temperature of the Earth. You may have noticed in Figure 16.7.5 and Video \(\PageIndex{1}\) that the areas of hot and cold temperatures were not uniform across the United States or the globe. Why would this be the case? Again, this is due to the redistribution of energy in the Earth's atmosphere. Shifting air masses will cause temperatures to increase or decrease in different ways. In the US, the temperature is increasing more in the western states, the north, and in several areas along the Gulf and Atlantic coasts (Figure \(\PageIndex{1}\)). This is due to an increase in the number of record hot days and a decrease in the lows at night. For northern states, this has been especially prevalent over the winter months. For all 48 contiguous states, these shifts in temperatures can bring about a variety of results, both good and bad. It has resulted in the fall frost beginning later in the year and ending earlier in the spring, resulting in a longer growing season but possibly affecting the types of crops which may be grown. Warmer winters influence the amount of snow that falls and accumulates which threatens water supplies in western states.


Increases in greenhouse gases causes increases in temperature. But why does it also impact precipitation patterns? As was previously discussed, water vapor is an important component of the Earth’s atmosphere. As the air in the troposphere warms and cools, the amount of water vapor that it holds changes dramatically. In the southeastern US, they have very hot and humid summers. The high summer humidity in this region is possible because of the increased capability warm air has to hold water vapor. Simply put, warmer air can hold more water than cooler air. As air cools, its ability to hold water vapor decreases, and any excess water will leave the air as liquid water. A great example of this is the formation of dew on surfaces overnight. During the day, the temperature is warmer than it is at night, and the air has a relatively high holding capacity for water vapor. When the sun sets, the air cools, decreasing its capacity to hold water vapor. That extra water must go somewhere, and it does that by accumulating on surfaces. Similarly, when warm and cool air fronts collide, the chances for rain and thunderstorms increase. Furthermore, an increase in temperature enhances evaporation occurring at the Earth’s surface. This increased evaporation leads to greater concentrations of water vapor in the atmosphere which can lead to increased precipitation.
Changes in precipitation occur due to a variety of factors, including changes in atmospheric water vapor content due to changing temperature, as discussed above. Also at play is the heightened evaporation rate of water on Earth’s surface under warmer temperatures. More evaporation leads to more precipitation. Finally, shifts in wind patterns impact the distribution of precipitation events. As you can see in Figure \(\PageIndex{2}\), there are some areas of the globe that are expected to have an increase in precipitation, while others are expected to have a dramatic decrease. Some major population centers projected to have a moderate to severe precipitation increase include (population estimates of the metropolitan area given in parentheses): New York, United States (20.1 million); Bogotá, Colombia (12.1 m.); and Manila, Philippines (11.9 m.). What sort of challenges might these cities face in the future as they deal with this change in their climate?

In contrast, many more major metropolitan areas are projected to have a moderate to severe precipitation decrease (droughts) by the end of the 21st century. These include Delhi, India (21.8 m.); Lagos, Nigeria (21 m.); São Paulo, Brazil (20.9 m.); Kolkata, India (14.6 m.); Istanbul, Turkey (14.4 m.); Los Angeles, United States (13.3 m.); Rio de Janeiro, Brazil (12 m.); Paris, France (12 m.); and Lahore, Pakistan (11.3 m.). The largest challenge that these areas are likely to face is a dwindling water supply for drinking and agriculture. More details on challenges faced by societies to supply clean, reliable water to their populations and farms will be addressed in Section 16.11 and 16.12.
Additional challenges may be felt by all areas of the world with regard to changes in the seasonality or timing of precipitation, as well as the form in which precipitation falls (e.g., mist or downpour; rain, ice, or snow). All of these factors affect the availability of soil water for plants, the flow of rivers and streams, and the overall accessibility of water worldwide. Furthermore, scientists predict an increase in the number and severity of storms as climate change progresses.
Sea Level Rise
While we know that water continuously cycles around the world and that the overall quantity of water on Earth will not change due to global climate change, the distribution of this water is changing. In particular, oceans are increasing in volume while land ice stores (such as glaciers) are decreasing. This contributes to an increase in sea level worldwide (Figure \(\PageIndex{3}\)).

From the data in Figure \(\PageIndex{3}\), we see that sea level has increased at an average of 0.06 inches (0.15 cm) per year over the time period shown above. Most of this rise, however, has occurred within the most recent decades. The rate of increase has gone up to between 0.11 to 0.14 inches (0.28 to 0.36 cm) per year since 1993. There are two forces causing sea level to rise, both caused by climate change. First, the increased global temperature has caused increased ice melting in many regions of the globe. Melting land ice (such as the glacier shown in Figure \(\PageIndex{4}\)) contributes to sea level rise because water that used to be stored in ice sitting on top of land becomes running water which reaches the ocean through runoff. We also observe sea ice melting. Sea ice, such as the ice that covers the arctic regions of the Northern Hemisphere, has no land underneath it. When it melts, the water stays in the same locations, and the overall sea level does not change.

The second factor that influences sea level rise is a phenomenon called thermal expansion. Due to the physical properties of water, as water warms, its density decreases. A less dense substance will have fewer molecules in a given area than a more dense substance (Section 2.9). This means that as the overall temperature of the oceans increases due to global climate change, the same amount of water molecules will now occupy a slightly larger volume. This may not seem significant, but considering the 1.3 billion trillion liters (264 billion gallons) of water in the ocean, even a small change in density can have large effects on sea level as a whole.
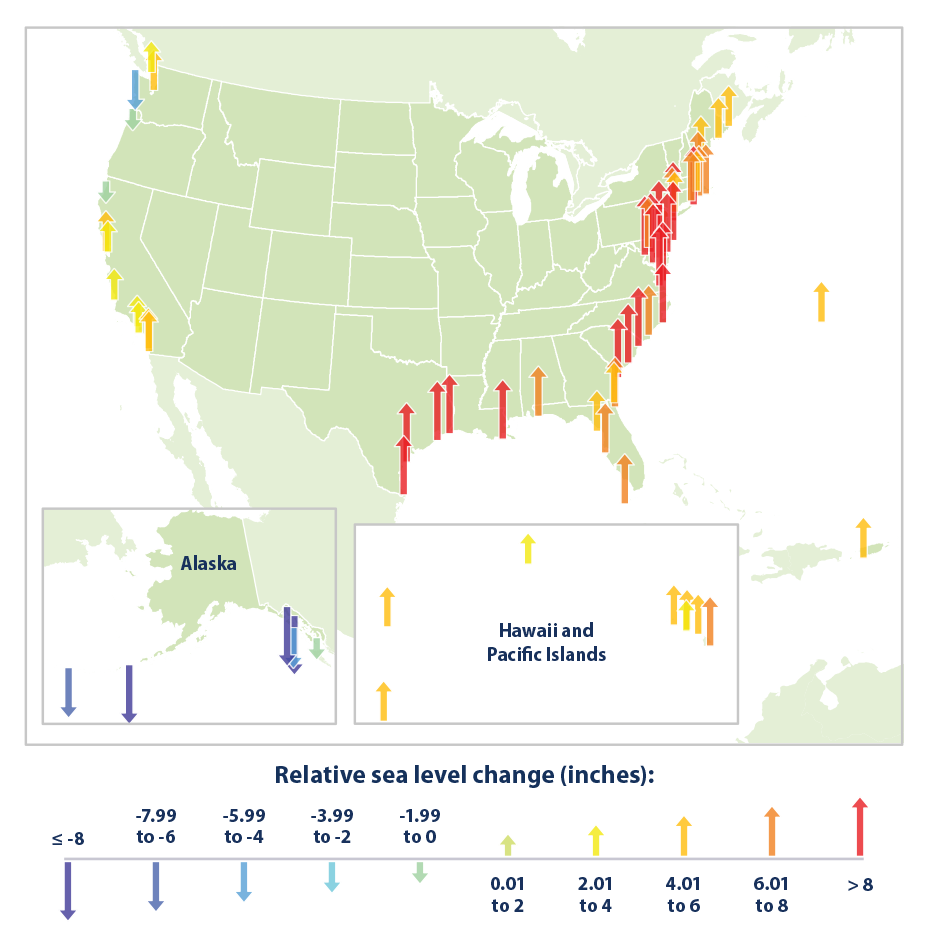
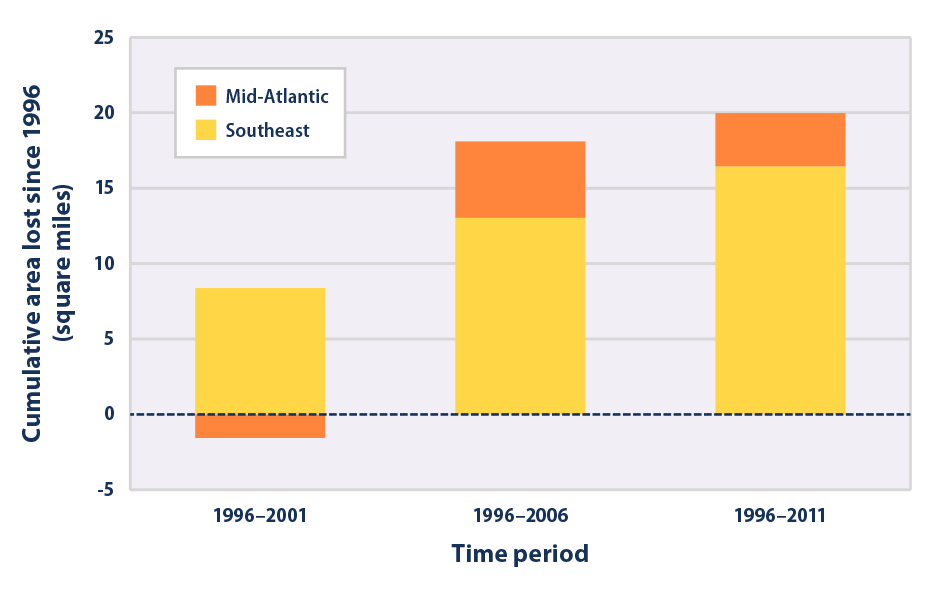
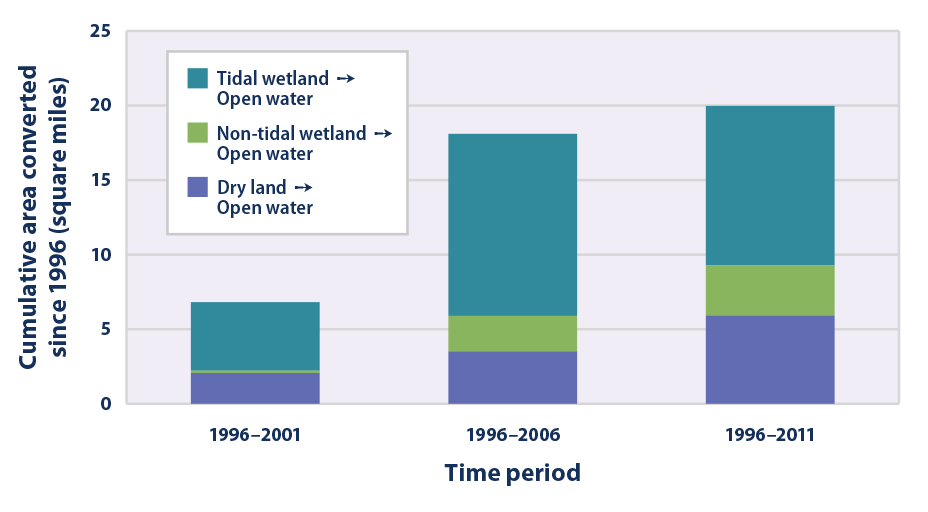
Scientists have already documented sea level rise in some areas of the world, including one familiar to most of us: the United States. Figure \(\PageIndex{5}\) shows the relative rise in sea level along the coasts of the US. The change is particularly drastic along the eastern coast. Figure \(\PageIndex{6}\) depicts the measured land area lost due to this increasing sea level since 1996. Note that the Southeast (defined here as the Atlantic coast of North Carolina south to Florida) is particularly susceptible to land area loss due to the gently sloping nature of the coastline. Moving northward into the Mid-Atlantic States (defined here as Virginia north to Long Island, New York), coastal habitats tend to have a steeper geography, which protects against some losses.
Although the rise in sea level will produce ecological effects that will be felt in the United States, catastrophic loss of life, property, or livelihood is not projected to happen for some time. This is due in part to large investments that we have made in infrastructure to protect our cities and farmlands. This is not the case in many areas of the world. The impacts of sea level rise on less industrialized nations such as Bangladesh, Maldives, Kiribati, and Fiji should be of concern to all nations and are being considered by groups such as the United Nations.
Ocean acidification
Dissolved CO2 is essential for many organisms, including shell-building animals and other organisms that form a hard coating on their exterior (e.g., shellfish, corals, Haptophyte algae). This hard coating is built out of aragonite, a mineral form of calcium carbonate, CaCO3. These organisms rely on the formation of carbonate ions, CO32-, from dissolved CO2 through a natural, chemical reaction that occurs in the oceans and lakes of the world. This takes place through a two-step reaction, where bicarbonate (HCO3-) is formed as an intermediate, and hydrogen ions (H+) are generated (Equations \(\PageIndex{1}\) and \(\PageIndex{2}\)).
\[{\mathrm{CO}}_2\;+\:{\mathrm H}_2\mathrm O\;\leftrightarrow\;\mathrm H^+\:+\:\mathrm{HCO}_3^-\;\]
\[{\mathrm{HCO}}_3^-\;\leftrightarrow\;\mathrm H^+\:+\:{\mathrm{CO}}_3^{2-}\]
As you can see, both Equations \(\PageIndex{1}\) and \(\PageIndex{2}\) each produce one H+ . This is significant to water chemistry because an increase in H+ concentration means a decrease in the pH of the water. As we learned (or will learn) in Section 15.7, a lower pH means that the liquid is more acidic. Thus, an increase in CO2 in the atmosphere causes additional CO2 to be dissolved in the ocean. This means that more CO2 in the atmosphere leads to more acidic ocean environments. Unfortunately for shell-building animals, the buildup of H+ in the more acidic ocean environment blocks the absorption of calcium and CO32- and makes the formation of aragonite more difficult. An aragonite deficit is already being documented in many of the world’s oceans, as shown in Figure \(\PageIndex{7}\).
The increasing acidity of the world’s oceans is resulting in habitat changes across the globe. This is only expected to worsen as atmospheric CO2 levels continue to increase. Many organisms, including the corals that are the foundation species of the beautiful coral reefs, are very sensitive to changes in ocean pH. Scientists have documented cases of ecosystem destruction through coral bleaching, caused by the effects of climate change including ocean acidification and increased temperature. For more information, visit the NOAA Coral Reef Conservation Program website: coralreef.noaa.gov/issues/.

Summary
- Climate change includes both global warming driven by human-induced emissions of greenhouse gases and the resulting large-scale shifts in weather patterns.
- Changes in temperature and precipitation occur with global warming because of the ability of water to absorb and release large quantities of heat as it evaporates and then condenses as rain. Changes to these atmospheric seas due to increased global temperatures causes certain areas to have warmer temperatures or greater precipitation while others have less.
- Melting land ice and thermal expansion of water causes sea levels to rise. In low-lying areas, this is removing wetlands that provide a buffer to flooding.
- Increased levels of CO2 in the atmosphere leads to higher dissolved levels in oceans. The reaction between CO2 and water leads to the formation of carbonic acid, resulting in the acidification of the oceans. When oceans become too acidic, shell-building animals are unable to absorb Ca2+ and CO32- to form their exoskeletons.
Contributors and Attributions
- Libretext: Introduction to Environmental Science (Zendher et al.)
- US EPA
- National Oceanic and Atmospheric Administration
- Stanley E. Manahan (University of Missouri)
- Vicki MacMurdo (Anoka-Ramsey Community College)