20.8: Spectroscopy of Carboxylic Acids and Nitriles
- Page ID
- 36557
\( \newcommand{\vecs}[1]{\overset { \scriptstyle \rightharpoonup} {\mathbf{#1}} } \)
\( \newcommand{\vecd}[1]{\overset{-\!-\!\rightharpoonup}{\vphantom{a}\smash {#1}}} \)
\( \newcommand{\id}{\mathrm{id}}\) \( \newcommand{\Span}{\mathrm{span}}\)
( \newcommand{\kernel}{\mathrm{null}\,}\) \( \newcommand{\range}{\mathrm{range}\,}\)
\( \newcommand{\RealPart}{\mathrm{Re}}\) \( \newcommand{\ImaginaryPart}{\mathrm{Im}}\)
\( \newcommand{\Argument}{\mathrm{Arg}}\) \( \newcommand{\norm}[1]{\| #1 \|}\)
\( \newcommand{\inner}[2]{\langle #1, #2 \rangle}\)
\( \newcommand{\Span}{\mathrm{span}}\)
\( \newcommand{\id}{\mathrm{id}}\)
\( \newcommand{\Span}{\mathrm{span}}\)
\( \newcommand{\kernel}{\mathrm{null}\,}\)
\( \newcommand{\range}{\mathrm{range}\,}\)
\( \newcommand{\RealPart}{\mathrm{Re}}\)
\( \newcommand{\ImaginaryPart}{\mathrm{Im}}\)
\( \newcommand{\Argument}{\mathrm{Arg}}\)
\( \newcommand{\norm}[1]{\| #1 \|}\)
\( \newcommand{\inner}[2]{\langle #1, #2 \rangle}\)
\( \newcommand{\Span}{\mathrm{span}}\) \( \newcommand{\AA}{\unicode[.8,0]{x212B}}\)
\( \newcommand{\vectorA}[1]{\vec{#1}} % arrow\)
\( \newcommand{\vectorAt}[1]{\vec{\text{#1}}} % arrow\)
\( \newcommand{\vectorB}[1]{\overset { \scriptstyle \rightharpoonup} {\mathbf{#1}} } \)
\( \newcommand{\vectorC}[1]{\textbf{#1}} \)
\( \newcommand{\vectorD}[1]{\overrightarrow{#1}} \)
\( \newcommand{\vectorDt}[1]{\overrightarrow{\text{#1}}} \)
\( \newcommand{\vectE}[1]{\overset{-\!-\!\rightharpoonup}{\vphantom{a}\smash{\mathbf {#1}}}} \)
\( \newcommand{\vecs}[1]{\overset { \scriptstyle \rightharpoonup} {\mathbf{#1}} } \)
\( \newcommand{\vecd}[1]{\overset{-\!-\!\rightharpoonup}{\vphantom{a}\smash {#1}}} \)
\(\newcommand{\avec}{\mathbf a}\) \(\newcommand{\bvec}{\mathbf b}\) \(\newcommand{\cvec}{\mathbf c}\) \(\newcommand{\dvec}{\mathbf d}\) \(\newcommand{\dtil}{\widetilde{\mathbf d}}\) \(\newcommand{\evec}{\mathbf e}\) \(\newcommand{\fvec}{\mathbf f}\) \(\newcommand{\nvec}{\mathbf n}\) \(\newcommand{\pvec}{\mathbf p}\) \(\newcommand{\qvec}{\mathbf q}\) \(\newcommand{\svec}{\mathbf s}\) \(\newcommand{\tvec}{\mathbf t}\) \(\newcommand{\uvec}{\mathbf u}\) \(\newcommand{\vvec}{\mathbf v}\) \(\newcommand{\wvec}{\mathbf w}\) \(\newcommand{\xvec}{\mathbf x}\) \(\newcommand{\yvec}{\mathbf y}\) \(\newcommand{\zvec}{\mathbf z}\) \(\newcommand{\rvec}{\mathbf r}\) \(\newcommand{\mvec}{\mathbf m}\) \(\newcommand{\zerovec}{\mathbf 0}\) \(\newcommand{\onevec}{\mathbf 1}\) \(\newcommand{\real}{\mathbb R}\) \(\newcommand{\twovec}[2]{\left[\begin{array}{r}#1 \\ #2 \end{array}\right]}\) \(\newcommand{\ctwovec}[2]{\left[\begin{array}{c}#1 \\ #2 \end{array}\right]}\) \(\newcommand{\threevec}[3]{\left[\begin{array}{r}#1 \\ #2 \\ #3 \end{array}\right]}\) \(\newcommand{\cthreevec}[3]{\left[\begin{array}{c}#1 \\ #2 \\ #3 \end{array}\right]}\) \(\newcommand{\fourvec}[4]{\left[\begin{array}{r}#1 \\ #2 \\ #3 \\ #4 \end{array}\right]}\) \(\newcommand{\cfourvec}[4]{\left[\begin{array}{c}#1 \\ #2 \\ #3 \\ #4 \end{array}\right]}\) \(\newcommand{\fivevec}[5]{\left[\begin{array}{r}#1 \\ #2 \\ #3 \\ #4 \\ #5 \\ \end{array}\right]}\) \(\newcommand{\cfivevec}[5]{\left[\begin{array}{c}#1 \\ #2 \\ #3 \\ #4 \\ #5 \\ \end{array}\right]}\) \(\newcommand{\mattwo}[4]{\left[\begin{array}{rr}#1 \amp #2 \\ #3 \amp #4 \\ \end{array}\right]}\) \(\newcommand{\laspan}[1]{\text{Span}\{#1\}}\) \(\newcommand{\bcal}{\cal B}\) \(\newcommand{\ccal}{\cal C}\) \(\newcommand{\scal}{\cal S}\) \(\newcommand{\wcal}{\cal W}\) \(\newcommand{\ecal}{\cal E}\) \(\newcommand{\coords}[2]{\left\{#1\right\}_{#2}}\) \(\newcommand{\gray}[1]{\color{gray}{#1}}\) \(\newcommand{\lgray}[1]{\color{lightgray}{#1}}\) \(\newcommand{\rank}{\operatorname{rank}}\) \(\newcommand{\row}{\text{Row}}\) \(\newcommand{\col}{\text{Col}}\) \(\renewcommand{\row}{\text{Row}}\) \(\newcommand{\nul}{\text{Nul}}\) \(\newcommand{\var}{\text{Var}}\) \(\newcommand{\corr}{\text{corr}}\) \(\newcommand{\len}[1]{\left|#1\right|}\) \(\newcommand{\bbar}{\overline{\bvec}}\) \(\newcommand{\bhat}{\widehat{\bvec}}\) \(\newcommand{\bperp}{\bvec^\perp}\) \(\newcommand{\xhat}{\widehat{\xvec}}\) \(\newcommand{\vhat}{\widehat{\vvec}}\) \(\newcommand{\uhat}{\widehat{\uvec}}\) \(\newcommand{\what}{\widehat{\wvec}}\) \(\newcommand{\Sighat}{\widehat{\Sigma}}\) \(\newcommand{\lt}{<}\) \(\newcommand{\gt}{>}\) \(\newcommand{\amp}{&}\) \(\definecolor{fillinmathshade}{gray}{0.9}\)After completing this section, you should be able to
- identify the two characteristic infrared absorptions displayed by all carboxylic acids.
- state the approximate 1H NMR absorption of a carboxylic acid proton.
- use infrared and NMR spectroscopy data to assist in the identification of an unknown carboxylic acid, with or without the assistance of a table of characteristic absorptions.
Spectroscopy of Carboxylic Acids
Infrared Spectroscopy
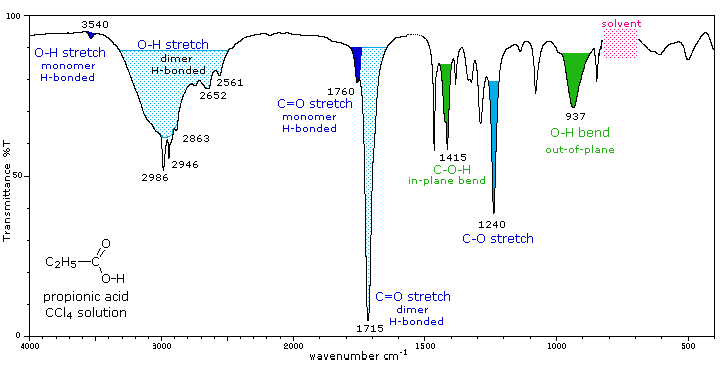
The carboxyl group is associated with two characteristic infrared stretching absorptions which change markedly with hydrogen bonding. The spectrum of propionic acid (propanoic acid) dissolved in CCl4, shown below, is illustrative. Carboxylic acids exist predominantly as hydrogen bonded dimers in condensed phases.
The Hydrogen Bonding Dimer of Carboxylic Acids
The O-H stretching absorption for such dimers is very strong and broad, extending from 2500 to 3300 cm-1. This absorption overlaps the sharper C-H stretching peaks, which may be seen extending beyond the O-H envelope at 2990, 2950 and 2870 cm-1. The smaller peaks protruding near 2655 and 2560 cm-1 are characteristic of the dimer. In ether solvents a sharper hydrogen bonded monomer absorption near 3500 cm-1 is observed, due to competition of the ether oxygen as a hydrogen bond acceptor. The carbonyl stretching frequency of the dimer is found near 1710 cm-1, but is increased by 25 cm-1 or more in the monomeric state. Other characteristic stretching and bending absorptions are marked in the spectrum.

The Infrared Spectrum of Propanoic Acid
1H Nuclear Magnetic Spectroscopy
The acidic O-H protons of carboxylic acids are highly deshielded due to the electronegativity of oxygen and anisotropy from the C=O carbonyl bond. They tend to be among the least shielded protons appearing far downfield in the 10–12 ppm region which is considered distinctive for carboxylic acids. Due to hydrogen bonding the proton of a carboxylic acid often appears as a broad singlet and adding D2O causes the signal to disappear due to hydrogen-deuterium exchange. Protons on carbons adjacent to a carboxylic acid absorb in the 2-3 ppm region. Some deshielding occurs due to the fact that the carbonyl oxygen is pulling electron density away from the carbonyl carbon which inductively pulls electron density away from the adjacent carbon.
The Typical 1H Peaks for a Carboxylic Acid
The 1H Peaks for Butanoic Acid
A 1H NMR Spectra for Butanoic Acid
13C Nuclear Magnetic Spectroscopy
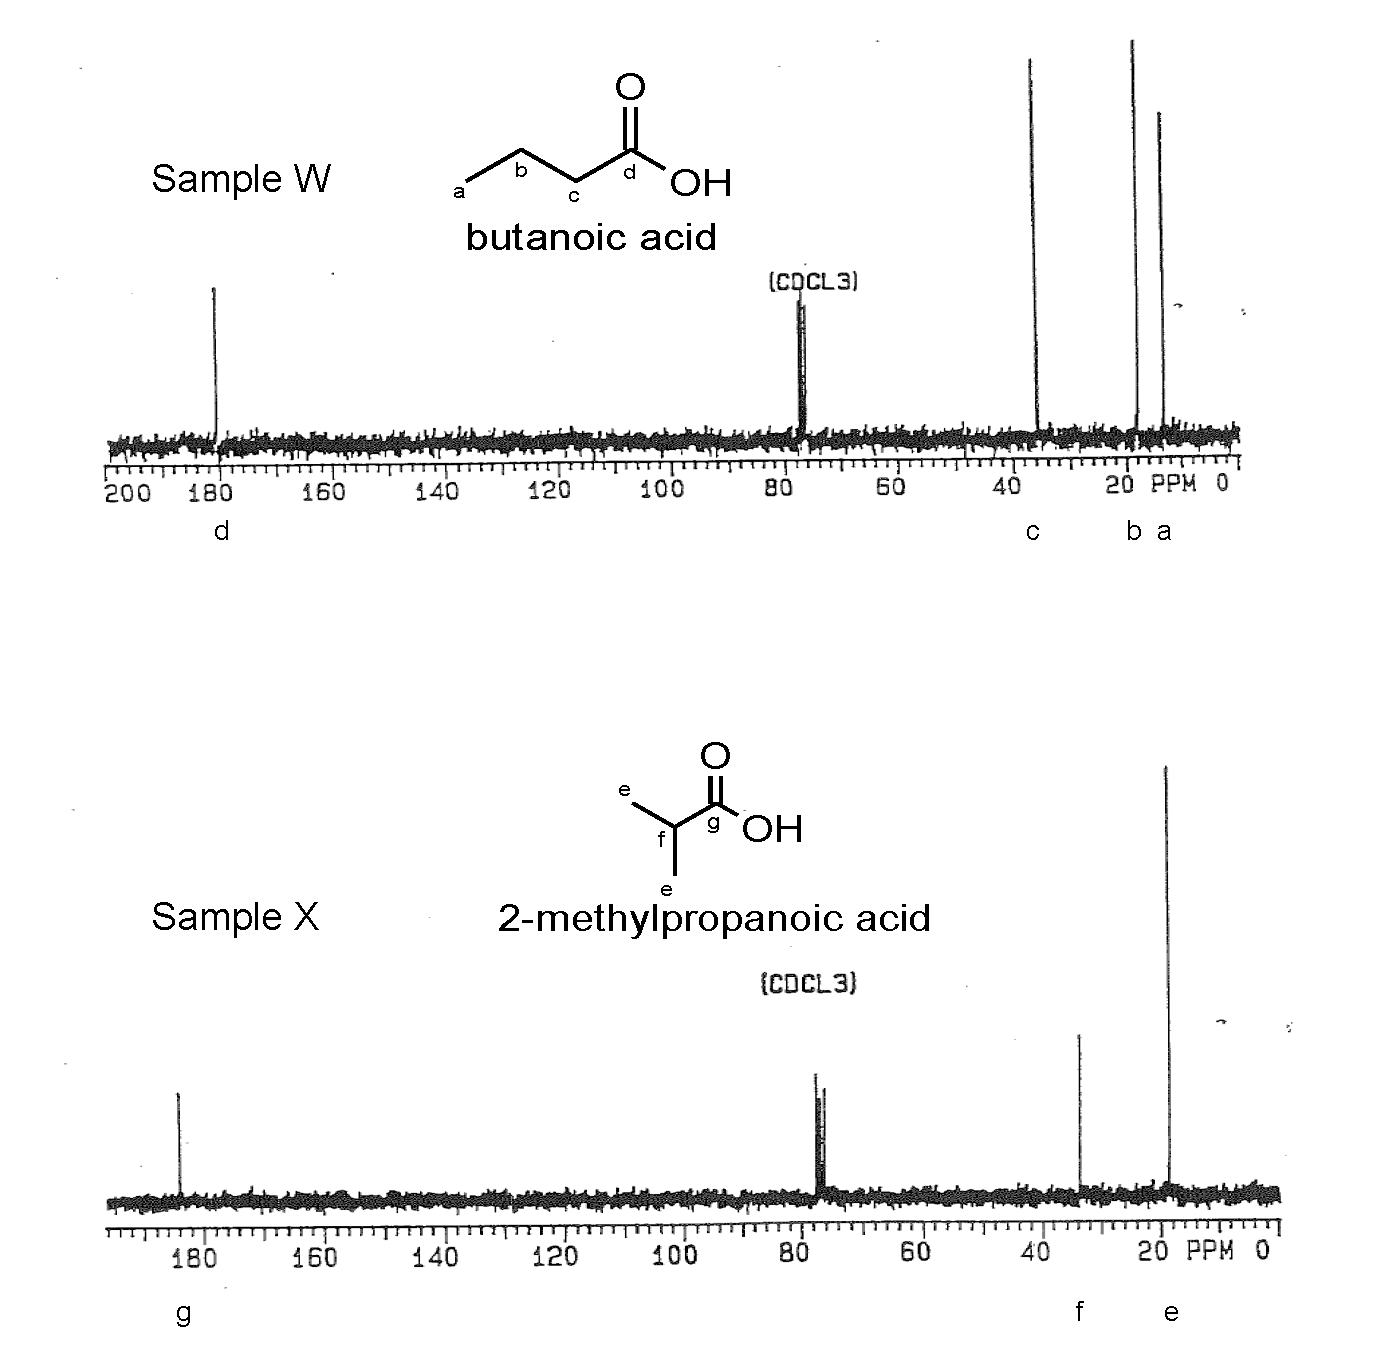
The carbonyl carbon of a carboxylic acid is strongly deshielded (160-180 ppm) due to the presence of the highly electronegative oxygen. However, they are not as deshielded as the carbonyl carbon of an aldehyde or ketone (180-220 ppm).
The 13C Peaks for Butanoic Acid
A 13C NMR Spectra for Butanoic Acid
UV/Vis Spectroscopy
Without additional conjugation, carboxylic acids absorb at about 210 nm, which is too low to be useful.Mass Spectrometry
In short chain acids, peaks due to the loss of OH (molecular ion less 17) and COOH (molecular ion less 45) are prominent due to cleavage of bonds next to C=O.
Spectroscopy of Nitriles
Infrared Spectroscopy
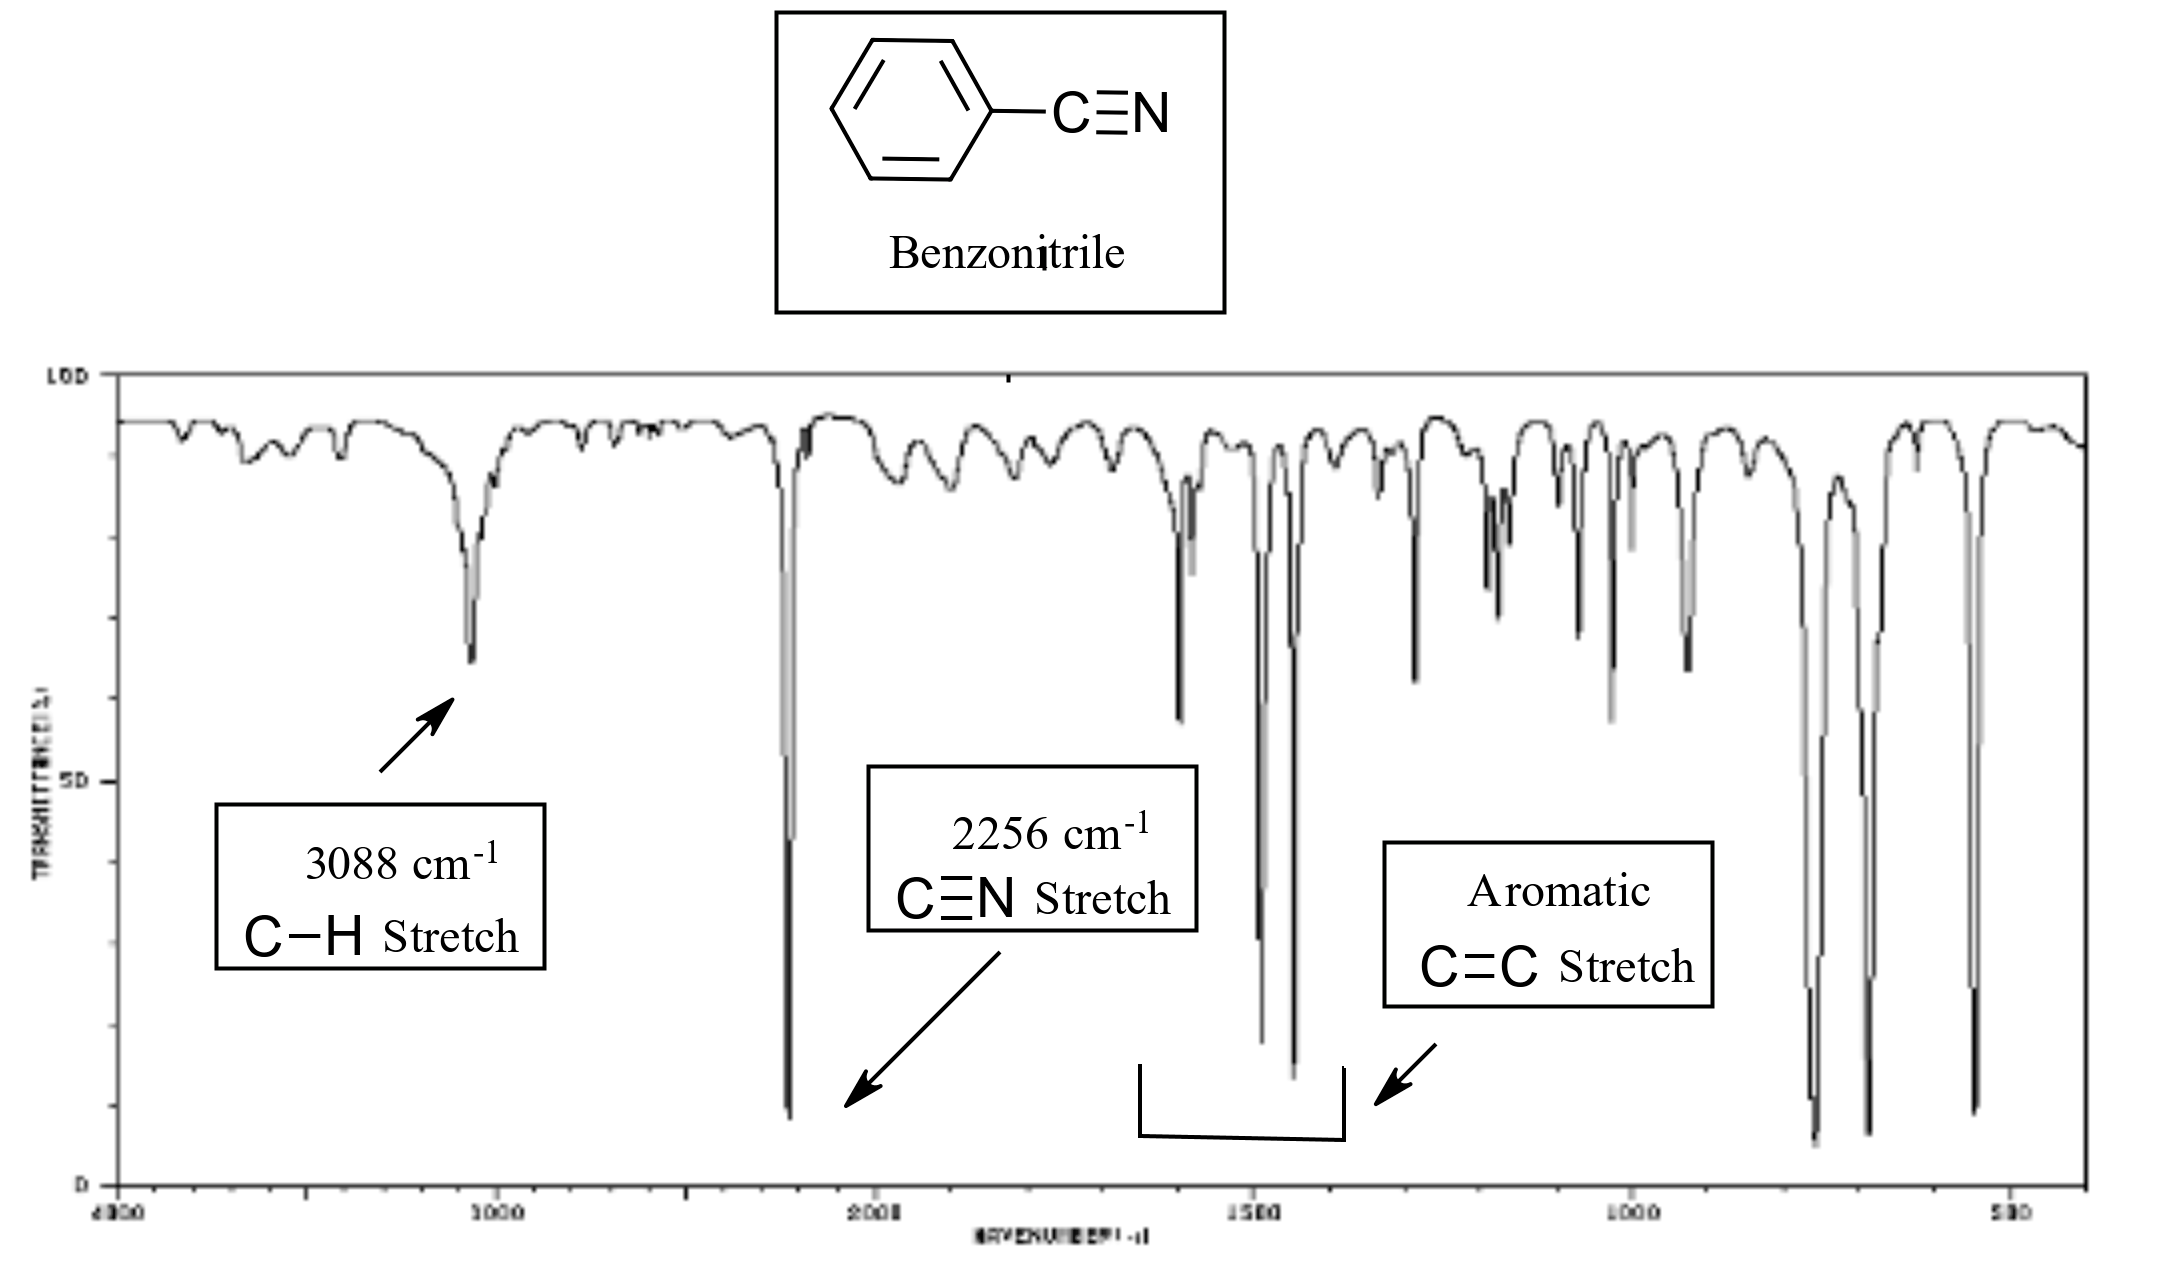
The CN triple bond stretch of nitriles appears in a distinctive region of an IR spectra, near 2250 cm-1. One of the only other absorptions to appear in this region is the CC triple bond stretch of an alkyne (2100-2250 cm-1).

Infrared Spectrum of Benzonitrile
1H Nuclear Magnetic Spectroscopy
Protons on carbons adjacent to a nitrile absorb in the 2-3 ppm region. Some deshielding occurs due to the fact that the sp hybridized nitrile carbon is more electronegative than the adjacent sp3 hybridized carbon.
13C Nuclear Magnetic Spectroscopy
The nitrile carbon absorbs in the 115–120 ppm region which not as far downfield as a typical carbonyl carbon (180-220 ppm).
UV/Vis Spectroscopy
Most nitriles do not show absorption above 200 nm which does not make UV/Vis spectroscopy a useful tool to characterize them.
Mass Spectrometry
The molecular ion (M+) peaks of simple nitriles are often weak or not present in a mass spectra. There is often a M-1 peak due to the loss of a -H.
Mechanism for the Formation of a M-1 Peak in Mass Spectra
Mass Spectra of Propanenitrile
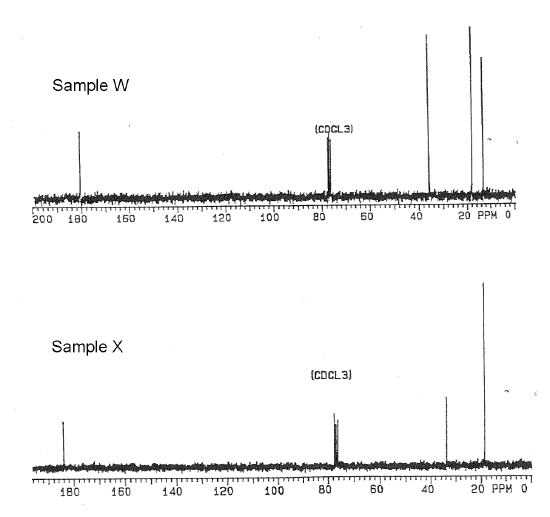
1. Sample W is a reactant for a wide range of biochemical processes. Sample X was isolated from vanilla beans. Elemental analysis indicated the compounds are structural isomers with the composition: 54.52% C, 9.16% H and 36.32% O. The IR spectrum for each compound showed a broad absorption from 3500 - 2500 cm-1 and a strong band near 1710 cm-1. The 1H NMR is being serviced, so only the 13C NMR spectra shown below were available.
Name and draw the bond-line structures for Samples W and X and correlate the 13C NMR spectral signals to their respective compounds.
IR spectrum of benzonitrile. Source: SDBSWeb : http://riodb01.ibase.aist.go.jp/sdbs/ (National Institute of Advanced Industrial Science and Technology of Japan, 14 July 2008)


