7.8: Protein Analysis using Electrospray Ionization Mass Spectroscopy
- Page ID
- 55914
\( \newcommand{\vecs}[1]{\overset { \scriptstyle \rightharpoonup} {\mathbf{#1}} } \)
\( \newcommand{\vecd}[1]{\overset{-\!-\!\rightharpoonup}{\vphantom{a}\smash {#1}}} \)
\( \newcommand{\id}{\mathrm{id}}\) \( \newcommand{\Span}{\mathrm{span}}\)
( \newcommand{\kernel}{\mathrm{null}\,}\) \( \newcommand{\range}{\mathrm{range}\,}\)
\( \newcommand{\RealPart}{\mathrm{Re}}\) \( \newcommand{\ImaginaryPart}{\mathrm{Im}}\)
\( \newcommand{\Argument}{\mathrm{Arg}}\) \( \newcommand{\norm}[1]{\| #1 \|}\)
\( \newcommand{\inner}[2]{\langle #1, #2 \rangle}\)
\( \newcommand{\Span}{\mathrm{span}}\)
\( \newcommand{\id}{\mathrm{id}}\)
\( \newcommand{\Span}{\mathrm{span}}\)
\( \newcommand{\kernel}{\mathrm{null}\,}\)
\( \newcommand{\range}{\mathrm{range}\,}\)
\( \newcommand{\RealPart}{\mathrm{Re}}\)
\( \newcommand{\ImaginaryPart}{\mathrm{Im}}\)
\( \newcommand{\Argument}{\mathrm{Arg}}\)
\( \newcommand{\norm}[1]{\| #1 \|}\)
\( \newcommand{\inner}[2]{\langle #1, #2 \rangle}\)
\( \newcommand{\Span}{\mathrm{span}}\) \( \newcommand{\AA}{\unicode[.8,0]{x212B}}\)
\( \newcommand{\vectorA}[1]{\vec{#1}} % arrow\)
\( \newcommand{\vectorAt}[1]{\vec{\text{#1}}} % arrow\)
\( \newcommand{\vectorB}[1]{\overset { \scriptstyle \rightharpoonup} {\mathbf{#1}} } \)
\( \newcommand{\vectorC}[1]{\textbf{#1}} \)
\( \newcommand{\vectorD}[1]{\overrightarrow{#1}} \)
\( \newcommand{\vectorDt}[1]{\overrightarrow{\text{#1}}} \)
\( \newcommand{\vectE}[1]{\overset{-\!-\!\rightharpoonup}{\vphantom{a}\smash{\mathbf {#1}}}} \)
\( \newcommand{\vecs}[1]{\overset { \scriptstyle \rightharpoonup} {\mathbf{#1}} } \)
\( \newcommand{\vecd}[1]{\overset{-\!-\!\rightharpoonup}{\vphantom{a}\smash {#1}}} \)
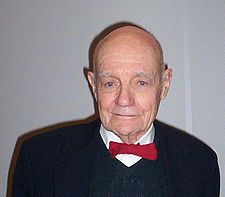
\(\newcommand{\avec}{\mathbf a}\) \(\newcommand{\bvec}{\mathbf b}\) \(\newcommand{\cvec}{\mathbf c}\) \(\newcommand{\dvec}{\mathbf d}\) \(\newcommand{\dtil}{\widetilde{\mathbf d}}\) \(\newcommand{\evec}{\mathbf e}\) \(\newcommand{\fvec}{\mathbf f}\) \(\newcommand{\nvec}{\mathbf n}\) \(\newcommand{\pvec}{\mathbf p}\) \(\newcommand{\qvec}{\mathbf q}\) \(\newcommand{\svec}{\mathbf s}\) \(\newcommand{\tvec}{\mathbf t}\) \(\newcommand{\uvec}{\mathbf u}\) \(\newcommand{\vvec}{\mathbf v}\) \(\newcommand{\wvec}{\mathbf w}\) \(\newcommand{\xvec}{\mathbf x}\) \(\newcommand{\yvec}{\mathbf y}\) \(\newcommand{\zvec}{\mathbf z}\) \(\newcommand{\rvec}{\mathbf r}\) \(\newcommand{\mvec}{\mathbf m}\) \(\newcommand{\zerovec}{\mathbf 0}\) \(\newcommand{\onevec}{\mathbf 1}\) \(\newcommand{\real}{\mathbb R}\) \(\newcommand{\twovec}[2]{\left[\begin{array}{r}#1 \\ #2 \end{array}\right]}\) \(\newcommand{\ctwovec}[2]{\left[\begin{array}{c}#1 \\ #2 \end{array}\right]}\) \(\newcommand{\threevec}[3]{\left[\begin{array}{r}#1 \\ #2 \\ #3 \end{array}\right]}\) \(\newcommand{\cthreevec}[3]{\left[\begin{array}{c}#1 \\ #2 \\ #3 \end{array}\right]}\) \(\newcommand{\fourvec}[4]{\left[\begin{array}{r}#1 \\ #2 \\ #3 \\ #4 \end{array}\right]}\) \(\newcommand{\cfourvec}[4]{\left[\begin{array}{c}#1 \\ #2 \\ #3 \\ #4 \end{array}\right]}\) \(\newcommand{\fivevec}[5]{\left[\begin{array}{r}#1 \\ #2 \\ #3 \\ #4 \\ #5 \\ \end{array}\right]}\) \(\newcommand{\cfivevec}[5]{\left[\begin{array}{c}#1 \\ #2 \\ #3 \\ #4 \\ #5 \\ \end{array}\right]}\) \(\newcommand{\mattwo}[4]{\left[\begin{array}{rr}#1 \amp #2 \\ #3 \amp #4 \\ \end{array}\right]}\) \(\newcommand{\laspan}[1]{\text{Span}\{#1\}}\) \(\newcommand{\bcal}{\cal B}\) \(\newcommand{\ccal}{\cal C}\) \(\newcommand{\scal}{\cal S}\) \(\newcommand{\wcal}{\cal W}\) \(\newcommand{\ecal}{\cal E}\) \(\newcommand{\coords}[2]{\left\{#1\right\}_{#2}}\) \(\newcommand{\gray}[1]{\color{gray}{#1}}\) \(\newcommand{\lgray}[1]{\color{lightgray}{#1}}\) \(\newcommand{\rank}{\operatorname{rank}}\) \(\newcommand{\row}{\text{Row}}\) \(\newcommand{\col}{\text{Col}}\) \(\renewcommand{\row}{\text{Row}}\) \(\newcommand{\nul}{\text{Nul}}\) \(\newcommand{\var}{\text{Var}}\) \(\newcommand{\corr}{\text{corr}}\) \(\newcommand{\len}[1]{\left|#1\right|}\) \(\newcommand{\bbar}{\overline{\bvec}}\) \(\newcommand{\bhat}{\widehat{\bvec}}\) \(\newcommand{\bperp}{\bvec^\perp}\) \(\newcommand{\xhat}{\widehat{\xvec}}\) \(\newcommand{\vhat}{\widehat{\vvec}}\) \(\newcommand{\uhat}{\widehat{\uvec}}\) \(\newcommand{\what}{\widehat{\wvec}}\) \(\newcommand{\Sighat}{\widehat{\Sigma}}\) \(\newcommand{\lt}{<}\) \(\newcommand{\gt}{>}\) \(\newcommand{\amp}{&}\) \(\definecolor{fillinmathshade}{gray}{0.9}\)Electrospray ionization-mass spectrometry (ESI-MS) is an analytical method that focuses on macromolecular structural determination. The unique component of ESI-MS is the electrospray ionization. The development of electrospraying, the process of charging a liquid into a fine aerosol, was completed in the 1960’s when Malcolm Dole (Figure \(\PageIndex{1}\)) demonstrated the ability of chemical species to be separated through electrospray techniques. With this important turn of events, the combination of ESI and MS was feasible and was later developed by John B. Fenn (Figure \(\PageIndex{2}\)), as a functional analytical method that could provide beneficial information about the structure and size of a protein. Fenn shared the Nobel Prize in 2002, with Koichi Tanaka (Figure \(\PageIndex{3}\) and Kurt Wuthrich (Figure \(\PageIndex{4}\)) for the development of ESI-MS.



ESI-MS is the process through which proteins, or macromolecules, in the liquid phase are charged and fragmented into smaller aerosol droplets. These aerosol droplets lose their solvent and propel the charged fragments into the gas phase in several components that vary by charge. These components can then be detected by a mass spectrometer. The recent boom and development of ESI-MS is attributed to its benefits in characterizing and analyzing macromolecules, specifically biologically important macromolecules such as proteins.
How does ESI-MS Function?
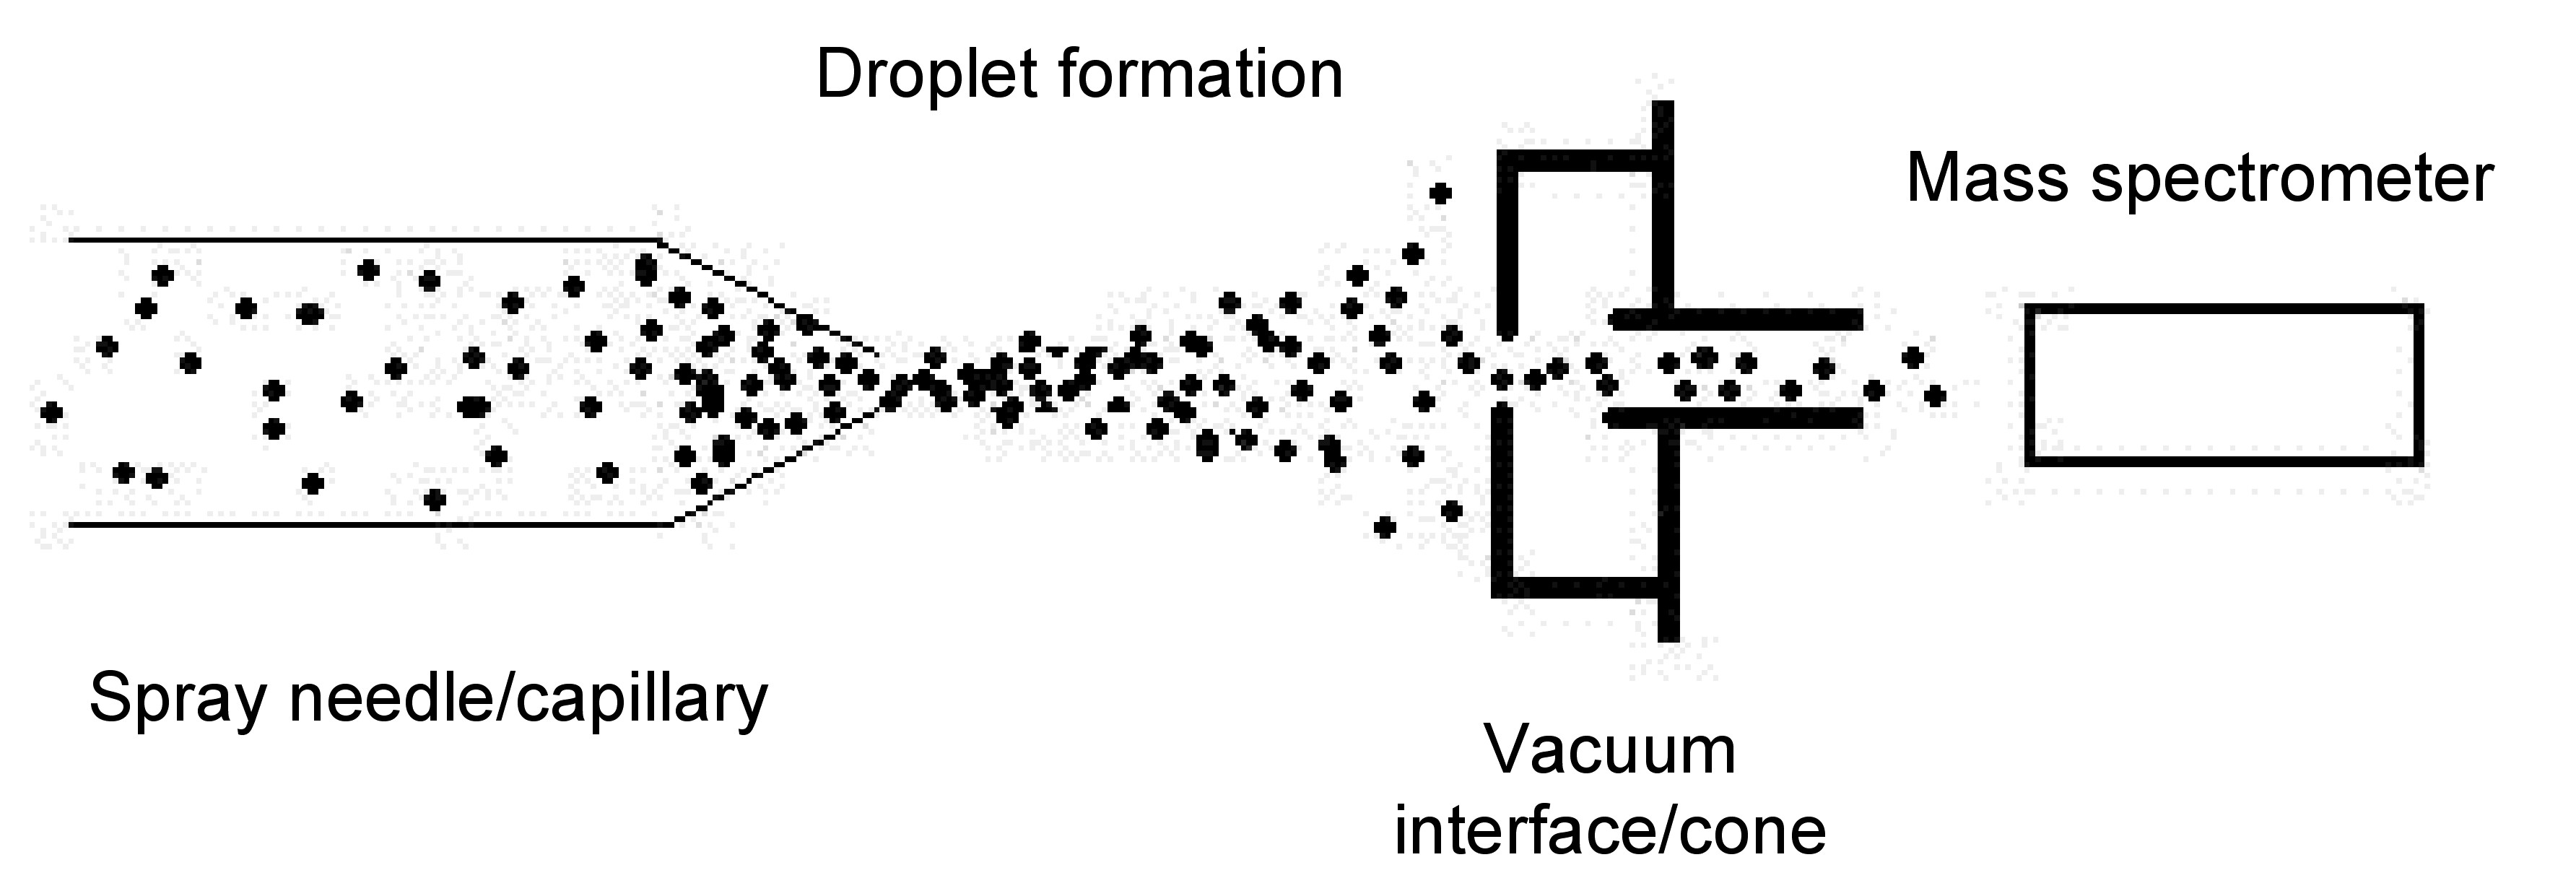
ESI-MS is a process that requires the sample to be in liquid solution, so that tiny droplets may be ionized and analyzed individually by a mass spectrometer. The following delineates the processes that occur as relevant to Figure \(\PageIndex{5}\):
- Spray needle/capillary- The liquid solution of the desired macromolecule is introduced into the system through this needle. The needle is highly charged via an outside voltage source that maintains the charge constant across the needle. The normal charge for a needle is approximately 2.5 to 4 kV. The voltage causes the large droplets to fragment into small droplets based on charge that is accumulated from the protein constituent parts, and the liquid is now in the gas phase.
- Droplet formation- The droplets that are expelled from the needle are smaller than initially, and as a result the solvent will evaporate. The smaller droplets then start increasing their charge density on the surface as the volume decreases. As the droplets near the Rayleigh limit, Coulombic interactions of the droplet equal the surface tension of the droplet, a Coulombic explosion occurs that further breaks the droplet into minute fractions, including the isolated analyte with charge.
- Vacuum interface/cone - This portion of the device allows for the droplets to align in a small trail and pass through to the mass spectrometer. Alignment occurs because of the similarity and differences in charges amongst all the droplets. All the droplets are ionized to positive charges through addition of protons to varying basic sites on the droplets, yet all the charges vary in magnitude dependent upon the number of basic sites available for protonation. The receiving end or the cone has the opposite charge of the spray needle, causing an attraction between the cone and the droplets.
- Mass spectrometer- The charged particles then reach the mass spectrometer and are deflected based on the charge of each particle. Deflection occurs by the quadrupole magnet of the mass spectrometer. The different deflection paths of the ions occur due to the strength of the interaction with the magnetic field. This leads to various paths based on a mass/charge (m/z) ratio. The particles are then read by the ion detector, as they arrive, providing a spectrum based on m/z ratio.
What Data is Provided by ESI-MS?
As implied by the name, the data produced from this technique is a mass spectrometry spectrum. Without delving too deeply into the topic of mass spectrometry, which is out of the true scope of this module, a slight explanation will be provided here. The mass spectrometer separates particles based on a magnetic field created by a quadrupole magnet. The strength of the interaction varies on the charge the particles carry. The amount of deflection or strength of interaction is determined by the ion detector and quantified into a mass/charge (m/z) ratio. Because of this information, determination of chemical composition or peptide structure can easily be managed as is explained in greater detail in the following section.
Interpretation of a Typical MS Spectrum
Interpreting the mass spectrometry data involves understanding the m/z ratio. The knowledge necessary to understanding the interpretation of the spectrum is that the peaks correspond to portions of the whole molecule. That is to say, hypothetically, if you put a human body in the mass spectrometer, one peak would coincide with one arm, another peak would coincide with the arm and the abdomen, etc. The general idea behind these peaks, is that an overlay would paint the entire picture, or in the case of the hypothetical example, provide the image of the human body. The m/z ratio defines these portions based on the charges carried by them; thus the terminology of the mass/charge ratio. The more charges a portion of the macromolecule or protein holds, the smaller the m/z ratio will be and the farther left it will appear on the spectrum. The fundamental concept behind interpretation involves understanding that the peaks are interrelated, and thus the math calculations may be carried out to provide relevant information of the protein or macromolecule being analyzed.
Calculations of m/z of the MS Spectrum Peaks
As mentioned above, the pertinent information to be obtained from the ESI-MS data is extrapolated from the understanding that the peaks are interrelated. The steps for calculating the data are as follow:
- Determine which two neighboring peaks will be analyzed.
- Establish the first peak (the one farthest left) as the peak with the greatest m/z ratio. This is mathematically defined as our z+1 peak.
- Establish the adjacent peak to the right of our first peak as the peak with the lower m/z ratio. This is mathematically our z peak.
- Our z+1 peak will also be our m+1 peak as the difference between the two peaks is the charge of one proton. Consequently, our z peak will be defined as our m peak.
- Solve both equations for m to allow for substitution. Both sides of the equation should be in terms of zand can be solved.
- Determine the charge of the z peak and subsequently, the charge of the z+1 peak.
- Subtract one from the m/z ratio and multiply the m/z ratio of each peak by the previous charges determined to obtain the mass of the protein or macromolecule.
- Average the results to determine the average mass of the macromolecule or protein.
1. Determine which two neighboring peaks will be analyzed from the MS (Figure \(\PageIndex{6}\)) as the m/z = 5 and m/z = 10 peaks.
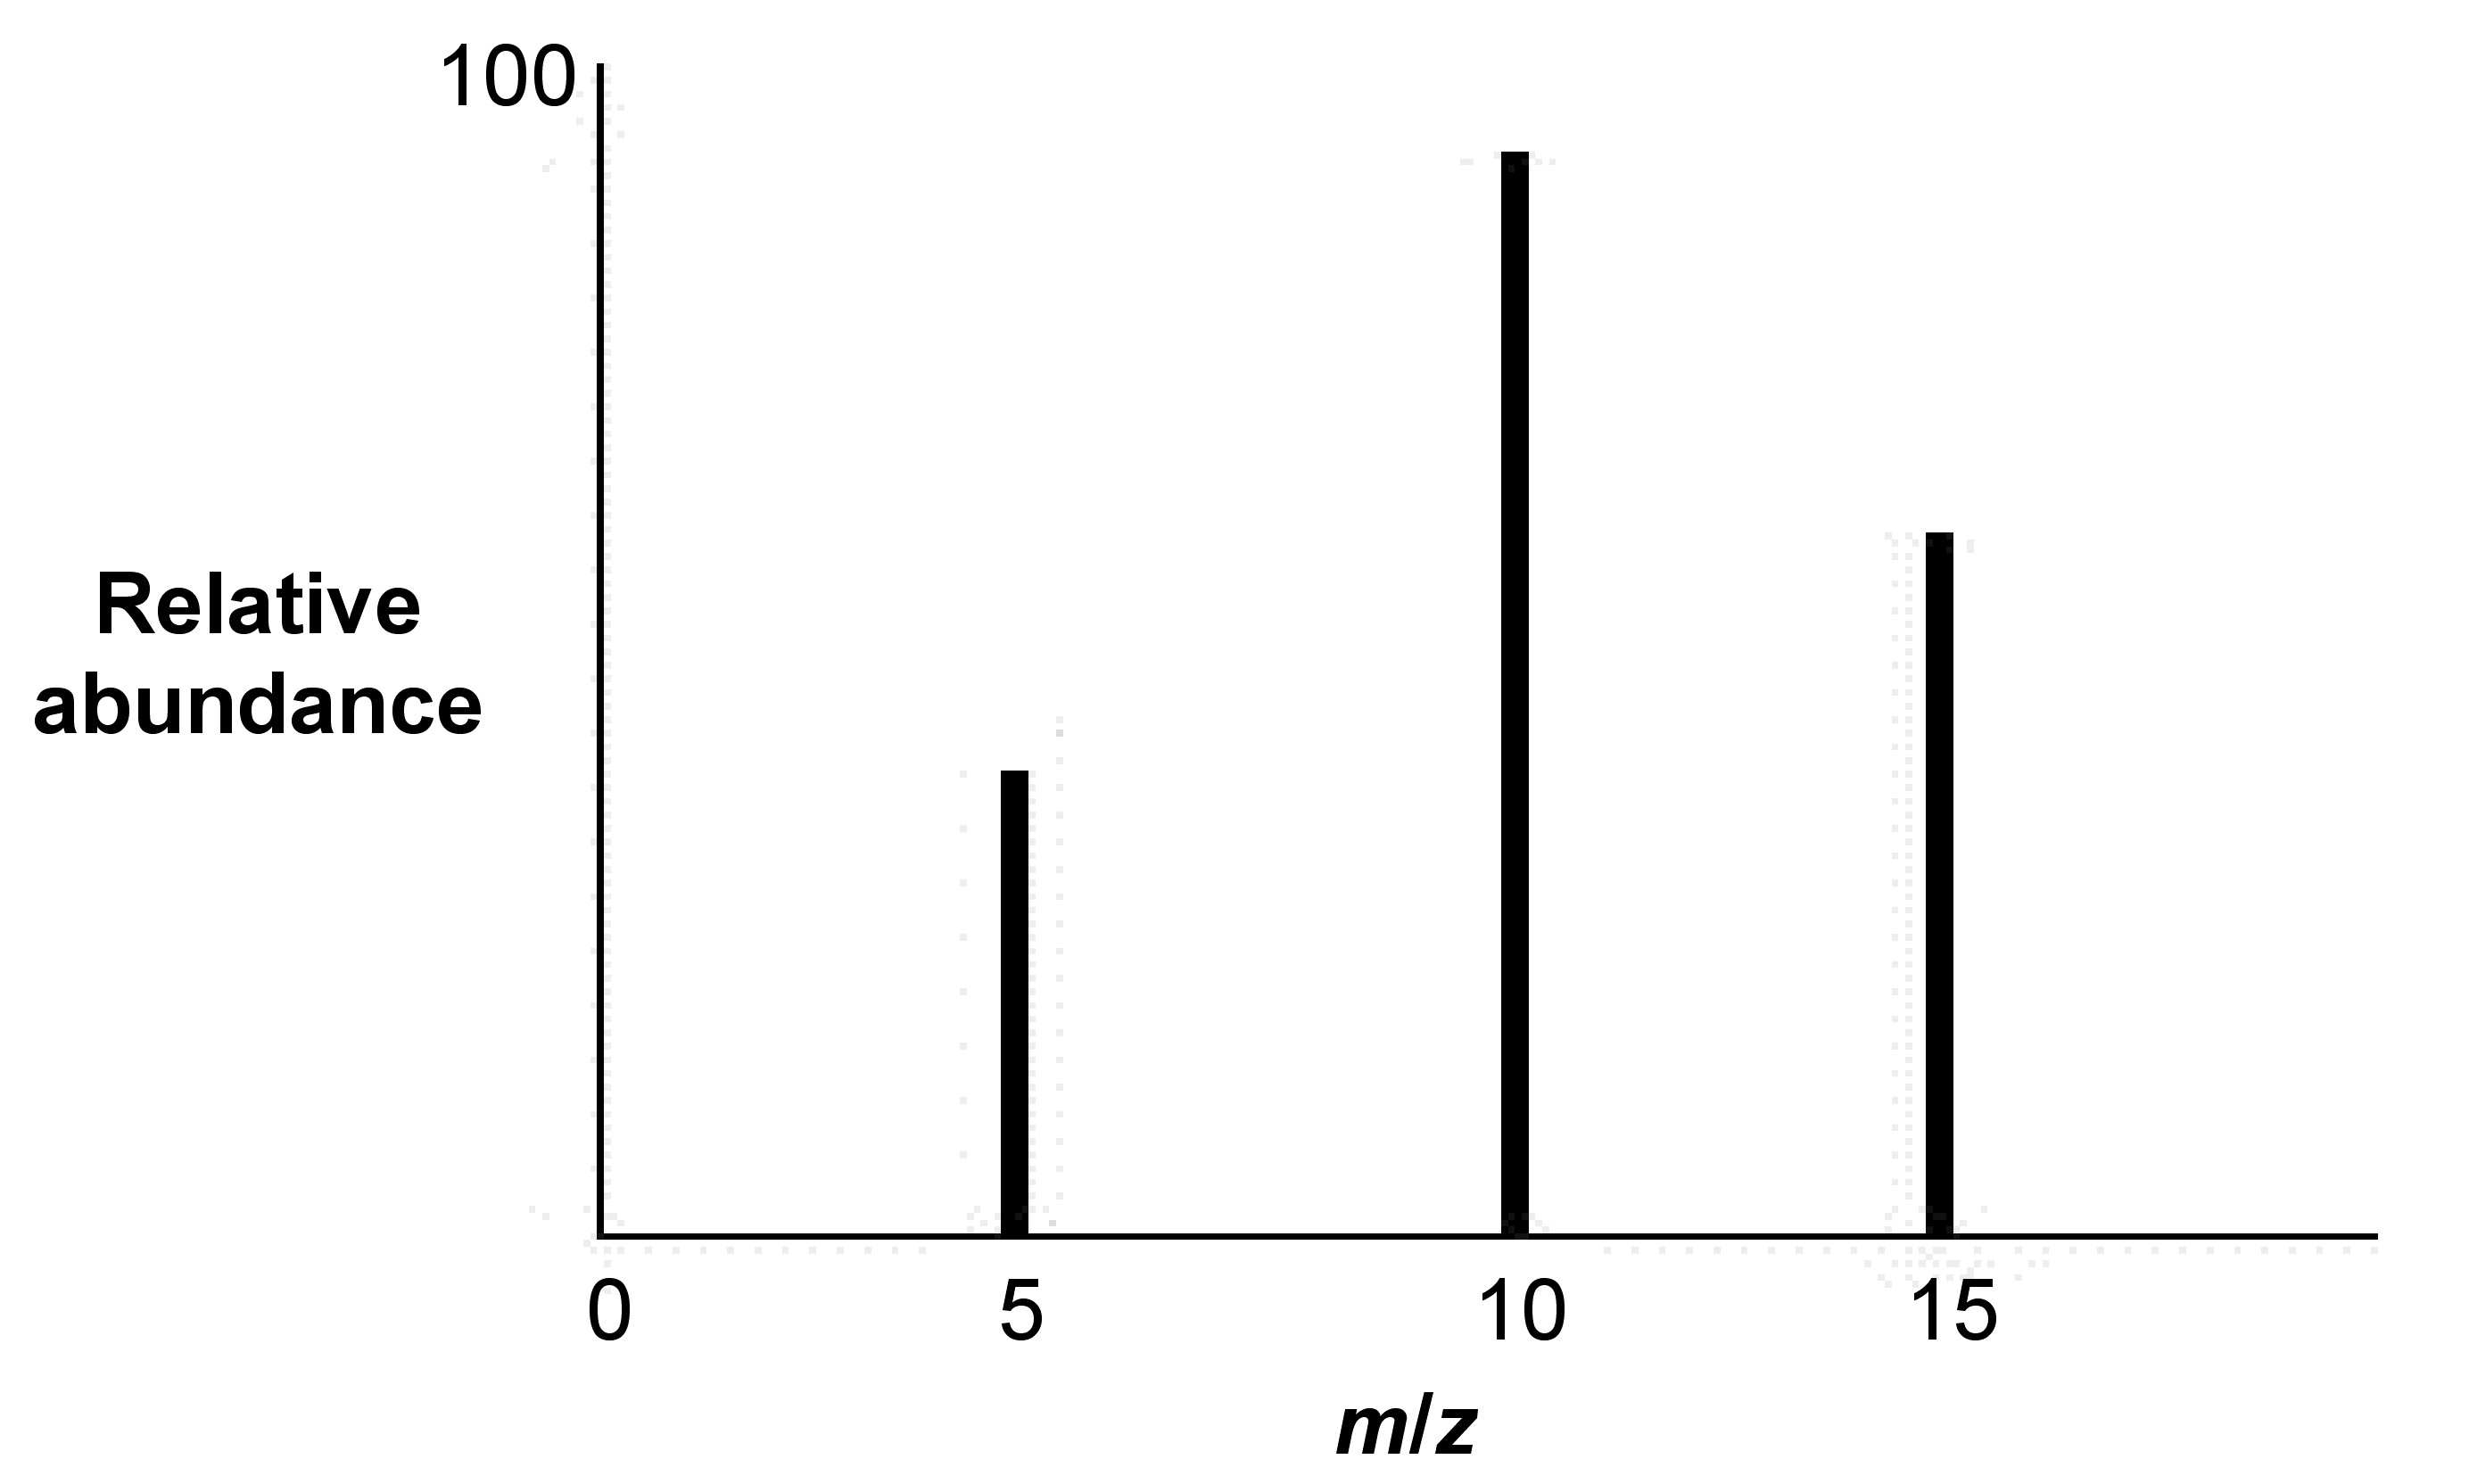
2. Establish the first peak (the one farthest left in Figure \(\PageIndex{1}\) as the z + 1 peak (i.e., z + 1 = 5).
3. Establish the adjacent peak to the right of the first peak as the z peak (i.e., z = 10).
4. Establish the peak ratios, \ref{1} and \ref{2}.
\[ \frac{m+1}{z+1} =\ 5 \label{1} \]
\[ \frac{m}{z} = 10 \label{2} \]
5. Solve the ratios for m: \ref{3} and \ref{4}.
\[ m\ =\ 5z\ +\ 4 \label{3} \]
\[ m\ =\ 10z \label{4} \]
6. Substitute one equation for m: \ref{5}.
\[ 5z\ +\ 4\ =\ 10z \label{5} \]
7. Solve for z: \ref{6}.
\[ z\ = 4/5 \label{6} \]
8. Find z+1: \ref{7}.
\[ z\ +\ 1\ =\ 9/5 \label{7} \]
Find average molecular mass by subtracting the mass by 1 and multiplying by the charge: \ref{8} and \ref{9}. Hence, the average mass = 7.2
\[ (10\ -\ 1)(4/5)\ =\ 7.2 \label{8} \]
\[ (5\ -\ 1)(9/5)\ =\ 7.2 \label{9} \]
Sample Preparation
Samples for ESI-MS must be in a liquid state. This requirement provides the necessary medium to easily charge the macromolecules or proteins into a fine aerosol state that can be easily fragmented to provide the desired outcomes. The benefit to this technique is that solid proteins that were once difficult to analyze, like metallothionein, can dissolved in an appropriate solvent that will allow analysis through ESI-MS. Because the sample is being delivered into the system as a liquid, the capillary can easily charge the solution to begin fragmentation of the protein into smaller fractions Maximum charge of the capillary is approximately 4 kV. However, this amount of charge is not necessary for every macromolecule. The appropriate charge is dependent on the size and characteristic of the solvent and each individual macromolecule. This has allowed for the removal of the molecular weight limit that was once held true for simple mass spectrometry analysis of proteins. Large proteins and macromolecules can now easily be detected and analyzed through ESI-MS due to the facility with which the molecules can fragment.
Related Techniques
A related technique that was developed at approximately the same time as ESI-MS is matrix assisted laser desorption/ionization mass spectrometry (MALDI-MS). This technique that was developed in the late 1980’s as wells, serves the same fundamental purpose; allowing analysis of large macromolecules via mass spectrometry through an alternative route of generating the necessary gas phase for analysis. In MALDI-MS, a matrix, usually comprised of crystallized 3,5-dimethoxy-4-hydroxycinnamic acid (Figure \(\PageIndex{7}\)), water, and an organix solvent, is used to mix the analyte, and a laser is used to charge the matrix.
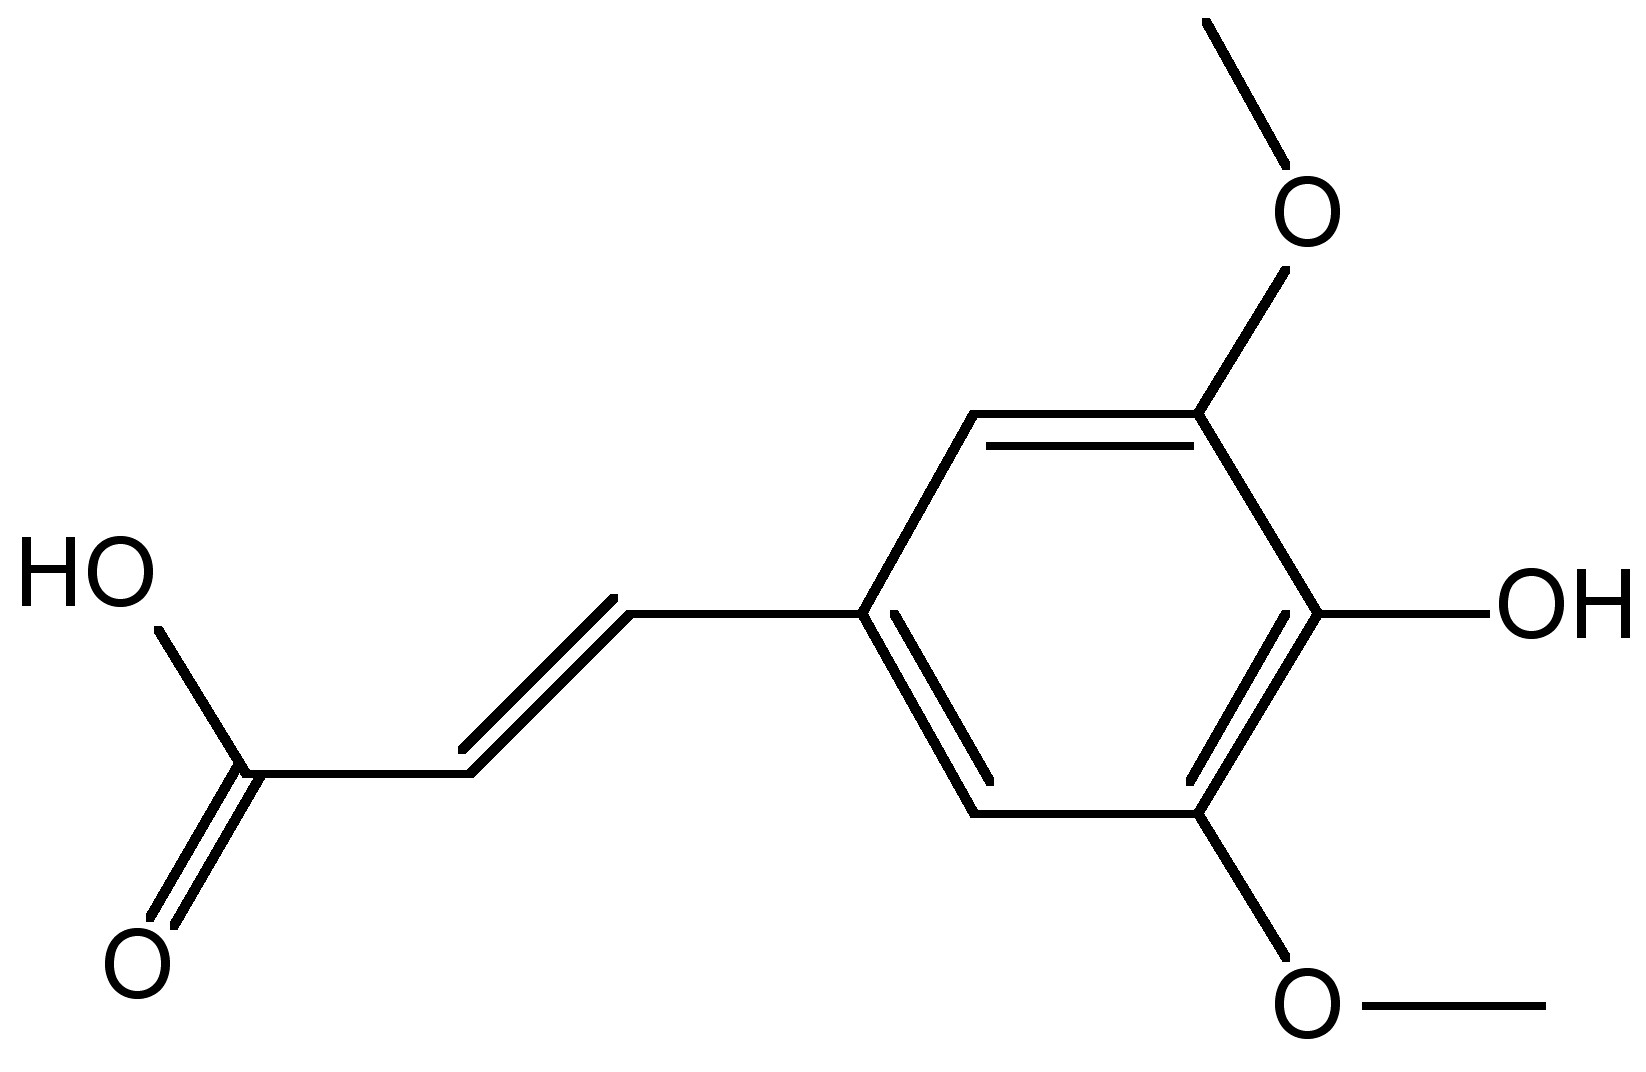
The matrix then co-crystallizes the analyte and pulses of the laser are then used to cause desorption of the matrix and some of the analyte crystals with it, leading to ionization of the crystals and the phase change into the gaseous state. The analytes are then read by the tandem mass spectrometer. Table \(\PageIndex{1}\) directly compares some attributes between ESI-MS and MALDI-MS. It should be noted that there are several variations of both ESI-MS and MALDI-MS, with the methods of data collection varying and the piggy-backing of several other methods (liquid chromatography, capillary electrophoresis, inductively coupled plasma mass spectrometry, etc.), yet all of them have the same fundamental principles as these basic two methods.
| Experimental Details | ESI-MS | MALDI-MS |
|---|---|---|
| Starting analyte state | Liquid | Liquid/solid |
| Method of ionization | Charged capillary needle | Matrix laser desorption |
| Final analyte state | Gas | Gas |
| Quantity of protein needed | 1 μL | 1 μL |
| Spectrum method | Mass spectrometry | Mass spectrometry |
Problems with ESI-MS
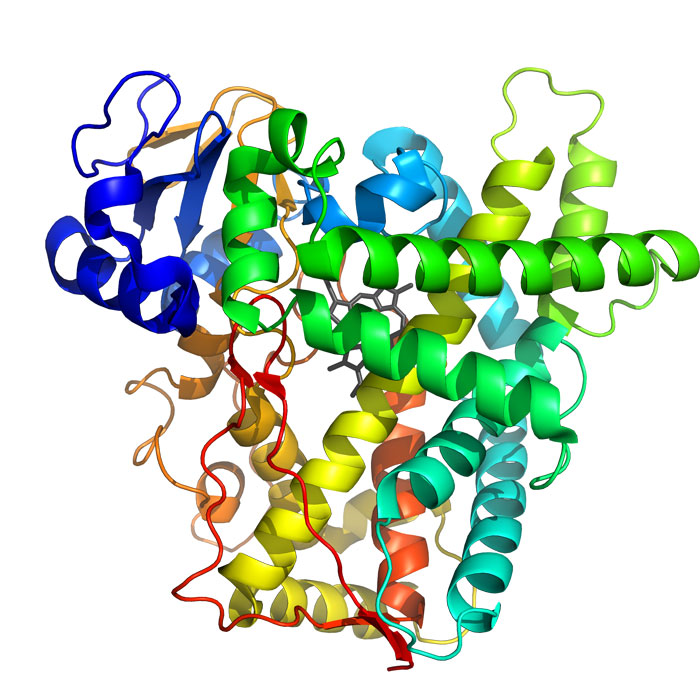
ESI-MS has proven to be useful in determination of tertiary structure and molecular weight calculations of large macromolecules. However, there are still several problems incorporated with the technique and macromolecule analysis. One problem is the isolation of the desired protein for analysis. If the protein is unable to be extracted from the cell, this is usually done through gel electrophoresis, there is a limiting factor in what proteins can be analyzed. Cytochrome c (Figure \(\PageIndex{7}\)) is an example of a protein that can be isolated and analyzed, but provides an interesting limitation on how the analytical technique does not function for a completely effective protein analysis. The problem with cytochrome c is that even if the protein is in its native confirmation, it can still show different charge distribution. This occurs due to the availability of basic sites for protonation that are consistently exposed to the solvent. Any slight change to the native conformation may cause basic sites, such as in cytochrome c to be blocked causing different m/z ratios to be seen. Another interesting limitation is seen when inorganic elements, such as in metallothioneins proteins that contain zinc, are analyzed using ESI-MS. Metallothioneins have several isoforms that show no consistent trend in ESI-MS data between the varied isoforms. The marked differences occur due to the metallation of each isoform being different, which causes the electrospraying and as a result protonation of the protein to be different. Thus, incorporation of metal atoms in proteins can have various effects on ESI-MS data due to the unexpected interactions between the metal center and the protein itself.
