6.3: Calorimetry
- Page ID
- 370718
\( \newcommand{\vecs}[1]{\overset { \scriptstyle \rightharpoonup} {\mathbf{#1}} } \)
\( \newcommand{\vecd}[1]{\overset{-\!-\!\rightharpoonup}{\vphantom{a}\smash {#1}}} \)
\( \newcommand{\dsum}{\displaystyle\sum\limits} \)
\( \newcommand{\dint}{\displaystyle\int\limits} \)
\( \newcommand{\dlim}{\displaystyle\lim\limits} \)
\( \newcommand{\id}{\mathrm{id}}\) \( \newcommand{\Span}{\mathrm{span}}\)
( \newcommand{\kernel}{\mathrm{null}\,}\) \( \newcommand{\range}{\mathrm{range}\,}\)
\( \newcommand{\RealPart}{\mathrm{Re}}\) \( \newcommand{\ImaginaryPart}{\mathrm{Im}}\)
\( \newcommand{\Argument}{\mathrm{Arg}}\) \( \newcommand{\norm}[1]{\| #1 \|}\)
\( \newcommand{\inner}[2]{\langle #1, #2 \rangle}\)
\( \newcommand{\Span}{\mathrm{span}}\)
\( \newcommand{\id}{\mathrm{id}}\)
\( \newcommand{\Span}{\mathrm{span}}\)
\( \newcommand{\kernel}{\mathrm{null}\,}\)
\( \newcommand{\range}{\mathrm{range}\,}\)
\( \newcommand{\RealPart}{\mathrm{Re}}\)
\( \newcommand{\ImaginaryPart}{\mathrm{Im}}\)
\( \newcommand{\Argument}{\mathrm{Arg}}\)
\( \newcommand{\norm}[1]{\| #1 \|}\)
\( \newcommand{\inner}[2]{\langle #1, #2 \rangle}\)
\( \newcommand{\Span}{\mathrm{span}}\) \( \newcommand{\AA}{\unicode[.8,0]{x212B}}\)
\( \newcommand{\vectorA}[1]{\vec{#1}} % arrow\)
\( \newcommand{\vectorAt}[1]{\vec{\text{#1}}} % arrow\)
\( \newcommand{\vectorB}[1]{\overset { \scriptstyle \rightharpoonup} {\mathbf{#1}} } \)
\( \newcommand{\vectorC}[1]{\textbf{#1}} \)
\( \newcommand{\vectorD}[1]{\overrightarrow{#1}} \)
\( \newcommand{\vectorDt}[1]{\overrightarrow{\text{#1}}} \)
\( \newcommand{\vectE}[1]{\overset{-\!-\!\rightharpoonup}{\vphantom{a}\smash{\mathbf {#1}}}} \)
\( \newcommand{\vecs}[1]{\overset { \scriptstyle \rightharpoonup} {\mathbf{#1}} } \)
\(\newcommand{\longvect}{\overrightarrow}\)
\( \newcommand{\vecd}[1]{\overset{-\!-\!\rightharpoonup}{\vphantom{a}\smash {#1}}} \)
\(\newcommand{\avec}{\mathbf a}\) \(\newcommand{\bvec}{\mathbf b}\) \(\newcommand{\cvec}{\mathbf c}\) \(\newcommand{\dvec}{\mathbf d}\) \(\newcommand{\dtil}{\widetilde{\mathbf d}}\) \(\newcommand{\evec}{\mathbf e}\) \(\newcommand{\fvec}{\mathbf f}\) \(\newcommand{\nvec}{\mathbf n}\) \(\newcommand{\pvec}{\mathbf p}\) \(\newcommand{\qvec}{\mathbf q}\) \(\newcommand{\svec}{\mathbf s}\) \(\newcommand{\tvec}{\mathbf t}\) \(\newcommand{\uvec}{\mathbf u}\) \(\newcommand{\vvec}{\mathbf v}\) \(\newcommand{\wvec}{\mathbf w}\) \(\newcommand{\xvec}{\mathbf x}\) \(\newcommand{\yvec}{\mathbf y}\) \(\newcommand{\zvec}{\mathbf z}\) \(\newcommand{\rvec}{\mathbf r}\) \(\newcommand{\mvec}{\mathbf m}\) \(\newcommand{\zerovec}{\mathbf 0}\) \(\newcommand{\onevec}{\mathbf 1}\) \(\newcommand{\real}{\mathbb R}\) \(\newcommand{\twovec}[2]{\left[\begin{array}{r}#1 \\ #2 \end{array}\right]}\) \(\newcommand{\ctwovec}[2]{\left[\begin{array}{c}#1 \\ #2 \end{array}\right]}\) \(\newcommand{\threevec}[3]{\left[\begin{array}{r}#1 \\ #2 \\ #3 \end{array}\right]}\) \(\newcommand{\cthreevec}[3]{\left[\begin{array}{c}#1 \\ #2 \\ #3 \end{array}\right]}\) \(\newcommand{\fourvec}[4]{\left[\begin{array}{r}#1 \\ #2 \\ #3 \\ #4 \end{array}\right]}\) \(\newcommand{\cfourvec}[4]{\left[\begin{array}{c}#1 \\ #2 \\ #3 \\ #4 \end{array}\right]}\) \(\newcommand{\fivevec}[5]{\left[\begin{array}{r}#1 \\ #2 \\ #3 \\ #4 \\ #5 \\ \end{array}\right]}\) \(\newcommand{\cfivevec}[5]{\left[\begin{array}{c}#1 \\ #2 \\ #3 \\ #4 \\ #5 \\ \end{array}\right]}\) \(\newcommand{\mattwo}[4]{\left[\begin{array}{rr}#1 \amp #2 \\ #3 \amp #4 \\ \end{array}\right]}\) \(\newcommand{\laspan}[1]{\text{Span}\{#1\}}\) \(\newcommand{\bcal}{\cal B}\) \(\newcommand{\ccal}{\cal C}\) \(\newcommand{\scal}{\cal S}\) \(\newcommand{\wcal}{\cal W}\) \(\newcommand{\ecal}{\cal E}\) \(\newcommand{\coords}[2]{\left\{#1\right\}_{#2}}\) \(\newcommand{\gray}[1]{\color{gray}{#1}}\) \(\newcommand{\lgray}[1]{\color{lightgray}{#1}}\) \(\newcommand{\rank}{\operatorname{rank}}\) \(\newcommand{\row}{\text{Row}}\) \(\newcommand{\col}{\text{Col}}\) \(\renewcommand{\row}{\text{Row}}\) \(\newcommand{\nul}{\text{Nul}}\) \(\newcommand{\var}{\text{Var}}\) \(\newcommand{\corr}{\text{corr}}\) \(\newcommand{\len}[1]{\left|#1\right|}\) \(\newcommand{\bbar}{\overline{\bvec}}\) \(\newcommand{\bhat}{\widehat{\bvec}}\) \(\newcommand{\bperp}{\bvec^\perp}\) \(\newcommand{\xhat}{\widehat{\xvec}}\) \(\newcommand{\vhat}{\widehat{\vvec}}\) \(\newcommand{\uhat}{\widehat{\uvec}}\) \(\newcommand{\what}{\widehat{\wvec}}\) \(\newcommand{\Sighat}{\widehat{\Sigma}}\) \(\newcommand{\lt}{<}\) \(\newcommand{\gt}{>}\) \(\newcommand{\amp}{&}\) \(\definecolor{fillinmathshade}{gray}{0.9}\)- Explain the technique of calorimetry
- Calculate and interpret heat and related properties using typical calorimetry data
One technique we can use to measure the amount of heat involved in a chemical or physical process is known as calorimetry. Calorimetry is used to measure amounts of heat transferred to or from a substance. To do so, the heat is exchanged with a calibrated object (calorimeter). The change in temperature of the measuring part of the calorimeter is converted into the amount of heat (since the previous calibration was used to establish its heat capacity). The measurement of heat transfer using this approach requires the definition of a system (the substance or substances undergoing the chemical or physical change) and its surroundings (the other components of the measurement apparatus that serve to either provide heat to the system or absorb heat from the system). Knowledge of the heat capacity of the surroundings, and careful measurements of the masses of the system and surroundings and their temperatures before and after the process allows one to calculate the heat transferred as described in this section.
A calorimeter is a device used to measure the amount of heat involved in a chemical or physical process. For example, when an exothermic reaction occurs in solution in a calorimeter, the heat produced by the reaction is absorbed by the solution, which increases its temperature. When an endothermic reaction occurs, the heat required is absorbed from the thermal energy of the solution, which decreases its temperature (Figure \(\PageIndex{1}\)). The temperature change, along with the specific heat and mass of the solution, can then be used to calculate the amount of heat involved in either case.
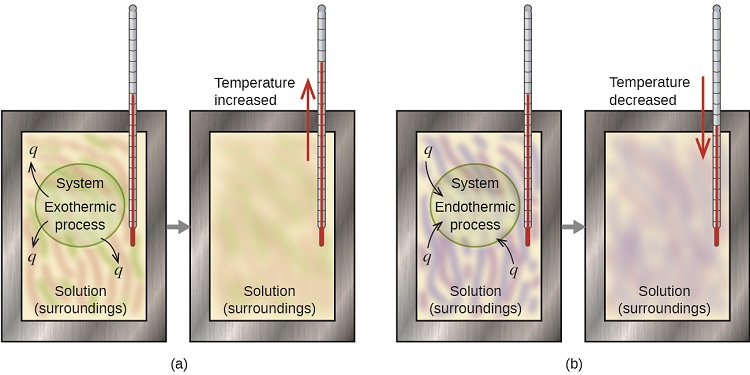
By convention, q is given a negative (-) sign when the system releases heat to the surroundings (exothermic); q is given a positive (+) sign when the system absorbs heat from the surroundings (endothermic).
Scientists use well-insulated calorimeters that all but prevent the transfer of heat between the calorimeter and its environment. This enables the accurate determination of the heat involved in chemical processes, the energy content of foods, and so on. General chemistry students often use simple calorimeters constructed from polystyrene cups (Figure \(\PageIndex{2}\)). These easy-to-use “coffee cup” calorimeters allow more heat exchange with their surroundings, and therefore produce less accurate energy values.
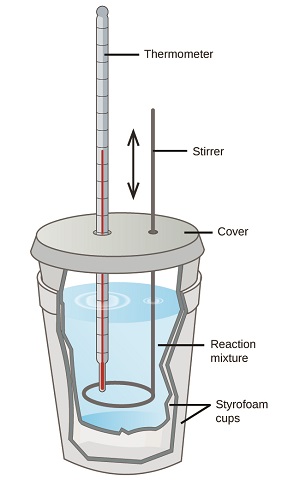
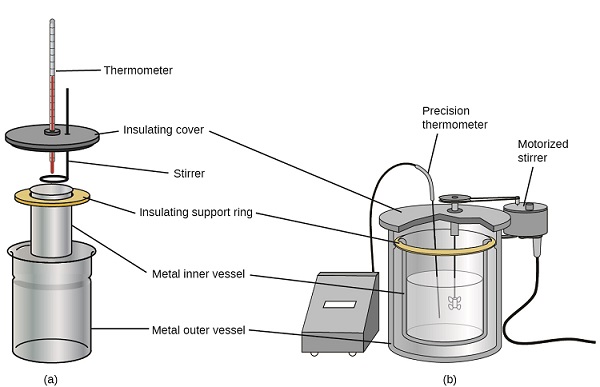
Commercial solution calorimeters are also available. Relatively inexpensive calorimeters often consist of two thin-walled cups that are nested in a way that minimizes thermal contact during use, along with an insulated cover, handheld stirrer, and simple thermometer. More expensive calorimeters used for industry and research typically have a well-insulated, fully enclosed reaction vessel, motorized stirring mechanism, and a more accurate temperature sensor (Figure \(\PageIndex{3}\)).
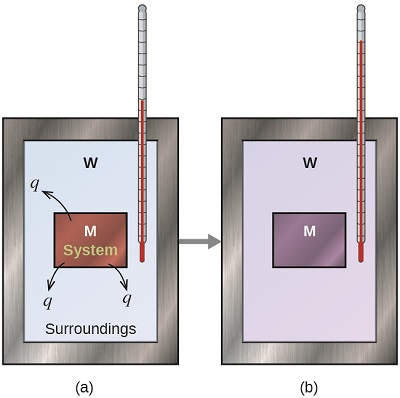
Before we practice calorimetry problems involving chemical reactions, consider a simple example that illustrates the core idea behind calorimetry. Suppose we initially have a high-temperature substance, such as a hot piece of metal (M), and a low-temperature substance, such as cool water (W). If we place the metal in the water, heat will flow from M to W. The temperature of M will decrease, and the temperature of W will increase, until the two substances have the same temperature—that is, when they reach thermal equilibrium (Figure \(\PageIndex{4}\)). If this occurs in a calorimeter, ideally all of this heat transfer occurs between the two substances, with no heat gained or lost by either the calorimeter or the calorimeter’s surroundings. Under these ideal circumstances, the net heat change is zero:
\[q_\mathrm{\,substance\: M} + q_\mathrm{\,substance\: W}=0 \label{5.3.1}\]
This relationship can be rearranged to show that the heat gained by substance M is equal to the heat lost by substance W:
\[q_\mathrm{\,substance\: M}=-q_\mathrm{\,substance\: W} \label{5.3.2}\]
The magnitude of the heat (change) is therefore the same for both substances, and the negative sign merely shows that \(q_{substance\, M}\) and \(q_{substance\, W}\) are opposite in direction of heat flow (gain or loss) but does not indicate the arithmetic sign of either q value (that is determined by whether the matter in question gains or loses heat, per definition). In the specific situation described, \(q_{substance\, M}\) is a negative value and \(q_{substance\, W}\) is positive, since heat is transferred from M to W.
A hot 360-g piece of rebar (a steel rod used for reinforcing concrete) is dropped into 425 mL of water at 24.0 °C. The final temperature of the water is measured as 42.7 °C. Calculate the initial temperature of the piece of rebar. Assume the specific heat of steel is approximately the same as that for iron (Table T4), and that all heat transfer occurs between the rebar and the water (there is no heat exchange with the surroundings).
Solution
The temperature of the water increases from 24.0 °C to 42.7 °C, so the water absorbs heat. That heat came from the piece of rebar, which initially was at a higher temperature. Assuming that all heat transfer was between the rebar and the water, with no heat “lost” to the surroundings, then heat given off by rebar = − heat taken in by water, or:
\[q_\ce{rebar}=−q_\ce{water} \nonumber \]
Since we know how heat is related to other measurable quantities, we have:
\[(c×m×ΔT)_\ce{rebar}=−(c×m×ΔT)_\ce{water} \nonumber \]
Letting f = final and i = initial, in expanded form, this becomes:
\[ c_\ce{rebar}×m_\ce{rebar}×(T_\mathrm{f,rebar}−T_\mathrm{i,rebar})=−c_\ce{water}×m_\ce{water}×(T_\mathrm{f,water}−T_\mathrm{i,water}) \nonumber\]
The density of water is 1.0 g/mL, so 425 mL of water = 425 g. Noting that the final temperature of both the rebar and water is 42.7 °C, substituting known values yields:
\[ \mathrm{(0.449\:J/g\: °C)(360g)(42.7°C−\mathit T_\mathrm{i,rebar})=-(4.184\:J/g\: °C)(425\:g)(42.7°C−24.0°C)} \nonumber\]
\[\mathrm{\mathit T_{i,rebar}=\dfrac{(4.184\:J/g\: °C)(425\:g)(42.7°C−24.0°C)}{(0.449\:J/g\: °C)(360\:g)}+42.7°C} \nonumber\]
Solving this gives Ti,rebar= 248 °C, so the initial temperature of the rebar was 248 °C.
A 248-g piece of copper is dropped into 390 mL of water at 22.6 °C. The final temperature of the water was measured as 39.9 °C. Calculate the initial temperature of the piece of copper. Assume that all heat transfer occurs between the copper and the water.
- Answer
-
The initial temperature of the copper was 335.6 °C.
A 248-g piece of copper initially at 314 °C is dropped into 390 mL of water initially at 22.6 °C. Assuming that all heat transfer occurs between the copper and the water, calculate the final temperature.
- Answer
-
The final temperature (reached by both copper and water) is 38.7 °C.
This method can also be used to determine other quantities, such as the specific heat of an unknown metal.
A 59.7 g piece of metal that had been submerged in boiling water was quickly transferred into 60.0 mL of water initially at 22.0 °C. The final temperature is 28.5 °C. Use these data to determine the specific heat of the metal. Use this result to identify the metal.
Solution
Assuming perfect heat transfer, heat given off by metal = −heat taken in by water, or:
\[q_\ce{metal}=−q_\ce{water} \nonumber\]
In expanded form, this is:
\[c_\ce{metal}×m_\ce{metal}×(T_\mathrm{f,metal}−T_\mathrm{i, metal})=−c_\ce{water}×m_\ce{water}×(T_\mathrm{f,water}−T_\mathrm{i,water}) \nonumber\]
Noting that since the metal was submerged in boiling water, its initial temperature was 100.0 °C; and that for water, 60.0 mL = 60.0 g; we have:
\[\mathrm{(\mathit c_{metal})(59.7\:g)(28.5°C−100.0°C)=−(4.18\:J/g\: °C)(60.0\:g)(28.5°C−22.0°C)} \nonumber\]
Solving this:
\[\mathrm{\mathit c_{metal}=\dfrac{−(4.184\:J/g\: °C)(60.0\:g)(6.5°C)}{(59.7\:g)(−71.5°C)}=0.38\:J/g\: °C} \nonumber\]
Comparing this with values in Table T4, our experimental specific heat is closest to the value for copper (0.39 J/g °C), so we identify the metal as copper.
A 92.9-g piece of a silver/gray metal is heated to 178.0 °C, and then quickly transferred into 75.0 mL of water initially at 24.0 °C. After 5 minutes, both the metal and the water have reached the same temperature: 29.7 °C. Determine the specific heat and the identity of the metal. (Note: You should find that the specific heat is close to that of two different metals. Explain how you can confidently determine the identity of the metal).
- Answer
-
\(c_{metal}= 0.13 \;J/g\; °C\)
This specific heat is close to that of either gold or lead. It would be difficult to determine which metal this was based solely on the numerical values. However, the observation that the metal is silver/gray in addition to the value for the specific heat indicates that the metal is lead.
Conservation of Energy: The Movement of Heat between Substances: https://youtu.be/pGEYy-pNHBg
When we use calorimetry to determine the heat involved in a chemical reaction, the same principles we have been discussing apply. The amount of heat absorbed by the calorimeter is often small enough that we can neglect it (though not for highly accurate measurements, as discussed later), and the calorimeter minimizes energy exchange with the surroundings. Because energy is neither created nor destroyed during a chemical reaction, there is no overall energy change during the reaction. The heat produced or consumed in the reaction (the “system”), qreaction, plus the heat absorbed or lost by the solution (the “surroundings”), \(q_{solution}\), must add up to zero:
\[q_\ce{reaction}+q_\ce{solution}=0\ \label{ 5.3.10}\]
This means that the amount of heat produced or consumed in the reaction equals the amount of heat absorbed or lost by the solution:
\[q_\ce{reaction}=−q_\ce{solution} \label{5.3.11}\]
This concept lies at the heart of all calorimetry problems and calculations.
When 50.0 mL of 0.10 M HCl(aq) and 50.0 mL of 1.00 M NaOH(aq), both at 22.0 °C, are added to a coffee cup calorimeter, the temperature of the mixture reaches a maximum of 28.9 °C. What is the approximate amount of heat produced by this reaction?
\[\ce{HCl}(aq)+\ce{NaOH}(aq)⟶\ce{NaCl}(aq)+\ce{H2O}(l) \nonumber\]
Solution
To visualize what is going on, imagine that you could combine the two solutions so quickly that no reaction took place while they mixed; then after mixing, the reaction took place. At the instant of mixing, you have 100.0 mL of a mixture of HCl and NaOH at 22.0 °C. The HCl and NaOH then react until the solution temperature reaches 28.9 °C.
The heat given off by the reaction is equal to that taken in by the solution. Therefore:
\[q_\ce{reaction}=−q_\ce{solution} \nonumber\]
(It is important to remember that this relationship only holds if the calorimeter does not absorb any heat from the reaction, and there is no heat exchange between the calorimeter and its surroundings.)
Next, we know that the heat absorbed by the solution depends on its specific heat, mass, and temperature change:
\[q_\ce{solution}=(c×m×ΔT)_\ce{solution} \nonumber\]
To proceed with this calculation, we need to make a few more reasonable assumptions or approximations. Since the solution is aqueous, we can proceed as if it were water in terms of its specific heat and mass values. The density of water is approximately 1.0 g/mL, so 100.0 mL has a mass of about 1.0 × 10² g (two significant figures). The specific heat of water is approximately 4.18 J/g °C, so we use that for the specific heat of the solution. Substituting these values gives:
\[\mathrm{\mathit q_{solution}=(4.184\:J/g\: °C)(1.0×10^2\:g)(28.9°C−22.0°C)=2.89×10^3\:J}\]
Finally, since we are trying to find the heat of the reaction, we have:
\[q_\ce{reaction}=−q_\ce{solution}=−2.89×10^3\:J \nonumber\]
The negative sign indicates that the reaction is exothermic. It produces 2.89 kJ of heat.
When 100 mL of 0.200 M NaCl(aq) and 100 mL of 0.200 M AgNO3(aq), both at 21.9 °C, are mixed in a coffee cup calorimeter, the temperature increases to 23.5 °C as solid AgCl forms. How much heat is produced by this precipitation reaction? What assumptions did you make to determine your value?
- Answer
-
\(1.34 \times 10^3\; J\); assume no heat is absorbed by the calorimeter, no heat is exchanged between the calorimeter and its surroundings, and that the specific heat and mass of the solution are the same as those for water
When working or playing outdoors on a cold day, you might use a hand warmer to warm your hands (Figure \(\PageIndex{5}\)). A common reusable hand warmer contains a supersaturated solution of NaC2H3O2 (sodium acetate) and a metal disc. Bending the disk creates nucleation sites around which the metastable NaC2H3O2 quickly crystallizes (a later chapter on solutions will investigate saturation and supersaturation in more detail).
The process \(\ce{NaC2H3O2}(aq)⟶\ce{NaC2H3O2}(s)\) is exothermic, and the heat produced by this process is absorbed by your hands, thereby warming them (at least for a while). If the hand warmer is reheated, the NaC2H3O2 redissolves and can be reused.

Another common hand warmer produces heat when it is ripped open, exposing iron and water in the hand warmer to oxygen in the air. One simplified version of this exothermic reaction is
\[\ce{2Fe(s) + 3/2 O2(g) ⟶ Fe2O3(s)}.\ n\nonumber\]
Salt in the hand warmer catalyzes the reaction, so it produces heat more rapidly; cellulose, vermiculite, and activated carbon help distribute the heat evenly. Other types of hand warmers use lighter fluid (a platinum catalyst helps lighter fluid oxidize exothermically), charcoal (charcoal oxidizes in a special case), or electrical units that produce heat by passing an electrical current from a battery through resistive wires.
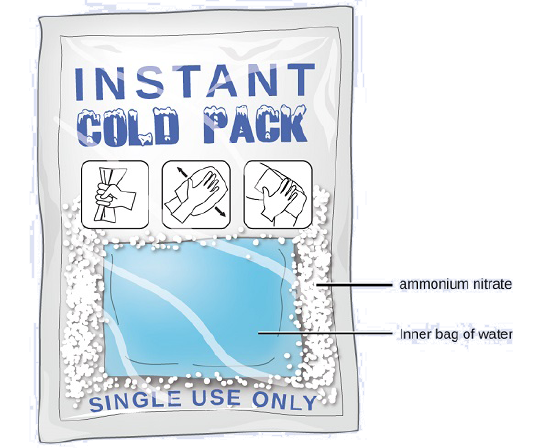
When solid ammonium nitrate dissolves in water, the solution becomes cold. This is the basis for an “instant ice pack” (Figure \(\PageIndex{5}\)). When 3.21 g of solid NH4NO3 dissolves in 50.0 g of water at 24.9 °C in a calorimeter, the temperature decreases to 20.3 °C.
Calculate the value of q for this reaction and explain the meaning of its arithmetic sign. State any assumptions that you made.
Solution
We assume that the calorimeter prevents heat transfer between the solution and its external environment (including the calorimeter itself), in which case:
\[q_\ce{rxn}=−q_\ce{soln}\]
with “rxn” and “soln” used as shorthand for “reaction” and “solution,” respectively.
Assuming also that the specific heat of the solution is the same as that for water, we have:
\[\begin{align*}
&q_\ce{rxn}=−q_\ce{soln}=−(c×m×ΔT)_\ce{soln}\\
&=\mathrm{−[(4.184J/g\: °C)×(53.2\:g)×(20.3°C−24.9°C)]}\\
&=\mathrm{−[(4.184J/g\: °C)×(53.2\:g)×(−4.6°C)]}\\
&+\mathrm{1.0×10^3\:J=+1.0\:kJ}
\end{align*}\]
The positive sign for q indicates that the dissolution is an endothermic process.
When a 3.00-g sample of KCl was added to 3.00 × 10² g of water in a coffee cup calorimeter, the temperature decreased by 1.05 °C. How much heat is involved in the dissolution of the KCl? What assumptions did you make?
- Answer
-
1.33 kJ; assume that the calorimeter prevents heat transfer between the solution and its external environment (including the calorimeter itself) and that the specific heat of the solution is the same as that for water.
If the amount of heat absorbed by a calorimeter is too large to neglect or if we require more accurate results, then we must take into account the heat absorbed both by the solution and by the calorimeter.
Conservation of Energy: Coffee Cup Calorimetry: https://youtu.be/FwQcc17PN0k
Query \(\PageIndex{1}\)
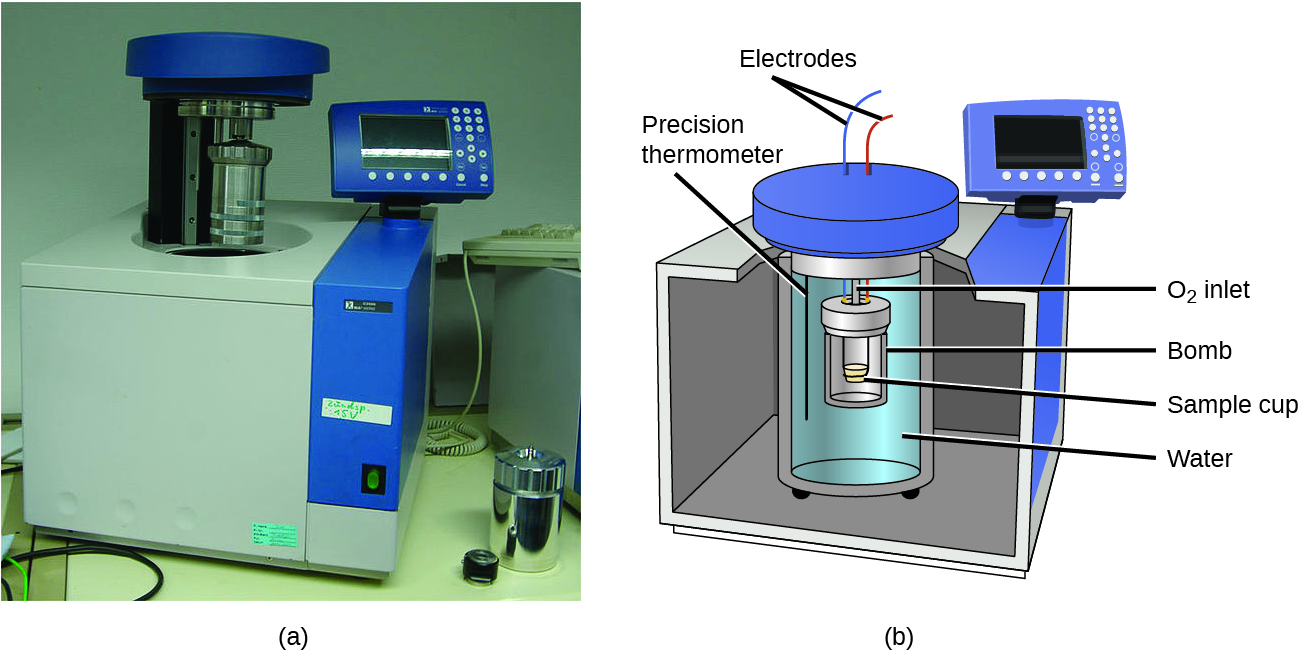
The calorimeters described are designed to operate at constant (atmospheric) pressure and are convenient to measure heat flow accompanying processes that occur in solution. A different type of calorimeter that operates at constant volume, colloquially known as a bomb calorimeter, is used to measure the energy produced by reactions that yield large amounts of heat and gaseous products, such as combustion reactions. (The term “bomb” comes from the observation that these reactions can be vigorous enough to resemble explosions that would damage other calorimeters.) This type of calorimeter consists of a robust steel container (the “bomb”) that contains the reactants and is itself submerged in water (Figure \(\PageIndex{6}\)). The sample is placed in the bomb, which is then filled with oxygen at high pressure. A small electrical spark is used to ignite the sample. The energy produced by the reaction is trapped in the steel bomb and the surrounding water. The temperature increase is measured and, along with the known heat capacity of the calorimeter, is used to calculate the energy produced by the reaction. Bomb calorimeters require calibration to determine the heat capacity of the calorimeter and ensure accurate results. The calibration is accomplished using a reaction with a known q, such as a measured quantity of benzoic acid ignited by a spark from a nickel fuse wire that is weighed before and after the reaction. The temperature change produced by the known reaction is used to determine the heat capacity of the calorimeter. The calibration is generally performed each time before the calorimeter is used to gather research data.
Video \(\PageIndex{1}\): Video of view how a bomb calorimeter is prepared for action.
When 3.12 g of glucose, C6H12O6, is burned in a bomb calorimeter, the temperature of the calorimeter increases from 23.8 °C to 35.6 °C. The calorimeter contains 775 g of water, and the bomb itself has a heat capacity of 893 J/°C. How much heat was produced by the combustion of the glucose sample?
Solution
The combustion produces heat that is primarily absorbed by the water and the bomb. (The amounts of heat absorbed by the reaction products and the unreacted excess oxygen are relatively small and dealing with them is beyond the scope of this text. We will neglect them in our calculations.)
The heat produced by the reaction is absorbed by the water and the bomb:
\[\begin{align*}
&q_\ce{rxn}=−(q_\ce{water}+q_\ce{bomb})\\
&=\mathrm{−[(4.184\:J/g\: °C)×(775\:g)×(35.6°C−23.8°C)+893\:J/°C×(35.6°C−23.8°C)]}\\
&=\mathrm{−(38,300\:J+10,500\:J)}\\
&=\mathrm{−48,800\: J=−48.8\: kJ}
\end{align*}\]
This reaction released 48.7 kJ of heat when 3.12 g of glucose was burned.
When 0.963 g of benzene, C6H6, is burned in a bomb calorimeter, the temperature of the calorimeter increases by 8.39 °C. The bomb has a heat capacity of 784 J/°C and is submerged in 925 mL of water. How much heat was produced by the combustion of the benzene sample?
Answer-
39.0 kJ
Since the first one was constructed in 1899, 35 calorimeters have been built to measure the heat produced by a living person.1 These whole-body calorimeters of various designs are large enough to hold an individual human being. More recently, whole-room calorimeters allow for relatively normal activities to be performed, and these calorimeters generate data that more closely reflect the real world. These calorimeters are used to measure the metabolism of individuals under different environmental conditions, different dietary regimes, and with different health conditions, such as diabetes. In humans, metabolism is typically measured in Calories per day. A nutritional calorie (Calorie) is the energy unit used to quantify the amount of energy derived from the metabolism of foods; one Calorie is equal to 1000 calories (1 kcal), the amount of energy needed to heat 1 kg of water by 1 °C.
Conservation of Energy: Bomb Calorimetry: https://youtu.be/SSNZGgwYBsQ
In your day-to-day life, you may be more familiar with energy being given in Calories, or nutritional calories, which are used to quantify the amount of energy in foods. One calorie (cal) = exactly 4.184 joules, and one Calorie (note the capitalization) = 1000 cal, or 1 kcal. (This is approximately the amount of energy needed to heat 1 kg of water by 1 °C.)
The macronutrients in food are proteins, carbohydrates, and fats or oils. Proteins provide about 4 Calories per gram, carbohydrates also provide about 4 Calories per gram, and fats and oils provide about 9 Calories/g. Nutritional labels on food packages show the caloric content of one serving of the food, as well as the breakdown into Calories from each of the three macronutrients (Figure \(\PageIndex{7}\)).
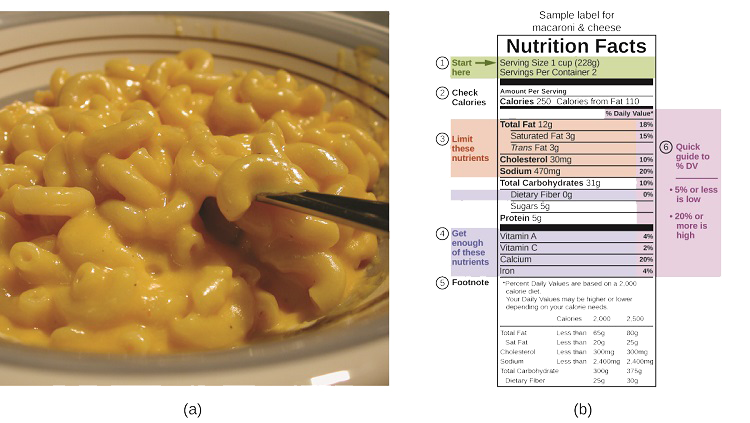
For the example shown in (b), the total energy per 228-g portion is calculated by:
\[\mathrm{(5\:g\: protein×4\:Calories/g)+(31\:g\: carb×4\:Calories/g)+(12\:g\: fat×9\:Calories/g)=252\:Calories} \label{5.3.X}\]
So, you can use food labels to count your Calories. But where do the values come from? And how accurate are they? The caloric content of foods can be determined by using bomb calorimetry; that is, by burning the food and measuring the energy it contains. A sample of food is weighed, mixed in a blender, freeze-dried, ground into powder, and formed into a pellet. The pellet is burned inside a bomb calorimeter, and the measured temperature change is converted into energy per gram of food.
Today, the caloric content on food labels is derived using a method called the Atwater system that uses the average caloric content of the different chemical constituents of food, protein, carbohydrate, and fats. The average amounts are those given in the equation and are derived from the various results given by bomb calorimetry of whole foods. The carbohydrate amount is discounted a certain amount for the fiber content, which is indigestible carbohydrate. To determine the energy content of a food, the quantities of carbohydrate, protein, and fat are each multiplied by the average Calories per gram for each and the products summed to obtain the total energy.
Query \(\PageIndex{1}\)
Summary
Calorimetry is used to measure the amount of thermal energy transferred in a chemical or physical process. This requires careful measurement of the temperature change that occurs during the process and the masses of the system and surroundings. These measured quantities are then used to compute the amount of heat produced or consumed in the process using known mathematical relations. Calorimeters are designed to minimize energy exchange between the system being studied and its surroundings. They range from simple coffee cup calorimeters used by introductory chemistry students to sophisticated bomb calorimeters used to determine the energy content of food.
Footnotes
- 1 Francis D. Reardon et al. “The Snellen human calorimeter revisited, re-engineered and upgraded: Design and performance characteristics.” Medical and Biological Engineering and Computing 8 (2006)721–28, http://link.springer.com/article/10....517-006-0086-5.
Glossary
- bomb calorimeter
- device designed to measure the energy change for processes occurring under conditions of constant volume; commonly used for reactions involving solid and gaseous reactants or products
- calorimeter
- device used to measure the amount of heat absorbed or released in a chemical or physical process
- calorimetry
- process of measuring the amount of heat involved in a chemical or physical process
- nutritional calorie (Calorie)
- unit used for quantifying energy provided by digestion of foods, defined as 1000 cal or 1 kcal
- surroundings
- all matter other than the system being studied
- system
- portion of matter undergoing a chemical or physical change being studied


