
14.5: Chemical Shifts in ¹H NMR Spectroscopy
- Page ID
- 482435

\( \newcommand{\vecs}[1]{\overset { \scriptstyle \rightharpoonup} {\mathbf{#1}} } \)
\( \newcommand{\vecd}[1]{\overset{-\!-\!\rightharpoonup}{\vphantom{a}\smash {#1}}} \)
\( \newcommand{\dsum}{\displaystyle\sum\limits} \)
\( \newcommand{\dint}{\displaystyle\int\limits} \)
\( \newcommand{\dlim}{\displaystyle\lim\limits} \)
\( \newcommand{\id}{\mathrm{id}}\) \( \newcommand{\Span}{\mathrm{span}}\)
( \newcommand{\kernel}{\mathrm{null}\,}\) \( \newcommand{\range}{\mathrm{range}\,}\)
\( \newcommand{\RealPart}{\mathrm{Re}}\) \( \newcommand{\ImaginaryPart}{\mathrm{Im}}\)
\( \newcommand{\Argument}{\mathrm{Arg}}\) \( \newcommand{\norm}[1]{\| #1 \|}\)
\( \newcommand{\inner}[2]{\langle #1, #2 \rangle}\)
\( \newcommand{\Span}{\mathrm{span}}\)
\( \newcommand{\id}{\mathrm{id}}\)
\( \newcommand{\Span}{\mathrm{span}}\)
\( \newcommand{\kernel}{\mathrm{null}\,}\)
\( \newcommand{\range}{\mathrm{range}\,}\)
\( \newcommand{\RealPart}{\mathrm{Re}}\)
\( \newcommand{\ImaginaryPart}{\mathrm{Im}}\)
\( \newcommand{\Argument}{\mathrm{Arg}}\)
\( \newcommand{\norm}[1]{\| #1 \|}\)
\( \newcommand{\inner}[2]{\langle #1, #2 \rangle}\)
\( \newcommand{\Span}{\mathrm{span}}\) \( \newcommand{\AA}{\unicode[.8,0]{x212B}}\)
\( \newcommand{\vectorA}[1]{\vec{#1}} % arrow\)
\( \newcommand{\vectorAt}[1]{\vec{\text{#1}}} % arrow\)
\( \newcommand{\vectorB}[1]{\overset { \scriptstyle \rightharpoonup} {\mathbf{#1}} } \)
\( \newcommand{\vectorC}[1]{\textbf{#1}} \)
\( \newcommand{\vectorD}[1]{\overrightarrow{#1}} \)
\( \newcommand{\vectorDt}[1]{\overrightarrow{\text{#1}}} \)
\( \newcommand{\vectE}[1]{\overset{-\!-\!\rightharpoonup}{\vphantom{a}\smash{\mathbf {#1}}}} \)
\( \newcommand{\vecs}[1]{\overset { \scriptstyle \rightharpoonup} {\mathbf{#1}} } \)
\(\newcommand{\longvect}{\overrightarrow}\)
\( \newcommand{\vecd}[1]{\overset{-\!-\!\rightharpoonup}{\vphantom{a}\smash {#1}}} \)
\(\newcommand{\avec}{\mathbf a}\) \(\newcommand{\bvec}{\mathbf b}\) \(\newcommand{\cvec}{\mathbf c}\) \(\newcommand{\dvec}{\mathbf d}\) \(\newcommand{\dtil}{\widetilde{\mathbf d}}\) \(\newcommand{\evec}{\mathbf e}\) \(\newcommand{\fvec}{\mathbf f}\) \(\newcommand{\nvec}{\mathbf n}\) \(\newcommand{\pvec}{\mathbf p}\) \(\newcommand{\qvec}{\mathbf q}\) \(\newcommand{\svec}{\mathbf s}\) \(\newcommand{\tvec}{\mathbf t}\) \(\newcommand{\uvec}{\mathbf u}\) \(\newcommand{\vvec}{\mathbf v}\) \(\newcommand{\wvec}{\mathbf w}\) \(\newcommand{\xvec}{\mathbf x}\) \(\newcommand{\yvec}{\mathbf y}\) \(\newcommand{\zvec}{\mathbf z}\) \(\newcommand{\rvec}{\mathbf r}\) \(\newcommand{\mvec}{\mathbf m}\) \(\newcommand{\zerovec}{\mathbf 0}\) \(\newcommand{\onevec}{\mathbf 1}\) \(\newcommand{\real}{\mathbb R}\) \(\newcommand{\twovec}[2]{\left[\begin{array}{r}#1 \\ #2 \end{array}\right]}\) \(\newcommand{\ctwovec}[2]{\left[\begin{array}{c}#1 \\ #2 \end{array}\right]}\) \(\newcommand{\threevec}[3]{\left[\begin{array}{r}#1 \\ #2 \\ #3 \end{array}\right]}\) \(\newcommand{\cthreevec}[3]{\left[\begin{array}{c}#1 \\ #2 \\ #3 \end{array}\right]}\) \(\newcommand{\fourvec}[4]{\left[\begin{array}{r}#1 \\ #2 \\ #3 \\ #4 \end{array}\right]}\) \(\newcommand{\cfourvec}[4]{\left[\begin{array}{c}#1 \\ #2 \\ #3 \\ #4 \end{array}\right]}\) \(\newcommand{\fivevec}[5]{\left[\begin{array}{r}#1 \\ #2 \\ #3 \\ #4 \\ #5 \\ \end{array}\right]}\) \(\newcommand{\cfivevec}[5]{\left[\begin{array}{c}#1 \\ #2 \\ #3 \\ #4 \\ #5 \\ \end{array}\right]}\) \(\newcommand{\mattwo}[4]{\left[\begin{array}{rr}#1 \amp #2 \\ #3 \amp #4 \\ \end{array}\right]}\) \(\newcommand{\laspan}[1]{\text{Span}\{#1\}}\) \(\newcommand{\bcal}{\cal B}\) \(\newcommand{\ccal}{\cal C}\) \(\newcommand{\scal}{\cal S}\) \(\newcommand{\wcal}{\cal W}\) \(\newcommand{\ecal}{\cal E}\) \(\newcommand{\coords}[2]{\left\{#1\right\}_{#2}}\) \(\newcommand{\gray}[1]{\color{gray}{#1}}\) \(\newcommand{\lgray}[1]{\color{lightgray}{#1}}\) \(\newcommand{\rank}{\operatorname{rank}}\) \(\newcommand{\row}{\text{Row}}\) \(\newcommand{\col}{\text{Col}}\) \(\renewcommand{\row}{\text{Row}}\) \(\newcommand{\nul}{\text{Nul}}\) \(\newcommand{\var}{\text{Var}}\) \(\newcommand{\corr}{\text{corr}}\) \(\newcommand{\len}[1]{\left|#1\right|}\) \(\newcommand{\bbar}{\overline{\bvec}}\) \(\newcommand{\bhat}{\widehat{\bvec}}\) \(\newcommand{\bperp}{\bvec^\perp}\) \(\newcommand{\xhat}{\widehat{\xvec}}\) \(\newcommand{\vhat}{\widehat{\vvec}}\) \(\newcommand{\uhat}{\widehat{\uvec}}\) \(\newcommand{\what}{\widehat{\wvec}}\) \(\newcommand{\Sighat}{\widehat{\Sigma}}\) \(\newcommand{\lt}{<}\) \(\newcommand{\gt}{>}\) \(\newcommand{\amp}{&}\) \(\definecolor{fillinmathshade}{gray}{0.9}\)As mentioned previously, differences in chemical shifts are caused by the small local magnetic field of electrons surrounding different nuclei. As seen in the 1H NMR spectrum of methyl acetate (Figure \(\PageIndex{1}\)), the x-axis units of NMR spectrum are in ppm (not in Hz as we would expect for frequency), and the two signals stand at different position along the x-axis. Let’s explain how that works and what information can be obtained.
Shielded vs Deshielded
The position of a signal along the x-axis of an NMR spectra is called chemical shift, or δ, of the signal. Chemical shift is determined by the structural electronic environment of the nuclei producing that signal. Protons in different chemical environments (non-equivalent) show signals at different chemical shifts. The direction of the chemical shift scale on the x-axis is opposite to what we are familiar with, that is, the smaller value is at the right-hand side, and the larger value is at the left-hand side.
- Smaller chemical shift (δ) values correspond with lower resonance frequency;
- Larger chemical shift (δ) values correspond with higher resonance frequency.
By convention, the right-hand side of an NMR spectrum with smaller chemical shift values is called upfield, and the left-hand direction is called downfield (Figure \(\PageIndex{1}\)).

For protons that are shielded, because of the Blocal caused by circulating electrons, the magnetic field experienced by the proton, Beff, is smaller than the applied external field, Bo, so the protons resonate at a lower frequency and have smaller chemical shift values.
- Shielded protons have a lower resonance frequency and smaller chemical shift (δ) values;
- Deshielded protons have a higher resonance frequency and larger chemical shift (δ) values.
Reference
In a 1H NMR spectrum, the absorption of the protons of TMS (tetramethylsilane) is defined as “zero” on the chemical shift (δ) scale, and the absorption of other protons is reported as a relative shift compared with that of TMS.
TMS was chosen as a reference compound and defined as “zero” for several reasons. Since silicon is less electronegative than carbon, the hydrogens of TMS are in a high electron-density environment, therefore are highly shielded with a very low resonance frequency and rarely interfere with the signals of other compounds. Also, there are twelve equivalent hydrogens in TMS that show a single signal, so the signal is rather strong even with a very small amount of TMS. TMS is also quite inert and easy to remove with a boiling point of 27ºC. A small amount of TMS was added to the sample as an internal standard for NMR measurement, and removed by evaporation afterwards. However, for contemporary NMR spectrometers (including bench-top NMR), it is no longer necessary to add TMS, as the computer can electronically calibrate the chemical shift based on the solvent's resonance frequencies.

The unit of chemical shift (δ) is ppm. The ‘ppm’ label stands for ‘parts per million’. The chemical shift relative to TMS, in ppm, is defined by the formula below.
The reason for using a relative value of chemical shift in ppm, rather than the actual resonance frequency in Hz is that every NMR instrument will have a different magnetic field strength, so the actual value of resonance frequencies expressed in Hz will be different on different instruments – remember that ΔE for the magnetic transition of a nucleus depends upon the strength of the externally applied magnetic field Bo. However, the chemical shift expressed in ppm will always be the same whether measured with an instrument operating at 400 MHz or 60 MHz. In the 1H NMR of methyl acetate, the two signals at 2.0 and 3.6 ppm represent the two sets of protons in methyl acetate that have resonance frequencies about 2.0 and 3.6 parts per million higher than the resonance frequency of the TMS protons. If, for example, the spectrum is measured by the 400 MHz NMR spectrometer, then the chemical shift in Hz will be 800 Hz and 1440 Hz, respectively.
Chemical Shift
Nuclei that are more strongly shielded by electrons require a higher applied field to bring them into resonance, so they absorb on the right side of the NMR chart. Nuclei that are less strongly shielded need a lower applied field for resonance, so they absorb on the left of the NMR chart.
Most 1H chemical shifts fall within the range 0 to 12 δ, which can be divided into the five regions shown in Figure \(\PageIndex{2}\). By remembering the positions of these regions, it’s often possible to tell at a glance what kinds of protons a molecule contains.
Table \(\PageIndex{1}\) shows the correlation of 1H chemical shift with electronic environment in more detail. In general, protons bonded to saturated, sp3-hybridized carbons absorb at higher fields, whereas protons bonded to sp2-hybridized carbons absorb at lower fields. Protons on carbons that are bonded to electronegative atoms, such as N, O, or halogen, also absorb at lower fields.
The importance of chemical shift information is that it gives critical clues about molecular structures. Several highlights here:
- Usually, the hydrogens in C-H bond, without any other functional groups nearby, are in the range of 1-2 ppm;
- For hydrogen in C-H bond beside a double bond, like C=C or C=O bond, the signal goes downfield to 2-2.5 ppm;
- With electronegative atoms connected on the carbon, like O-C-H, the hydrogens get deshielded and the chemical shift moves further downfield to 3-4 ppm;
- The hydrogens bonded directly to the double bond carbon have the chemical shift at around 4.5-6 pm;
- The aromatic hydrogens (H on benzene ring) show a chemical shift around 7 ppm;
- The chemical shift of hydrogens in OH (alcohol) or NH (amine) group vary in a rather large range, from 1-5 ppm;
- The hydrogen in aldehyde (-CHO) and carboxylic acid (COOH) groups has a chemical shift rather downfield at about 9-10 ppm and 10-12 ppm, respectively.
When referring to the chemical shift table (or chart) for a given compound, keep in mind that the exact value may vary slightly within the given range, and differences of up to 0.5 ppm may occur, depending on the specific structure and the solvent used.
Table \(\PageIndex{1}\): Approximate Proton Chemical Shifts of Common Functional Groups

With chemical shift information available, we can now assign the signals in the 1H NMR spectrum of methyl acetate. According to the chemical shift table, the protons in CH3 group beside C=O bond are supposed to be in the range of 2-3 ppm, and protons in CH3 group connected with O directly have δ value of about 3-4 ppm. So the 2.0 ppm signal is for the Ha group and 3.6 ppm signal is for Hb group.

Chemical Shift of Protons Near π Electrons — Anisotropy Effect
The chemical shift values of aromatic protons and vinylic protons (those directly bonded to an alkene carbon) resonate much further downfield (higher frequency, higher chemical shift) than can be accounted for simply by the deshielding effect of nearby electronegative atoms. These chemical shifts result from the anisotropy effect.
Let’s investigate the aromatic protons first. In benzene ring (and many other aromatic structures), the total six π electrons form delocalized π bond around the ring (more discussions in Organic II). When the molecule is exposed to the external magnetic field Bo, these π electrons begin to circulate in a ring current and generate their own induced magnetic field Binduced. Whether shielding or deshielding occurs depends on the location of the protons in the induced magnetic field, and this is called anisotropy (means “non-uniformity”) effect. This can be explicitly illustrated in the figure below by comparing points A and B.

If a proton is at point A, it feels the induced magnetic field pointing in the opposite direction of Bo, so the proton experiences shielding effect. For the proton at point B, however, it feels the induced magnetic field to the same direction as Bo, so the proton experiences deshielding effect.
The protons on the benzene ring are at the position equivalent of ‘point B’, which means that the induced current in this region of space is oriented in the same direction as B0, so it adds to B0 and result in a deshilelding effect and the benzene protons resonance at a higher frequency and have larger chemical shifts.

As a result, due to the anisotropy of the induced field generated by the circulating π electrons, the benzene protons are highly deshielded. Their chemical shift is far downfield, in the range of 6.5–8.5 ppm.
Anisotropy is also responsible for the downfield (high frequency) chemical shifts of vinylic protons (4–6.5 ppm) and aldehyde protons (9.5–11 ppm). The π electrons in these groups also circulate in such a way to generate an induced magnetic field that adds to external field Bo in the spots occupied by the protons. Carboxylic acid protons are even further downfield (9.5–12 ppm) due to the combined influence of the electronegative oxygen atom and the nearby π bond.

Methyl 2,2-dimethylpropanoate (CH3)2CCO2CH3 has two peaks in its 1H NMR spectrum. What are their approximate chemical shifts?
Strategy
Identify the types of hydrogens in the molecule, and note whether each is alkyl, vinylic, or next to an electronegative atom. Then predict where each absorbs, using Figure \(\PageIndex{2}\) if necessary.
Solution
The –OCH3 protons absorb around 3.5 to 4.0 δ because they are on carbon bonded to oxygen. The (CH3)3C– protons absorb near 1.0 δ because they are typical alkane-like protons.
Exercises
Each of the following compounds has a single 1H NMR peak. Approximately where would you expect each compound to absorb?
 b.
b.  c.
c. d.
d. e.
e.  f.
f.
- Answer
-
a. 1.43 δ b. 2.17 δ c. 7.37 δ d. 5.30 δ e. 9.70 δ f. 2.12 δ
Identify the different types of protons in the following molecule, and tell where you would expect each to absorb:

- Answer
-
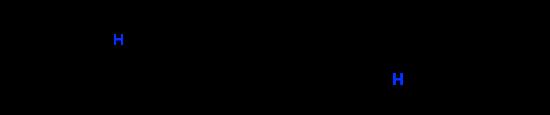
There are seven kinds of protons labeled. The types and expected range of absorption of each follow. a: ether, 3.5–4.5 δ; b: aryl, 6.5–8.0 δ; c: aryl, 6.5–8.0; d: vinylic, 4.5–6.5 δ; e: vinylic, 4.5–6.5 δ; f: alkyl (secondary), 1.2–1.6 δ; g: alkyl (primary), 0.7–1.3 δ.
![Structure of 1-[(E)-but-1-enyl]-4-methoxybenzene. Hydrogens labeled a (methoxy), b and c (ortho and meta to methoxy), d (benzylic), e (trans to d), f (methylene), and g (methyl) .](https://chem.libretexts.org/@api/deki/files/478477/imageedit_86_6203579493.png?revision=1&size=bestfit&width=281&height=171)