
5.4: Data Analysis
- Page ID
- 374942
\( \newcommand{\vecs}[1]{\overset { \scriptstyle \rightharpoonup} {\mathbf{#1}} } \)
\( \newcommand{\vecd}[1]{\overset{-\!-\!\rightharpoonup}{\vphantom{a}\smash {#1}}} \)
\( \newcommand{\id}{\mathrm{id}}\) \( \newcommand{\Span}{\mathrm{span}}\)
( \newcommand{\kernel}{\mathrm{null}\,}\) \( \newcommand{\range}{\mathrm{range}\,}\)
\( \newcommand{\RealPart}{\mathrm{Re}}\) \( \newcommand{\ImaginaryPart}{\mathrm{Im}}\)
\( \newcommand{\Argument}{\mathrm{Arg}}\) \( \newcommand{\norm}[1]{\| #1 \|}\)
\( \newcommand{\inner}[2]{\langle #1, #2 \rangle}\)
\( \newcommand{\Span}{\mathrm{span}}\)
\( \newcommand{\id}{\mathrm{id}}\)
\( \newcommand{\Span}{\mathrm{span}}\)
\( \newcommand{\kernel}{\mathrm{null}\,}\)
\( \newcommand{\range}{\mathrm{range}\,}\)
\( \newcommand{\RealPart}{\mathrm{Re}}\)
\( \newcommand{\ImaginaryPart}{\mathrm{Im}}\)
\( \newcommand{\Argument}{\mathrm{Arg}}\)
\( \newcommand{\norm}[1]{\| #1 \|}\)
\( \newcommand{\inner}[2]{\langle #1, #2 \rangle}\)
\( \newcommand{\Span}{\mathrm{span}}\) \( \newcommand{\AA}{\unicode[.8,0]{x212B}}\)
\( \newcommand{\vectorA}[1]{\vec{#1}} % arrow\)
\( \newcommand{\vectorAt}[1]{\vec{\text{#1}}} % arrow\)
\( \newcommand{\vectorB}[1]{\overset { \scriptstyle \rightharpoonup} {\mathbf{#1}} } \)
\( \newcommand{\vectorC}[1]{\textbf{#1}} \)
\( \newcommand{\vectorD}[1]{\overrightarrow{#1}} \)
\( \newcommand{\vectorDt}[1]{\overrightarrow{\text{#1}}} \)
\( \newcommand{\vectE}[1]{\overset{-\!-\!\rightharpoonup}{\vphantom{a}\smash{\mathbf {#1}}}} \)
\( \newcommand{\vecs}[1]{\overset { \scriptstyle \rightharpoonup} {\mathbf{#1}} } \)
\( \newcommand{\vecd}[1]{\overset{-\!-\!\rightharpoonup}{\vphantom{a}\smash {#1}}} \)
\(\newcommand{\avec}{\mathbf a}\) \(\newcommand{\bvec}{\mathbf b}\) \(\newcommand{\cvec}{\mathbf c}\) \(\newcommand{\dvec}{\mathbf d}\) \(\newcommand{\dtil}{\widetilde{\mathbf d}}\) \(\newcommand{\evec}{\mathbf e}\) \(\newcommand{\fvec}{\mathbf f}\) \(\newcommand{\nvec}{\mathbf n}\) \(\newcommand{\pvec}{\mathbf p}\) \(\newcommand{\qvec}{\mathbf q}\) \(\newcommand{\svec}{\mathbf s}\) \(\newcommand{\tvec}{\mathbf t}\) \(\newcommand{\uvec}{\mathbf u}\) \(\newcommand{\vvec}{\mathbf v}\) \(\newcommand{\wvec}{\mathbf w}\) \(\newcommand{\xvec}{\mathbf x}\) \(\newcommand{\yvec}{\mathbf y}\) \(\newcommand{\zvec}{\mathbf z}\) \(\newcommand{\rvec}{\mathbf r}\) \(\newcommand{\mvec}{\mathbf m}\) \(\newcommand{\zerovec}{\mathbf 0}\) \(\newcommand{\onevec}{\mathbf 1}\) \(\newcommand{\real}{\mathbb R}\) \(\newcommand{\twovec}[2]{\left[\begin{array}{r}#1 \\ #2 \end{array}\right]}\) \(\newcommand{\ctwovec}[2]{\left[\begin{array}{c}#1 \\ #2 \end{array}\right]}\) \(\newcommand{\threevec}[3]{\left[\begin{array}{r}#1 \\ #2 \\ #3 \end{array}\right]}\) \(\newcommand{\cthreevec}[3]{\left[\begin{array}{c}#1 \\ #2 \\ #3 \end{array}\right]}\) \(\newcommand{\fourvec}[4]{\left[\begin{array}{r}#1 \\ #2 \\ #3 \\ #4 \end{array}\right]}\) \(\newcommand{\cfourvec}[4]{\left[\begin{array}{c}#1 \\ #2 \\ #3 \\ #4 \end{array}\right]}\) \(\newcommand{\fivevec}[5]{\left[\begin{array}{r}#1 \\ #2 \\ #3 \\ #4 \\ #5 \\ \end{array}\right]}\) \(\newcommand{\cfivevec}[5]{\left[\begin{array}{c}#1 \\ #2 \\ #3 \\ #4 \\ #5 \\ \end{array}\right]}\) \(\newcommand{\mattwo}[4]{\left[\begin{array}{rr}#1 \amp #2 \\ #3 \amp #4 \\ \end{array}\right]}\) \(\newcommand{\laspan}[1]{\text{Span}\{#1\}}\) \(\newcommand{\bcal}{\cal B}\) \(\newcommand{\ccal}{\cal C}\) \(\newcommand{\scal}{\cal S}\) \(\newcommand{\wcal}{\cal W}\) \(\newcommand{\ecal}{\cal E}\) \(\newcommand{\coords}[2]{\left\{#1\right\}_{#2}}\) \(\newcommand{\gray}[1]{\color{gray}{#1}}\) \(\newcommand{\lgray}[1]{\color{lightgray}{#1}}\) \(\newcommand{\rank}{\operatorname{rank}}\) \(\newcommand{\row}{\text{Row}}\) \(\newcommand{\col}{\text{Col}}\) \(\renewcommand{\row}{\text{Row}}\) \(\newcommand{\nul}{\text{Nul}}\) \(\newcommand{\var}{\text{Var}}\) \(\newcommand{\corr}{\text{corr}}\) \(\newcommand{\len}[1]{\left|#1\right|}\) \(\newcommand{\bbar}{\overline{\bvec}}\) \(\newcommand{\bhat}{\widehat{\bvec}}\) \(\newcommand{\bperp}{\bvec^\perp}\) \(\newcommand{\xhat}{\widehat{\xvec}}\) \(\newcommand{\vhat}{\widehat{\vvec}}\) \(\newcommand{\uhat}{\widehat{\uvec}}\) \(\newcommand{\what}{\widehat{\wvec}}\) \(\newcommand{\Sighat}{\widehat{\Sigma}}\) \(\newcommand{\lt}{<}\) \(\newcommand{\gt}{>}\) \(\newcommand{\amp}{&}\) \(\definecolor{fillinmathshade}{gray}{0.9}\)Data Analysis
We need to develop three graphs and want to do this with the least number of solutions.
- Graph 1: Experiments 1-3: Order of rxn with respect to [Fe+3 ] at T3 = room, [I-]= constant.
- Graph 2: Experiments 3-5: Order of rxn with respect to [I-] at T3 = room, [Fe+3] = constant
- Graph 3: Experiment 3: Arrhenius constant, at different T3 , with [Fe+3] and [I-] held constant
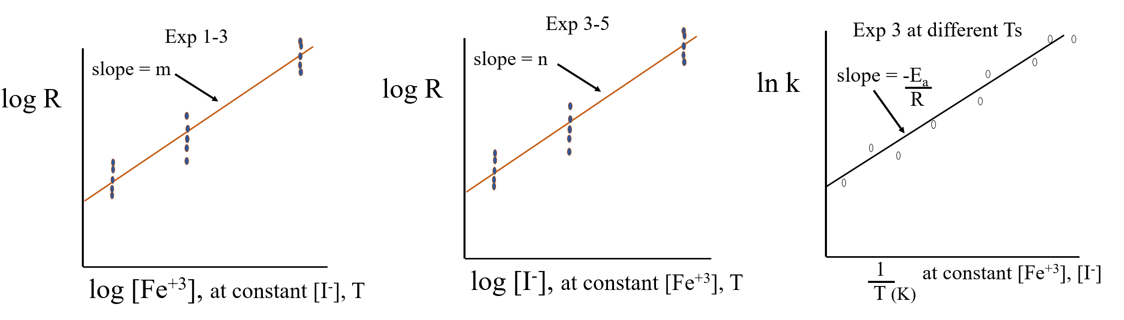 Figure \(\PageIndex{1}\): Three graphs we will be collecting data for. (CC-BY; Belford)
Cover Page
As always the first page of the Workbook is the Cover Page (figure \(\PageIndex{5}\)) and on this you will post your answers and Copies of the three graphs (from the other pages of the workbook, which can be accessed via the tabs at the bottom of the page).
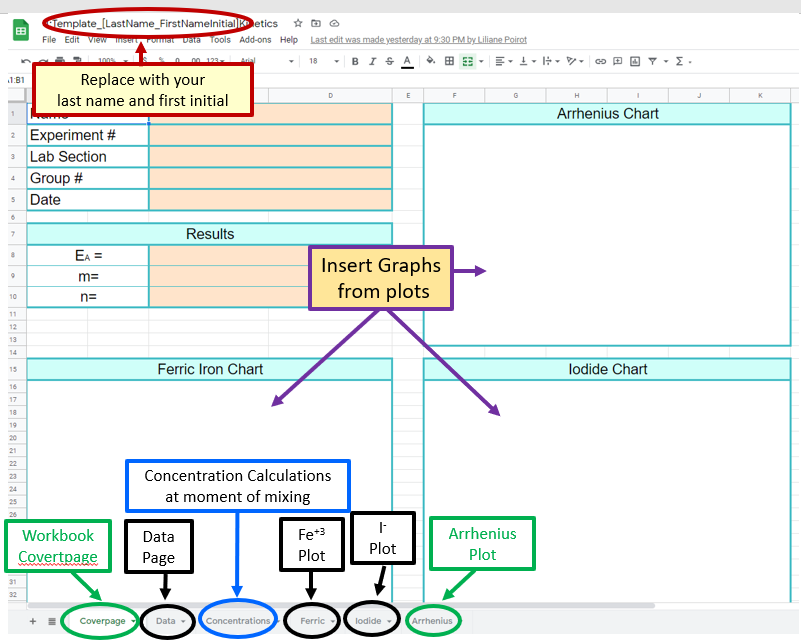 Figure \(\PageIndex{5}\): Screen Capture of the Front Page of the Google Sheet's Workbook and Paste Caption here. (Belford)
Be sure to replace the [Template_[Last_Firstname_Initial] with your lastname and initial, like Belford_B
Data Page
The Data tab takes you to the Data Sheet. The class is pooling data and right after class you must uploaded your data a special Google Sheet (see Downloads and Forms in Section 4.3). The data sheet allows you to obtain that data from the entire class and insert it into your own workbook. If your group does not upload your data within 4 hours of the end of the lab your instructor will do it for you and deduct 10 points of off everyone in your groups lab grade. The instructor will then check the data and once all data is uploaded the instructor will lock the sheet and email the entire class to let you know that all sections have uploaded their data and you can proceed to work up the results.
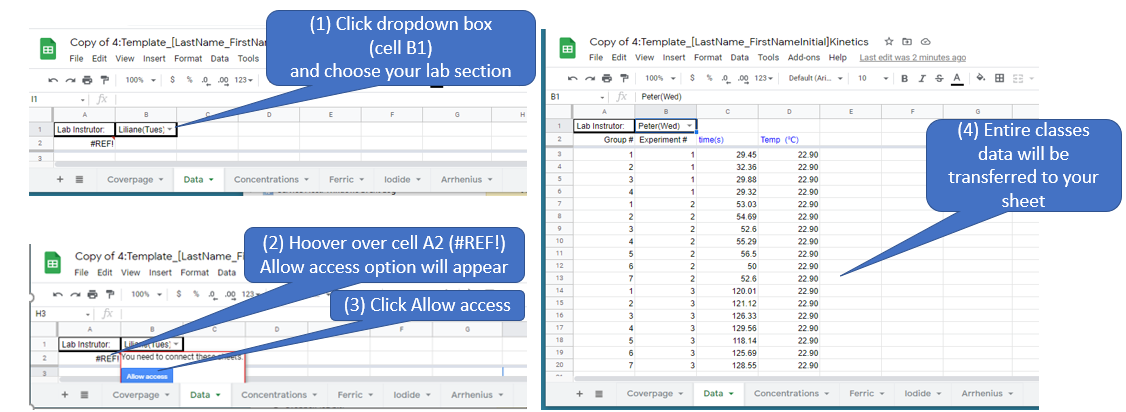
Note, do not start working up the data until the instructor notifies you that the entire class's data has been uploaded.
Concentration Page
You goal is to calculate the Rate at t=0 (moment of mixing) as the reaction starts the moment the two solutions are mixed. Table \(\PageIndex{1}\) gives all volumes and concentrations used. If both of the above flasks have 50 mL the total of the combined solution will be 100 mL. To calculate the concentration of any reagent at the moment of mixing you use the dilution equation, please review section 4.4.3
\[M_iV_i=M_fV_f\]
Where Mi is the initial Molarity (added to either reagent flask), Vi is the initial volume (added to either reagent flask), Mf is the final molarity (in the reaction flask) and Vf is the final volume of the mixture (100 ml). So
\[M_f=M_i \frac{V_i}{V_f}\]
note, the term \(\frac{V_i}{V_f}\) is often called the dilution factor, and is dimensionless if both volumes have the same units.
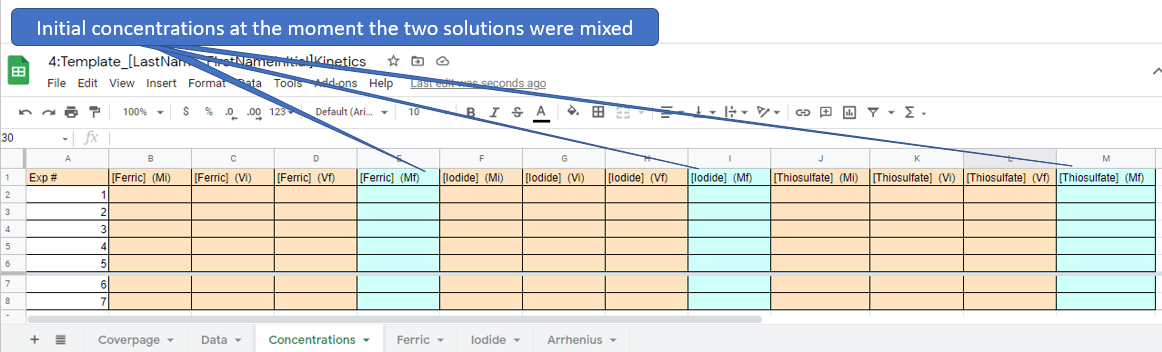 Figure \(\PageIndex{7}\): Copy and Paste Caption here. (Copyright; author via source)
There are actually only 5 different concentrations used as experiment 3,6 and 7 had identical concentrations. Before proceeding with the log/log and Arhenius plots you need to determine the concentrations of the ferric, iodide and thiosulfate ions. NOTE: it is advised that you learn how to use functions and you may want to review section 0.3 on Data Manipulation in Google Sheets. That is, you can place a function in the blue cells that pulls data from the brown cells and save yourself a lot of time.
Review Mathematics in Google Sheets Video
This video goes over making a formula
- Instructions
-
You can do simple calculations using formulas. Start all formulas by typing =
Addition +
Subtraction -
Multiplication *
Division /
Exponent ^
Parentheses ()
So for example if we can use the sheet to calculate the gravitational force between two objects
Video \(\PageIndex{1}\): 1:40 Video example of how to do basic calculations in sheets ()
Figure \(\PageIndex{1}\): Calculating the gravitational force of two objects. Formula used : =D2*((A2*B2)/C2^2) (Poirot)
- Lets look at how we could write the formula for the dilution equation. In cell with reference ID of E2 we could write =(Cell Ref1)*(Cell Ref2)/(Cell Ref3) where the Cell Ref# is the ID like A1 of a cell with data used in that experiment. Once we have loaded the equation with the proper data we hit enter and it calculates the value. We then use the small black square to scroll down and calculate those values for all the other rows of data.
Hint \(\PageIndex{1}\)
This hint shows a shortcut for inserting data
- Hint
-
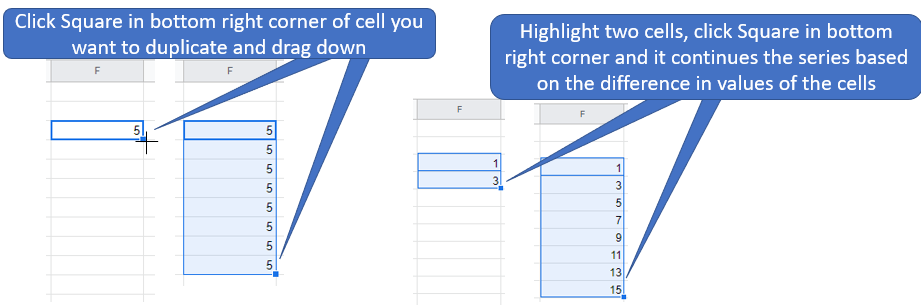
Figure \(\PageIndex{4}\): Highlighting a cell and dragging will copy its content while highlighting two cells and dragging creates a series of values based on the difference of the two cells. (Bob Belford; LibreTexts CC0)
Double clicking the blue square will repeat the formula for every cell that has data in the next column
Ferric Ion Page
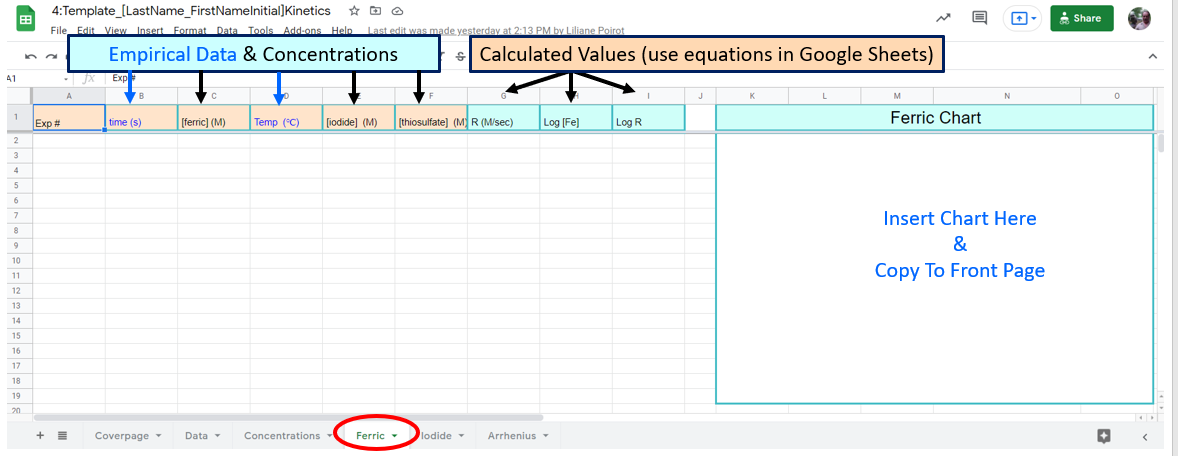 Figure \(\PageIndex{8}\): Note the blue text data is taken from the data tab and the black text values are taken from the concentration tab. You may want to "paste values" (when you paste do a "right click" choose "paste special" and "paste values only"
In this page of the workbook you will calculate "m", the order of reaction with respect to ferric iron by working up data from three experiments where [iodide] and T are constant.
\[R=k[Fe^{+3}]^m[I^-]^n\] reduces down to \[R=k'[Fe^{+3}]^m \\ \; \\ \text{and you can determine the value of the exponent in a log-log plot} \\ \; \\ logR=mlog[Fe^{+3}] + logk' \]
where \(k'=k[I^-]^n\)
Note how all the data for Iodide is constant, and you never used it in your equations.
Lets look at some of the functions you could write based on your data and the above spreadsheet. From section 4.2.3 we saw
\[R=\frac{\Delta [S_2O_3^{-2}]}{\Delta t}\]
and so you should use functions for calculating R, log[Fe] and log[R]. In fact you could skip the R column, but we want you to do it.
Hint \(\PageIndex{1}\)
This hint has a screenshot on pasting values.
- Answer
-
ctrl+shift+v does the same action as right-click paste values only
Paste formula only is also valuable for repeating the formula from one tab to another
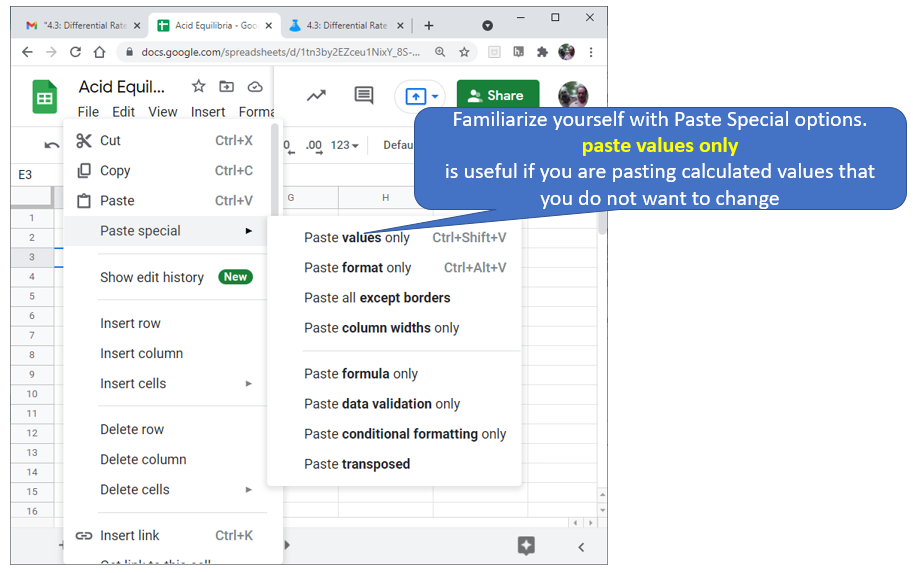 Figure \(\PageIndex{5}\): Familiarize yourself with options like paste value only. (Copyright; author via source)
Iodide Ion Page
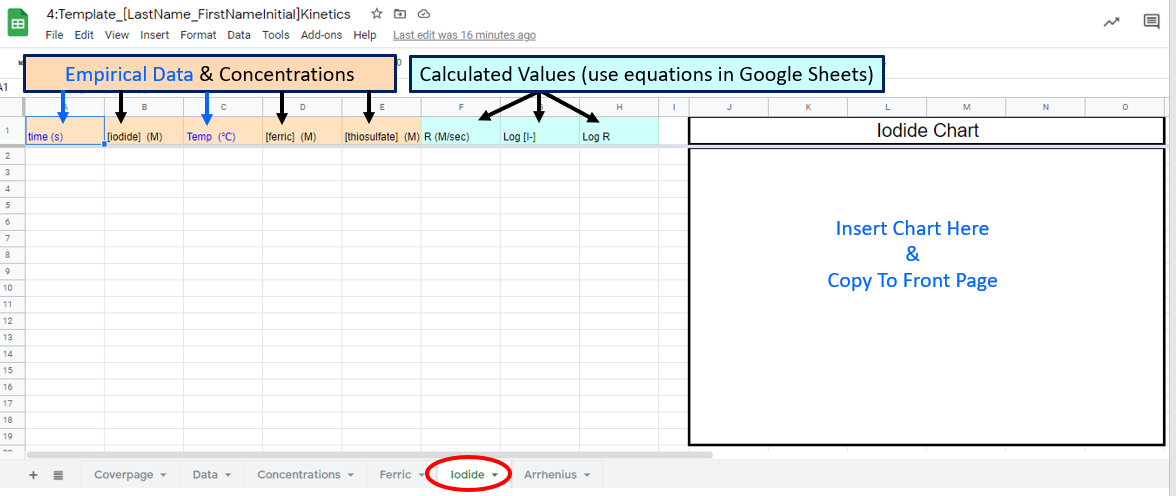 Figure \(\PageIndex{8}\): Google Sheet students need to fill out
In this page of the workbook you will calculate "n", the order of reaction with respect to iodide by working up data from experiments where you kept [ferric ion] and Temperature constant. You should also use calculations with your Google Sheets, and properly label all axis on the graph (chart).
\[R=k[Fe^{+3}]^m[I^-]^n\] reduces down to \[R=k''[I^{-}]^n] \\ \; \\ \text{and you can determine the value of the exponent in a log-log plot} \\ \; \\ logR=nlog[I^{-}] + logk'' \]
where \(k''=k[Fe^{+3}]^m\)
Arrhenius Graph
 Figure \(\PageIndex{9}\): Google Sheet students need to fill
This is the most complicated graph, you need to report the Arrhenius constant and plot all the appropriate data where the ferric iron and iodide constants were held constant, which was experiment three, You will also need to use the orders of reaction from the ferric iron and iodide pages.
Note, you could have calculated the lnk in one equation but we had you solve it in 4 If you look at the Rate Law, where R stands for the reaction rate
\[R=k[Fe^{+3}]^m[I^-]^n\] can be solved for k
\[k=\frac{R}{[Fe^{+3}]^m[I^-]^n} \] and the denominator of this equation is column J of the spreadsheet. It is important that you use the spreadsheet as structured as there is a grading template that will validate your work, and that uses this framework. But yes, you could have skiped columns I,J and K and gone straight to lnk (Column M), but our goal is to get you to look at the chemistry, and so we broke this into steps that had meaning, and would hopefully be easier to follow.
It should be noted that the k here is the k of the Arrhenius equation \[k=Ae^-\frac{E_A}{RT}\] (where R stands for the ideal gas constant) and we are plotting the natural log form of it
\[lnk = -\frac{E_A}{R}\left ( \frac{1}{T} \right ) + lnA\] and the slope of the line is equal to -\(\frac{E_A}{R}\).
Hint \(\PageIndex{1}\)
You can copy data from exp 1-3 from the ferric ion page and experiments 4 & 5 from the iodide page (use paste values)
- Answer
-
Figure \(\PageIndex{5}\): Familiarize yourself with options like paste value only. (Copyright; author via source)