
1: Periodic Trends Worksheet (advanced)
- Page ID
- 189265

\( \newcommand{\vecs}[1]{\overset { \scriptstyle \rightharpoonup} {\mathbf{#1}} } \)
\( \newcommand{\vecd}[1]{\overset{-\!-\!\rightharpoonup}{\vphantom{a}\smash {#1}}} \)
\( \newcommand{\dsum}{\displaystyle\sum\limits} \)
\( \newcommand{\dint}{\displaystyle\int\limits} \)
\( \newcommand{\dlim}{\displaystyle\lim\limits} \)
\( \newcommand{\id}{\mathrm{id}}\) \( \newcommand{\Span}{\mathrm{span}}\)
( \newcommand{\kernel}{\mathrm{null}\,}\) \( \newcommand{\range}{\mathrm{range}\,}\)
\( \newcommand{\RealPart}{\mathrm{Re}}\) \( \newcommand{\ImaginaryPart}{\mathrm{Im}}\)
\( \newcommand{\Argument}{\mathrm{Arg}}\) \( \newcommand{\norm}[1]{\| #1 \|}\)
\( \newcommand{\inner}[2]{\langle #1, #2 \rangle}\)
\( \newcommand{\Span}{\mathrm{span}}\)
\( \newcommand{\id}{\mathrm{id}}\)
\( \newcommand{\Span}{\mathrm{span}}\)
\( \newcommand{\kernel}{\mathrm{null}\,}\)
\( \newcommand{\range}{\mathrm{range}\,}\)
\( \newcommand{\RealPart}{\mathrm{Re}}\)
\( \newcommand{\ImaginaryPart}{\mathrm{Im}}\)
\( \newcommand{\Argument}{\mathrm{Arg}}\)
\( \newcommand{\norm}[1]{\| #1 \|}\)
\( \newcommand{\inner}[2]{\langle #1, #2 \rangle}\)
\( \newcommand{\Span}{\mathrm{span}}\) \( \newcommand{\AA}{\unicode[.8,0]{x212B}}\)
\( \newcommand{\vectorA}[1]{\vec{#1}} % arrow\)
\( \newcommand{\vectorAt}[1]{\vec{\text{#1}}} % arrow\)
\( \newcommand{\vectorB}[1]{\overset { \scriptstyle \rightharpoonup} {\mathbf{#1}} } \)
\( \newcommand{\vectorC}[1]{\textbf{#1}} \)
\( \newcommand{\vectorD}[1]{\overrightarrow{#1}} \)
\( \newcommand{\vectorDt}[1]{\overrightarrow{\text{#1}}} \)
\( \newcommand{\vectE}[1]{\overset{-\!-\!\rightharpoonup}{\vphantom{a}\smash{\mathbf {#1}}}} \)
\( \newcommand{\vecs}[1]{\overset { \scriptstyle \rightharpoonup} {\mathbf{#1}} } \)
\(\newcommand{\longvect}{\overrightarrow}\)
\( \newcommand{\vecd}[1]{\overset{-\!-\!\rightharpoonup}{\vphantom{a}\smash {#1}}} \)
\(\newcommand{\avec}{\mathbf a}\) \(\newcommand{\bvec}{\mathbf b}\) \(\newcommand{\cvec}{\mathbf c}\) \(\newcommand{\dvec}{\mathbf d}\) \(\newcommand{\dtil}{\widetilde{\mathbf d}}\) \(\newcommand{\evec}{\mathbf e}\) \(\newcommand{\fvec}{\mathbf f}\) \(\newcommand{\nvec}{\mathbf n}\) \(\newcommand{\pvec}{\mathbf p}\) \(\newcommand{\qvec}{\mathbf q}\) \(\newcommand{\svec}{\mathbf s}\) \(\newcommand{\tvec}{\mathbf t}\) \(\newcommand{\uvec}{\mathbf u}\) \(\newcommand{\vvec}{\mathbf v}\) \(\newcommand{\wvec}{\mathbf w}\) \(\newcommand{\xvec}{\mathbf x}\) \(\newcommand{\yvec}{\mathbf y}\) \(\newcommand{\zvec}{\mathbf z}\) \(\newcommand{\rvec}{\mathbf r}\) \(\newcommand{\mvec}{\mathbf m}\) \(\newcommand{\zerovec}{\mathbf 0}\) \(\newcommand{\onevec}{\mathbf 1}\) \(\newcommand{\real}{\mathbb R}\) \(\newcommand{\twovec}[2]{\left[\begin{array}{r}#1 \\ #2 \end{array}\right]}\) \(\newcommand{\ctwovec}[2]{\left[\begin{array}{c}#1 \\ #2 \end{array}\right]}\) \(\newcommand{\threevec}[3]{\left[\begin{array}{r}#1 \\ #2 \\ #3 \end{array}\right]}\) \(\newcommand{\cthreevec}[3]{\left[\begin{array}{c}#1 \\ #2 \\ #3 \end{array}\right]}\) \(\newcommand{\fourvec}[4]{\left[\begin{array}{r}#1 \\ #2 \\ #3 \\ #4 \end{array}\right]}\) \(\newcommand{\cfourvec}[4]{\left[\begin{array}{c}#1 \\ #2 \\ #3 \\ #4 \end{array}\right]}\) \(\newcommand{\fivevec}[5]{\left[\begin{array}{r}#1 \\ #2 \\ #3 \\ #4 \\ #5 \\ \end{array}\right]}\) \(\newcommand{\cfivevec}[5]{\left[\begin{array}{c}#1 \\ #2 \\ #3 \\ #4 \\ #5 \\ \end{array}\right]}\) \(\newcommand{\mattwo}[4]{\left[\begin{array}{rr}#1 \amp #2 \\ #3 \amp #4 \\ \end{array}\right]}\) \(\newcommand{\laspan}[1]{\text{Span}\{#1\}}\) \(\newcommand{\bcal}{\cal B}\) \(\newcommand{\ccal}{\cal C}\) \(\newcommand{\scal}{\cal S}\) \(\newcommand{\wcal}{\cal W}\) \(\newcommand{\ecal}{\cal E}\) \(\newcommand{\coords}[2]{\left\{#1\right\}_{#2}}\) \(\newcommand{\gray}[1]{\color{gray}{#1}}\) \(\newcommand{\lgray}[1]{\color{lightgray}{#1}}\) \(\newcommand{\rank}{\operatorname{rank}}\) \(\newcommand{\row}{\text{Row}}\) \(\newcommand{\col}{\text{Col}}\) \(\renewcommand{\row}{\text{Row}}\) \(\newcommand{\nul}{\text{Nul}}\) \(\newcommand{\var}{\text{Var}}\) \(\newcommand{\corr}{\text{corr}}\) \(\newcommand{\len}[1]{\left|#1\right|}\) \(\newcommand{\bbar}{\overline{\bvec}}\) \(\newcommand{\bhat}{\widehat{\bvec}}\) \(\newcommand{\bperp}{\bvec^\perp}\) \(\newcommand{\xhat}{\widehat{\xvec}}\) \(\newcommand{\vhat}{\widehat{\vvec}}\) \(\newcommand{\uhat}{\widehat{\uvec}}\) \(\newcommand{\what}{\widehat{\wvec}}\) \(\newcommand{\Sighat}{\widehat{\Sigma}}\) \(\newcommand{\lt}{<}\) \(\newcommand{\gt}{>}\) \(\newcommand{\amp}{&}\) \(\definecolor{fillinmathshade}{gray}{0.9}\)
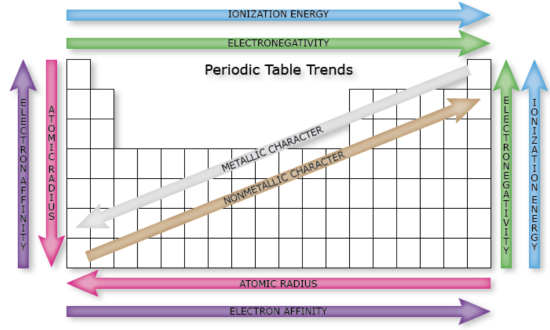
Figure \(\PageIndex{2}\). Normalized probability |
Periodic Trends
The periodic table is useful for predicting behavior of elements if you know periodic trends in properties. You should be familiar with periodic trends from your prior experience in chemistry. Now that you are an advanced chemistry student, you will need to explain why they happen and why there are some exceptions. The following summary of concepts may be helpful. Please practice using these terms.
Electron Shielding:
If an electron is far from the nucleus, then at any given moment, most of the other electrons will be between that electron and the nucleus. Hence the negative charges from the “in between” electrons will cancel a portion of the positive charge of the nucleus, thus partially “canceling out” the attractive interaction between the nucleus and the far-away electron. As a result, the electron farther away experiences an effective nuclear charge (\(Z_{eff}\)) that is less than the actual nuclear charge Z. This effect is called electron shielding. **Note: One electron (-1 charge) does not completely “cancel” each proton (+1) charge.
Effective Nuclear Charge (Zeff):
Where Z is the nuclear charge, the Zeff is the “effective nuclear charge”, or the amount of positive charge that is “felt” by a given electron. The closer an electron can approach the nucleus, the closer the value of Zeff is to Z.
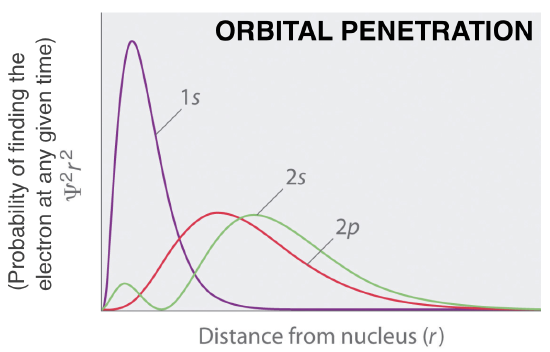
Orbital Penetration:
An electron in the s orbital of any given shell can get closer to the nucleus than a p orbital in any shell. This is called “orbital penetration”. An s orbital penetrates closer to the nucleus than a p orbital. The order of penetration (or ability to get close to the nucleus) is s>p>d>f.
Questions:
1. What is the order of penetration of the orbitals shown in Figure 2?
2. Which electrons would experience a higher Zeff, 2s or 2p? How does this effect their relative energies?
3. Predict which electrons would experience a higher Zeff, 3d or 4s? How does this effect their relative energies in an atom? Use the organization of the periodic table as a hint.
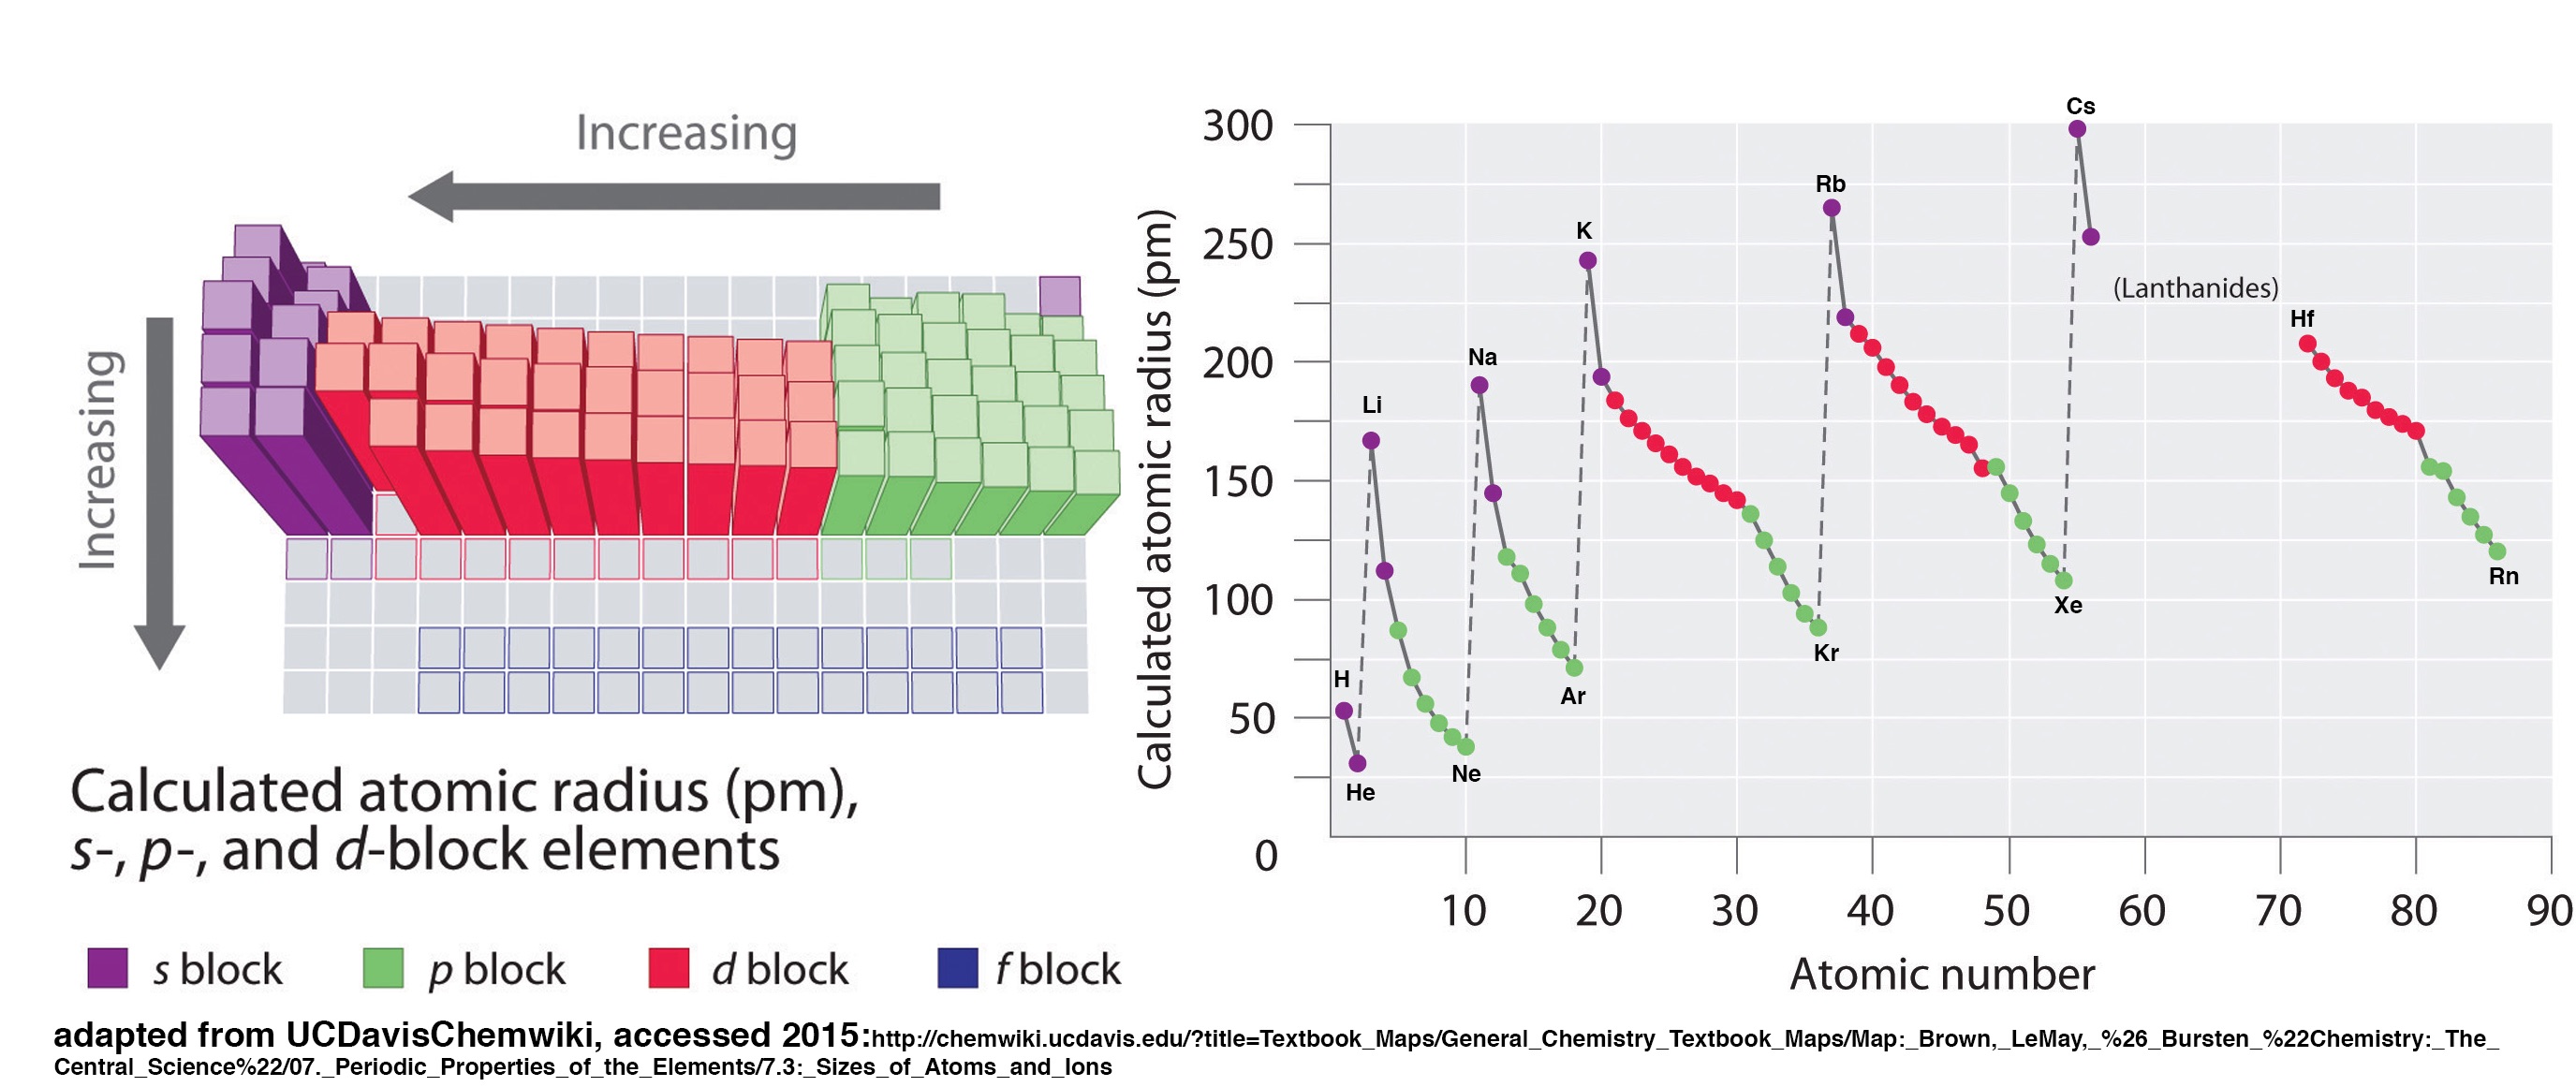
Trends in Atomic Radius
Let’s take a closer look at atomic radius. We will consider theoretical values determined from quantum mechanical wave functions. Study the figures below and try to apply the concepts stated above to answer the following questions.
Questions:1
4. Give your best and most concise explanation of the following trends:
a) There is a general trend in atomic radius across the table; it decreases as you go from left to right across a period.
b) There is a general trend in atomic radius down the table, it increases as you go down a group.
5. Examine the charts above. Are their variations in the trends that depend on subshell? (notice the color coding in the figures) Explain how subshell of the valence electrons affect trends in atomic size.
6. Considering Coulomb's law, would you expect atomic radius (the distance of the outermost electron from the nucleus) to be related to ionization energy? Explain.
Trends in Orbital Radius
ORBITAL SIZES
The wave-nature of an electron makes it impossible to define precisely the size of an orbital. However, the most probable radius, rmax, obtained from the radial probability distribution function is a useful indicator of orbital size. The table below contains values of rmax for the ns orbitals of the group 1 elements. The values are relative to \(a_0\), the Bohr radius.2
|
Questions:
7. What is the trend in the size of the valence orbitals as we go down the periodic table? Rationalize this observation.
8. What is the trend in the size of the core orbitals as we go down any of the columns in the table above. Rationalize this observation.
9. For any element in table Table \(\PageIndex{1}\), discuss how the relative sizes of the core orbitals compare to that of the valence orbital. Rationalize this observation.
10. Each of the elements above has their valence electron in an s orbital. Predict what would happen to the size of any of these elements if the atom’s valence electron would be removed to make a (+1) ion. Be as specific as possible: How big would the new ion’s radius be compared to the size of its original atomic orbitals?
11. Based on the trends you have seen so far, predict the relative radii of the following. Put them in order of increasing size. Is this the same order you would expect for the values of Zeff?
a) A , A+, A2+, A3+
b) A , A-, A2-, A3-
Ionization Energy
FIRST IONIZATION ENERGY
First ionization energy is the energy required to remove the outermost electron on an atom. Examine the figures below and answer the questions.

Questions:1
12. Give your best and most concise explanation of the following trends:
a) There is a general trend in ionization energy across the periodic table; it increases as you go across a period.
b) There is a general trend in ionization energy down the periodic table; it decreases as you go down a group.
13. Find magnesium and aluminum in the figures above.
a) Arrange these elements in order of increasing ionization energy. Is this what you would expect based on general trends?
b) How can we rationalize this unusual ordering?
14. Find phosphorus and sulfur in the figures above.
a) Arrange these elements in order of increasing ionization energy. Is this what you would expect based on general trends?
b) How can we rationalize this unusual ordering?
15. Compare trends in atomic size with the trends in ionization energy. Are they related? And is this consistent with your prediction from question #6.
SUCCESSIVE IONIZATION ENERGY
Ionization energy is the energy required to remove the outermost electron on an atom or ion. While the first ionization energy would be the removal of the outermost electron of an ion, successive ionizations remove additional electrons. For example, the second ionization energy is removal of the outermost electron from a (+1) ion.
Examine the figure below and answer the questions that follow.
Questions:1
16. Show the chemical reaction for each ionization process; use a general element with the symbol, A.
a) First ionization
b) Second ionization
c) Third ionization
17. Find boron and beryllium on the chart above.
a) Why is the jump in energy between the 2nd and 3rd ionization energies so much larger for beryllium compared to boron?
b) Based on your answer to (a), predict when you can expect to see small and large jumps in successive ionization energies of an element.
Sources
- These problems are adapted from Periodically Periodic, Created by Barbara Reisner, James Madison University (reisneba@jmu.edu) and posted on VIPEr (www.ionicviper.org) on January 25, 2015, Copyright Barbara Reisner 2015. This work is licensed under the Creative Commons Attribution Non-commercial Share Alike License. To view a copy of this license visit http://creativecommons.org/about/license/
- Parts of the "Trends in Orbital Radius" section were modeled after a problem set Created by Margret J. Geselbracht, Reed College (mgeselbr@reed.edu) and posted on VIPEr on February 13, 2008. Copyright Margret J. Geselbracht 2008. This work is licensed under the Creative Commons Attribution Non-commercial Share Alike License. To view a copy of this license visit http://creativecommons.org/about/license/
- Values in Table are from source (1), and originally from data in Essential Trends in Inorganic Chemistry by D. M. P. Mingos; Oxford University Press, Oxford, 1998.
- Data in Figure \(\PageIndex{5}\) are from Inorganic Chemistry by Shriver and Atkins, 5th edition, Oxford University Press, Oxford, 2010.