
16.1: Mass Spectrometry - The Basic Concepts
- Page ID
- 220512
\( \newcommand{\vecs}[1]{\overset { \scriptstyle \rightharpoonup} {\mathbf{#1}} } \)
\( \newcommand{\vecd}[1]{\overset{-\!-\!\rightharpoonup}{\vphantom{a}\smash {#1}}} \)
\( \newcommand{\id}{\mathrm{id}}\) \( \newcommand{\Span}{\mathrm{span}}\)
( \newcommand{\kernel}{\mathrm{null}\,}\) \( \newcommand{\range}{\mathrm{range}\,}\)
\( \newcommand{\RealPart}{\mathrm{Re}}\) \( \newcommand{\ImaginaryPart}{\mathrm{Im}}\)
\( \newcommand{\Argument}{\mathrm{Arg}}\) \( \newcommand{\norm}[1]{\| #1 \|}\)
\( \newcommand{\inner}[2]{\langle #1, #2 \rangle}\)
\( \newcommand{\Span}{\mathrm{span}}\)
\( \newcommand{\id}{\mathrm{id}}\)
\( \newcommand{\Span}{\mathrm{span}}\)
\( \newcommand{\kernel}{\mathrm{null}\,}\)
\( \newcommand{\range}{\mathrm{range}\,}\)
\( \newcommand{\RealPart}{\mathrm{Re}}\)
\( \newcommand{\ImaginaryPart}{\mathrm{Im}}\)
\( \newcommand{\Argument}{\mathrm{Arg}}\)
\( \newcommand{\norm}[1]{\| #1 \|}\)
\( \newcommand{\inner}[2]{\langle #1, #2 \rangle}\)
\( \newcommand{\Span}{\mathrm{span}}\) \( \newcommand{\AA}{\unicode[.8,0]{x212B}}\)
\( \newcommand{\vectorA}[1]{\vec{#1}} % arrow\)
\( \newcommand{\vectorAt}[1]{\vec{\text{#1}}} % arrow\)
\( \newcommand{\vectorB}[1]{\overset { \scriptstyle \rightharpoonup} {\mathbf{#1}} } \)
\( \newcommand{\vectorC}[1]{\textbf{#1}} \)
\( \newcommand{\vectorD}[1]{\overrightarrow{#1}} \)
\( \newcommand{\vectorDt}[1]{\overrightarrow{\text{#1}}} \)
\( \newcommand{\vectE}[1]{\overset{-\!-\!\rightharpoonup}{\vphantom{a}\smash{\mathbf {#1}}}} \)
\( \newcommand{\vecs}[1]{\overset { \scriptstyle \rightharpoonup} {\mathbf{#1}} } \)
\( \newcommand{\vecd}[1]{\overset{-\!-\!\rightharpoonup}{\vphantom{a}\smash {#1}}} \)
\(\newcommand{\avec}{\mathbf a}\) \(\newcommand{\bvec}{\mathbf b}\) \(\newcommand{\cvec}{\mathbf c}\) \(\newcommand{\dvec}{\mathbf d}\) \(\newcommand{\dtil}{\widetilde{\mathbf d}}\) \(\newcommand{\evec}{\mathbf e}\) \(\newcommand{\fvec}{\mathbf f}\) \(\newcommand{\nvec}{\mathbf n}\) \(\newcommand{\pvec}{\mathbf p}\) \(\newcommand{\qvec}{\mathbf q}\) \(\newcommand{\svec}{\mathbf s}\) \(\newcommand{\tvec}{\mathbf t}\) \(\newcommand{\uvec}{\mathbf u}\) \(\newcommand{\vvec}{\mathbf v}\) \(\newcommand{\wvec}{\mathbf w}\) \(\newcommand{\xvec}{\mathbf x}\) \(\newcommand{\yvec}{\mathbf y}\) \(\newcommand{\zvec}{\mathbf z}\) \(\newcommand{\rvec}{\mathbf r}\) \(\newcommand{\mvec}{\mathbf m}\) \(\newcommand{\zerovec}{\mathbf 0}\) \(\newcommand{\onevec}{\mathbf 1}\) \(\newcommand{\real}{\mathbb R}\) \(\newcommand{\twovec}[2]{\left[\begin{array}{r}#1 \\ #2 \end{array}\right]}\) \(\newcommand{\ctwovec}[2]{\left[\begin{array}{c}#1 \\ #2 \end{array}\right]}\) \(\newcommand{\threevec}[3]{\left[\begin{array}{r}#1 \\ #2 \\ #3 \end{array}\right]}\) \(\newcommand{\cthreevec}[3]{\left[\begin{array}{c}#1 \\ #2 \\ #3 \end{array}\right]}\) \(\newcommand{\fourvec}[4]{\left[\begin{array}{r}#1 \\ #2 \\ #3 \\ #4 \end{array}\right]}\) \(\newcommand{\cfourvec}[4]{\left[\begin{array}{c}#1 \\ #2 \\ #3 \\ #4 \end{array}\right]}\) \(\newcommand{\fivevec}[5]{\left[\begin{array}{r}#1 \\ #2 \\ #3 \\ #4 \\ #5 \\ \end{array}\right]}\) \(\newcommand{\cfivevec}[5]{\left[\begin{array}{c}#1 \\ #2 \\ #3 \\ #4 \\ #5 \\ \end{array}\right]}\) \(\newcommand{\mattwo}[4]{\left[\begin{array}{rr}#1 \amp #2 \\ #3 \amp #4 \\ \end{array}\right]}\) \(\newcommand{\laspan}[1]{\text{Span}\{#1\}}\) \(\newcommand{\bcal}{\cal B}\) \(\newcommand{\ccal}{\cal C}\) \(\newcommand{\scal}{\cal S}\) \(\newcommand{\wcal}{\cal W}\) \(\newcommand{\ecal}{\cal E}\) \(\newcommand{\coords}[2]{\left\{#1\right\}_{#2}}\) \(\newcommand{\gray}[1]{\color{gray}{#1}}\) \(\newcommand{\lgray}[1]{\color{lightgray}{#1}}\) \(\newcommand{\rank}{\operatorname{rank}}\) \(\newcommand{\row}{\text{Row}}\) \(\newcommand{\col}{\text{Col}}\) \(\renewcommand{\row}{\text{Row}}\) \(\newcommand{\nul}{\text{Nul}}\) \(\newcommand{\var}{\text{Var}}\) \(\newcommand{\corr}{\text{corr}}\) \(\newcommand{\len}[1]{\left|#1\right|}\) \(\newcommand{\bbar}{\overline{\bvec}}\) \(\newcommand{\bhat}{\widehat{\bvec}}\) \(\newcommand{\bperp}{\bvec^\perp}\) \(\newcommand{\xhat}{\widehat{\xvec}}\) \(\newcommand{\vhat}{\widehat{\vvec}}\) \(\newcommand{\uhat}{\widehat{\uvec}}\) \(\newcommand{\what}{\widehat{\wvec}}\) \(\newcommand{\Sighat}{\widehat{\Sigma}}\) \(\newcommand{\lt}{<}\) \(\newcommand{\gt}{>}\) \(\newcommand{\amp}{&}\) \(\definecolor{fillinmathshade}{gray}{0.9}\)This page describes how a mass spectrum is produced using a mass spectrometer.
An outline of what happens in a mass spectrometer
Atoms can be deflected by magnetic fields - provided the atom is first turned into an ion. Electrically charged particles are affected by a magnetic field although electrically neutral ones aren't.
The sequence is :
- Stage 1: Ionization: Gas phase particles of the sample are ionized through a collision with a high energy electron yielding a positive ion.
- Stage 2: Acceleration: The ions are accelerated so that they all have the same kinetic energy and directed into a mass analyzer.
- Stage 3: Separation according to the mass-to charge-ratio (m/ze) of the ions: The ions are sorted according to their (m/ze).
- Stage 4: Detection: The beam of ions passing through the mass analyzer is detected as a current.
A diagram of a magnetic sector mass spectrometer
Understanding what's going on
The need for a vacuum
It's important that the ions produced in the ionization chamber can travel from the ionizer, where they are created, through the mass filter, to the detector. The mean free path is the average distance a particle travels before it suffers a collision with another particle. The mean free path is a concept often presented when discussing the Kinetic Molecular Theory in a first year chemistry course. The mean free path for a nitrogen molecule at room temperature and 1 atm pressure is 95 nm (9.5 x 10⁻⁹ m). In a room temperature vacuum chamber the mean free path of a nitrogen molecule is 7.2 x 10⁻⁵ m when the pressure is 1 mm Hg (1 Torr or 0.0013 atm), 7.2 x 10⁻² m when the pressure is 0.001 mm Hg (1 mTorr or 1.3 x 10⁻⁶ atm), and 72 cm when the pressure is 1 x 10⁻⁶ mm Hg (1 x 10⁻⁶ Torr or 1.3 x 10⁻⁹ atm). Given the typical dimensions of a mass analyzer and the larger cross section for collisions for an ion relative to a neutral molecule, mass spectrometers need to be operated under condition of high vaucuum, 10-9 atm or lower.
Ionization
The vaporized sample passes into the ionization chamber. In the ionization chamber electrons are produced from a heated filament (coil) by thermionic emission. The electrons are accelerated from the electrically heated metal coil towards the electron trap plate.
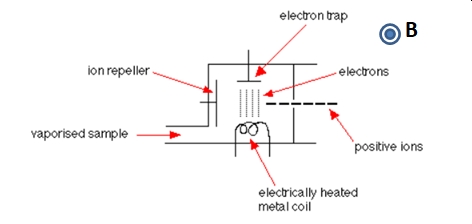
The particles in the sample (atoms or molecules) bombarded by the stream of energetic electrons leading to the loss of one or more electrons from the sample particles to make positive ions. Most of the positive ions formed will carry a charge of +1 because it is much more difficult to remove further electrons from an already positive ion. These positive ions are directed out of the ionization chamber towards the mass analyzer by the ion repeller.
Acceleration
The positive ions are repelled out of the ionizer by the repeller and are accelerated by away additional electron optic plates. The ions are "all" accelerated to the same energy which is based on the difference between the birth potential for the ion and the final acceleration plate. The quotation marks around the worrd all are to indicate there is always some spread in the energy of the accelrated ions.
The Mass Analyzer - sorting the ions according to their mass-to-charge ratio (m/ze)
The mass analyzer is a instrument component that sorts the ions coming from the ionizer according to their (m/ze). In the instrument pictured in this section the mass analyzer is a magnetic sector mass analyter.Different ions are deflected by the magnetic field by different amounts. The magnetic sector mass analyzer is based on deflection of an ion in a magnetic field which follows the right hand rule
Ions with (m/ze) will pass though the analyzer provided the equation below is satisfied. In this equation, B is the magnetic field strength, V is the kinetic energy of the entering ions, and r is the radius of curvature for the path through the magnetic field
\(\frac{m}{ze}=\frac{B^{2} r^{2} }{2 V}\)
Ions with (m/ze) for which the magnetic field is too strong will bend such that they will collide with the inner wall and be neutralized (stream A). Ions with (m/ze) for which the magnetic field is too weak will bend such that they will collide with the out wall and be neutralized (stream B)
V and r are fixed for a particular instrument and the mass range (range of (m/ze) is scanned by varying the magnetic field strength, B.
Detection
Only ions with (m/ze) satisfying the equation above wil pass through the mass analyzer to the ion detector. th detector pictured below is a Farady Cup detector.
When an ion hits the metal surface on the inside of the Faraday Cup detector the charge of the ion is neutralized by an electron. The flow of electrons in the wire is detected as an electric current which can be amplified and recorded. The more ions arriving, the greater the current.
What the mass spectrometer output looks like
The output from the chart recorder is usually simplified into a "stick diagram". This shows the relative current produced by ions of different m/ze values. The stick diagram for a collection molybdenum ions, (Mn+) looks similar to the image below:
You may find diagrams in which the vertical axis is labeled as either "relative abundance" or "relative intensity". Whichever is used, it means the same thing. The vertical scale is related to the current received by the chart recorder - and so to the number of ions arriving at the detector: the greater the current, the more abundant the ion.
The collection of peaks in the pictured mass spectrum is due to the natural abundance of the ions found in a large collection of molybdenum (Mo) ions. The singly charged ion of the most abundant isotope of Mo has a (m/ze) = 98. Other ions coming from the isotopes of Mo have (m/ze) values of 92, 94, 95, 96, 97 and 100.
Contributors and Attributions
Jim Clark (Chemguide.co.uk)