
10.3.5: Fluorescence Polarazation Analysis
- Page ID
- 257594
\( \newcommand{\vecs}[1]{\overset { \scriptstyle \rightharpoonup} {\mathbf{#1}} } \)
\( \newcommand{\vecd}[1]{\overset{-\!-\!\rightharpoonup}{\vphantom{a}\smash {#1}}} \)
\( \newcommand{\id}{\mathrm{id}}\) \( \newcommand{\Span}{\mathrm{span}}\)
( \newcommand{\kernel}{\mathrm{null}\,}\) \( \newcommand{\range}{\mathrm{range}\,}\)
\( \newcommand{\RealPart}{\mathrm{Re}}\) \( \newcommand{\ImaginaryPart}{\mathrm{Im}}\)
\( \newcommand{\Argument}{\mathrm{Arg}}\) \( \newcommand{\norm}[1]{\| #1 \|}\)
\( \newcommand{\inner}[2]{\langle #1, #2 \rangle}\)
\( \newcommand{\Span}{\mathrm{span}}\)
\( \newcommand{\id}{\mathrm{id}}\)
\( \newcommand{\Span}{\mathrm{span}}\)
\( \newcommand{\kernel}{\mathrm{null}\,}\)
\( \newcommand{\range}{\mathrm{range}\,}\)
\( \newcommand{\RealPart}{\mathrm{Re}}\)
\( \newcommand{\ImaginaryPart}{\mathrm{Im}}\)
\( \newcommand{\Argument}{\mathrm{Arg}}\)
\( \newcommand{\norm}[1]{\| #1 \|}\)
\( \newcommand{\inner}[2]{\langle #1, #2 \rangle}\)
\( \newcommand{\Span}{\mathrm{span}}\) \( \newcommand{\AA}{\unicode[.8,0]{x212B}}\)
\( \newcommand{\vectorA}[1]{\vec{#1}} % arrow\)
\( \newcommand{\vectorAt}[1]{\vec{\text{#1}}} % arrow\)
\( \newcommand{\vectorB}[1]{\overset { \scriptstyle \rightharpoonup} {\mathbf{#1}} } \)
\( \newcommand{\vectorC}[1]{\textbf{#1}} \)
\( \newcommand{\vectorD}[1]{\overrightarrow{#1}} \)
\( \newcommand{\vectorDt}[1]{\overrightarrow{\text{#1}}} \)
\( \newcommand{\vectE}[1]{\overset{-\!-\!\rightharpoonup}{\vphantom{a}\smash{\mathbf {#1}}}} \)
\( \newcommand{\vecs}[1]{\overset { \scriptstyle \rightharpoonup} {\mathbf{#1}} } \)
\( \newcommand{\vecd}[1]{\overset{-\!-\!\rightharpoonup}{\vphantom{a}\smash {#1}}} \)
\(\newcommand{\avec}{\mathbf a}\) \(\newcommand{\bvec}{\mathbf b}\) \(\newcommand{\cvec}{\mathbf c}\) \(\newcommand{\dvec}{\mathbf d}\) \(\newcommand{\dtil}{\widetilde{\mathbf d}}\) \(\newcommand{\evec}{\mathbf e}\) \(\newcommand{\fvec}{\mathbf f}\) \(\newcommand{\nvec}{\mathbf n}\) \(\newcommand{\pvec}{\mathbf p}\) \(\newcommand{\qvec}{\mathbf q}\) \(\newcommand{\svec}{\mathbf s}\) \(\newcommand{\tvec}{\mathbf t}\) \(\newcommand{\uvec}{\mathbf u}\) \(\newcommand{\vvec}{\mathbf v}\) \(\newcommand{\wvec}{\mathbf w}\) \(\newcommand{\xvec}{\mathbf x}\) \(\newcommand{\yvec}{\mathbf y}\) \(\newcommand{\zvec}{\mathbf z}\) \(\newcommand{\rvec}{\mathbf r}\) \(\newcommand{\mvec}{\mathbf m}\) \(\newcommand{\zerovec}{\mathbf 0}\) \(\newcommand{\onevec}{\mathbf 1}\) \(\newcommand{\real}{\mathbb R}\) \(\newcommand{\twovec}[2]{\left[\begin{array}{r}#1 \\ #2 \end{array}\right]}\) \(\newcommand{\ctwovec}[2]{\left[\begin{array}{c}#1 \\ #2 \end{array}\right]}\) \(\newcommand{\threevec}[3]{\left[\begin{array}{r}#1 \\ #2 \\ #3 \end{array}\right]}\) \(\newcommand{\cthreevec}[3]{\left[\begin{array}{c}#1 \\ #2 \\ #3 \end{array}\right]}\) \(\newcommand{\fourvec}[4]{\left[\begin{array}{r}#1 \\ #2 \\ #3 \\ #4 \end{array}\right]}\) \(\newcommand{\cfourvec}[4]{\left[\begin{array}{c}#1 \\ #2 \\ #3 \\ #4 \end{array}\right]}\) \(\newcommand{\fivevec}[5]{\left[\begin{array}{r}#1 \\ #2 \\ #3 \\ #4 \\ #5 \\ \end{array}\right]}\) \(\newcommand{\cfivevec}[5]{\left[\begin{array}{c}#1 \\ #2 \\ #3 \\ #4 \\ #5 \\ \end{array}\right]}\) \(\newcommand{\mattwo}[4]{\left[\begin{array}{rr}#1 \amp #2 \\ #3 \amp #4 \\ \end{array}\right]}\) \(\newcommand{\laspan}[1]{\text{Span}\{#1\}}\) \(\newcommand{\bcal}{\cal B}\) \(\newcommand{\ccal}{\cal C}\) \(\newcommand{\scal}{\cal S}\) \(\newcommand{\wcal}{\cal W}\) \(\newcommand{\ecal}{\cal E}\) \(\newcommand{\coords}[2]{\left\{#1\right\}_{#2}}\) \(\newcommand{\gray}[1]{\color{gray}{#1}}\) \(\newcommand{\lgray}[1]{\color{lightgray}{#1}}\) \(\newcommand{\rank}{\operatorname{rank}}\) \(\newcommand{\row}{\text{Row}}\) \(\newcommand{\col}{\text{Col}}\) \(\renewcommand{\row}{\text{Row}}\) \(\newcommand{\nul}{\text{Nul}}\) \(\newcommand{\var}{\text{Var}}\) \(\newcommand{\corr}{\text{corr}}\) \(\newcommand{\len}[1]{\left|#1\right|}\) \(\newcommand{\bbar}{\overline{\bvec}}\) \(\newcommand{\bhat}{\widehat{\bvec}}\) \(\newcommand{\bperp}{\bvec^\perp}\) \(\newcommand{\xhat}{\widehat{\xvec}}\) \(\newcommand{\vhat}{\widehat{\vvec}}\) \(\newcommand{\uhat}{\widehat{\uvec}}\) \(\newcommand{\what}{\widehat{\wvec}}\) \(\newcommand{\Sighat}{\widehat{\Sigma}}\) \(\newcommand{\lt}{<}\) \(\newcommand{\gt}{>}\) \(\newcommand{\amp}{&}\) \(\definecolor{fillinmathshade}{gray}{0.9}\)Fluorescence polarization measurements, or anisotropy measurements, provide information about the size and shape of molecules, the rigidity of molecular environments or the size of cavities.
In a steady state instrument one must add a linear polarization filter to select one polarization of the excitation light beam and a polarization analyzer to measure the fluorescence intensity perpendicular and parallel to the polarization of the excitation light. These are shown in Figure \(\PageIndex{1}\). As suggested in this figure, the linear polarizer and polarization analyzer can often be a selected option for a research grade spectrofluorometer.
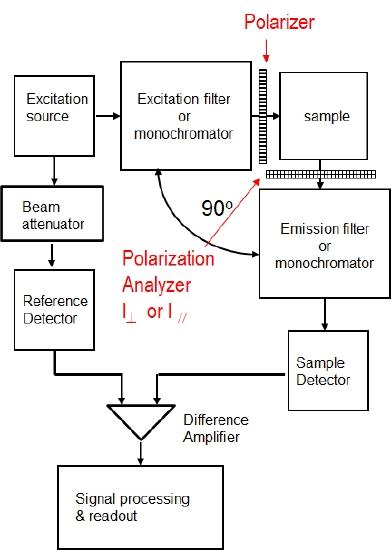
Figure \(\PageIndex{1}\): A Block diagram of a steady state spectrofluorometer equipped with a excitation polarizer and an emission polarization analyzer.
As shown in the Figure \(\PageIndex{2}\):parts (a) and (b), fluorophores preferentially absorb photons with electric field vectors that are aligned parallel to the transition moment of the fluorophore. Figure \(\PageIndex{2}\) (a) is the system before any fluorophores absorb light and Figure \(\PageIndex{1}\) (b) shows that only the fluorophores with an electric field vector that have absorbed a photon and are in the excited state.
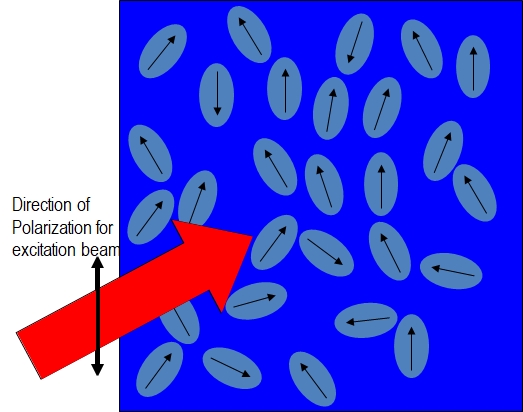
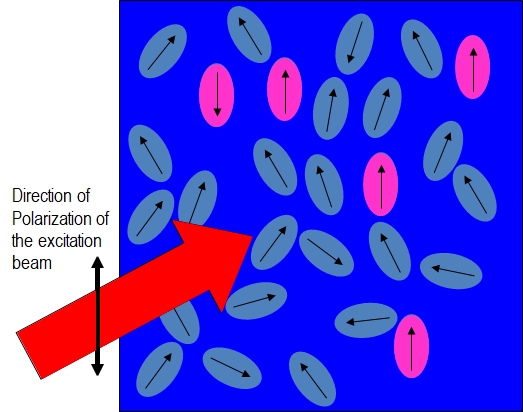
Figure\(\PageIndex{2}\); parts (a) and (b): Illustrating the preferential excitation of fluorophores with transition moments parallel to the electric field vector of the linearly polarized excitation beam.
Emission also occurs with the light polarized along the transition moment of the excited state fluorophore. The relative angle between the polarization of the incident light and the polarization of the emission determines the anisotropy, r.
\(r=\frac{F_{||}-F_{\perp}}{F_{||}+2 F_{\perp}}=\frac{r_{0}}{1+(\tau / \omega)}\)
Where F|| is the intensity of the emission polarized parallel to the polarization of the excitation beam and \(\mathrm{F}_{\perp}\) is the intensity of the emission polarized perpendicular to that of the excitation beam. In the simplest form of the experiment the emission is measured twice, once with the polarization analyzer orientated with it's direction parallel to the direction of the polarizer and a second time with its direction perpendicular to the direction of the polarizer. Based on the collection of the light being along only one direction, the anisotropy, r, can range from 0 to 0.4. A r value of 0 indicates the emitted light is randomly polarized or depolarized.
An alternative measure of the anisotropy of the emitted light is the polarization, P, of the system given by
\(P=\frac{F_{||}-F_{\perp}}{F_{||}+F_{\perp}}\)
Small fluorophores rotate extensively in 50 – 100 psec and can rotate many times during the nanosecond fluorescence lifetime of the excited state. Macromolecules take much longer to rotate. A big change occurs for a small molecular fluorophore when it becomes bound to macromolecule, trapped in a viscous environment, or contained in a small restrictive cavity. Figure \(\PageIndex{31}\) is a illustration of the large difference in rotational correlation time when a small, quickly rotating, fluorophore (green rectangle) associates with the large, slowly rotating, macromolecule (purple blob).
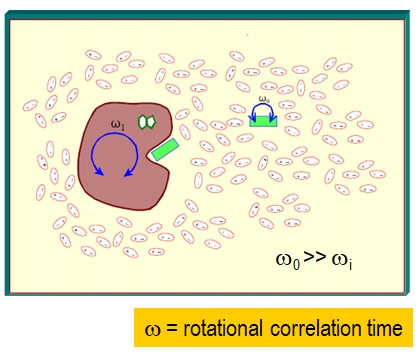
Figure \(\PageIndex{3}\): image source currently unknown
Consequently, fluorescence polarization analysis can be a useful method to measure binding events between fluorophores and macromolecules. In the example shown below, the interaction between acridine orange AO, a DNA intercalator, and a DNA oligomer is shown. The anisotropy data, plotted over the range of the emission spectrum, shows the emission is much more polarized (r = 0.240) when the AO is bound to the DNA strand then when it is free in solution (r = 0.018) and largely depolarized.