6.3.6: Pourbaix Diagrams
- Page ID
- 301385
\( \newcommand{\vecs}[1]{\overset { \scriptstyle \rightharpoonup} {\mathbf{#1}} } \)
\( \newcommand{\vecd}[1]{\overset{-\!-\!\rightharpoonup}{\vphantom{a}\smash {#1}}} \)
\( \newcommand{\id}{\mathrm{id}}\) \( \newcommand{\Span}{\mathrm{span}}\)
( \newcommand{\kernel}{\mathrm{null}\,}\) \( \newcommand{\range}{\mathrm{range}\,}\)
\( \newcommand{\RealPart}{\mathrm{Re}}\) \( \newcommand{\ImaginaryPart}{\mathrm{Im}}\)
\( \newcommand{\Argument}{\mathrm{Arg}}\) \( \newcommand{\norm}[1]{\| #1 \|}\)
\( \newcommand{\inner}[2]{\langle #1, #2 \rangle}\)
\( \newcommand{\Span}{\mathrm{span}}\)
\( \newcommand{\id}{\mathrm{id}}\)
\( \newcommand{\Span}{\mathrm{span}}\)
\( \newcommand{\kernel}{\mathrm{null}\,}\)
\( \newcommand{\range}{\mathrm{range}\,}\)
\( \newcommand{\RealPart}{\mathrm{Re}}\)
\( \newcommand{\ImaginaryPart}{\mathrm{Im}}\)
\( \newcommand{\Argument}{\mathrm{Arg}}\)
\( \newcommand{\norm}[1]{\| #1 \|}\)
\( \newcommand{\inner}[2]{\langle #1, #2 \rangle}\)
\( \newcommand{\Span}{\mathrm{span}}\) \( \newcommand{\AA}{\unicode[.8,0]{x212B}}\)
\( \newcommand{\vectorA}[1]{\vec{#1}} % arrow\)
\( \newcommand{\vectorAt}[1]{\vec{\text{#1}}} % arrow\)
\( \newcommand{\vectorB}[1]{\overset { \scriptstyle \rightharpoonup} {\mathbf{#1}} } \)
\( \newcommand{\vectorC}[1]{\textbf{#1}} \)
\( \newcommand{\vectorD}[1]{\overrightarrow{#1}} \)
\( \newcommand{\vectorDt}[1]{\overrightarrow{\text{#1}}} \)
\( \newcommand{\vectE}[1]{\overset{-\!-\!\rightharpoonup}{\vphantom{a}\smash{\mathbf {#1}}}} \)
\( \newcommand{\vecs}[1]{\overset { \scriptstyle \rightharpoonup} {\mathbf{#1}} } \)
\( \newcommand{\vecd}[1]{\overset{-\!-\!\rightharpoonup}{\vphantom{a}\smash {#1}}} \)
\(\newcommand{\avec}{\mathbf a}\) \(\newcommand{\bvec}{\mathbf b}\) \(\newcommand{\cvec}{\mathbf c}\) \(\newcommand{\dvec}{\mathbf d}\) \(\newcommand{\dtil}{\widetilde{\mathbf d}}\) \(\newcommand{\evec}{\mathbf e}\) \(\newcommand{\fvec}{\mathbf f}\) \(\newcommand{\nvec}{\mathbf n}\) \(\newcommand{\pvec}{\mathbf p}\) \(\newcommand{\qvec}{\mathbf q}\) \(\newcommand{\svec}{\mathbf s}\) \(\newcommand{\tvec}{\mathbf t}\) \(\newcommand{\uvec}{\mathbf u}\) \(\newcommand{\vvec}{\mathbf v}\) \(\newcommand{\wvec}{\mathbf w}\) \(\newcommand{\xvec}{\mathbf x}\) \(\newcommand{\yvec}{\mathbf y}\) \(\newcommand{\zvec}{\mathbf z}\) \(\newcommand{\rvec}{\mathbf r}\) \(\newcommand{\mvec}{\mathbf m}\) \(\newcommand{\zerovec}{\mathbf 0}\) \(\newcommand{\onevec}{\mathbf 1}\) \(\newcommand{\real}{\mathbb R}\) \(\newcommand{\twovec}[2]{\left[\begin{array}{r}#1 \\ #2 \end{array}\right]}\) \(\newcommand{\ctwovec}[2]{\left[\begin{array}{c}#1 \\ #2 \end{array}\right]}\) \(\newcommand{\threevec}[3]{\left[\begin{array}{r}#1 \\ #2 \\ #3 \end{array}\right]}\) \(\newcommand{\cthreevec}[3]{\left[\begin{array}{c}#1 \\ #2 \\ #3 \end{array}\right]}\) \(\newcommand{\fourvec}[4]{\left[\begin{array}{r}#1 \\ #2 \\ #3 \\ #4 \end{array}\right]}\) \(\newcommand{\cfourvec}[4]{\left[\begin{array}{c}#1 \\ #2 \\ #3 \\ #4 \end{array}\right]}\) \(\newcommand{\fivevec}[5]{\left[\begin{array}{r}#1 \\ #2 \\ #3 \\ #4 \\ #5 \\ \end{array}\right]}\) \(\newcommand{\cfivevec}[5]{\left[\begin{array}{c}#1 \\ #2 \\ #3 \\ #4 \\ #5 \\ \end{array}\right]}\) \(\newcommand{\mattwo}[4]{\left[\begin{array}{rr}#1 \amp #2 \\ #3 \amp #4 \\ \end{array}\right]}\) \(\newcommand{\laspan}[1]{\text{Span}\{#1\}}\) \(\newcommand{\bcal}{\cal B}\) \(\newcommand{\ccal}{\cal C}\) \(\newcommand{\scal}{\cal S}\) \(\newcommand{\wcal}{\cal W}\) \(\newcommand{\ecal}{\cal E}\) \(\newcommand{\coords}[2]{\left\{#1\right\}_{#2}}\) \(\newcommand{\gray}[1]{\color{gray}{#1}}\) \(\newcommand{\lgray}[1]{\color{lightgray}{#1}}\) \(\newcommand{\rank}{\operatorname{rank}}\) \(\newcommand{\row}{\text{Row}}\) \(\newcommand{\col}{\text{Col}}\) \(\renewcommand{\row}{\text{Row}}\) \(\newcommand{\nul}{\text{Nul}}\) \(\newcommand{\var}{\text{Var}}\) \(\newcommand{\corr}{\text{corr}}\) \(\newcommand{\len}[1]{\left|#1\right|}\) \(\newcommand{\bbar}{\overline{\bvec}}\) \(\newcommand{\bhat}{\widehat{\bvec}}\) \(\newcommand{\bperp}{\bvec^\perp}\) \(\newcommand{\xhat}{\widehat{\xvec}}\) \(\newcommand{\vhat}{\widehat{\vvec}}\) \(\newcommand{\uhat}{\widehat{\uvec}}\) \(\newcommand{\what}{\widehat{\wvec}}\) \(\newcommand{\Sighat}{\widehat{\Sigma}}\) \(\newcommand{\lt}{<}\) \(\newcommand{\gt}{>}\) \(\newcommand{\amp}{&}\) \(\definecolor{fillinmathshade}{gray}{0.9}\)Pourbaix Diagrams plot electrochemical stability for different redox states of an element as a function of pH. These diagrams are essentially phase diagrams that map the conditions of potential and pH (most typically in aqueous solutions) where different redox species are stable. The lines in Pourbaix diagrams represent redox and acid-base reactions, and are the parts of the diagram where two species can exist in equilibrium. For example, in the Pourbaix diagram for Fe below, the horizontal line between the Fe3+ and Fe2+ regions represents the reaction \(\ce{Fe^{3+}_{(aq)} + e^{-} = Fe^{2+}_{(aq)}}\), which has a standard potential of +0.77 V. While we could use standard potentials for all these lines, in practice Pourbaix diagrams are usually plotted for lower ion concentrations (often 1 mM) that are more relevant to corrosion and electrochemical experiments.
Example: Iron Pourbaix diagram
Areas in the Pourbaix diagram mark regions where a single species (Fe2+(aq), Fe3O4(s), etc.) is stable. More stable species tend to occupy larger areas.
Lines mark places where two species exist in equilibrium.
- Pure redox reactions are horizontal lines - these reactions are not pH-dependent
- Pure acid-base reactions are vertical lines - these do not depend on potential
- Reactions that are both acid-base and redox have a slope of -0.0592 V/pH x # H+⁄# e-)
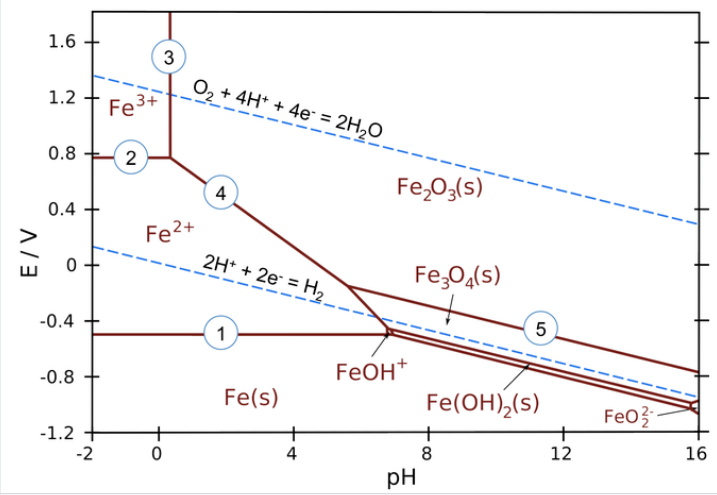
Examples of equilibria in the iron Pourbaix diagram (numbered on the plot):
1. \(\ce{Fe^{2+} + 2e^{-} -> Fe_{(s)}}\) (pure redox reaction - no pH dependence)
2. \(\ce{Fe^{3+} + e^{-} -> Fe^{2+}}\) (pure redox reaction - no pH dependence)
3. \(\ce{2Fe^{3+} + 3H2O -> Fe2O3_{(s)} + 6H^{+}}\) (pure acid-base, no redox)
4. \(\ce{2Fe^{2+} + 3H2O -> Fe2O3_{(s)} + 6H^{+} + 2e^{-}}\) (slope = -59.2 x 6/2 = -178 mV/pH)
5. \(\ce{2Fe3O4_{(s)} + H2O -> 2H^{+} + 2e^{-}}\) (slope = -59.2 x 2/2 = -59.2 mV/pH)
The water redox lines have special significance on a Pourbaix diagram for an element such as iron. Recall that liquid water is stable only in the region between the dotted lines. Below the H2 line, water is unstable relative to hydrogen gas, and above the O2 line, water is unstable with respect to oxygen. For active metals such as Fe, the region where the pure element is stable is typically below the H2 line. This means that iron metal is unstable in contact with water, undergoing reactions:
\(\ce{Fe_{(s)} + 2H^{+} -> Fe^{2+}_{(aq)} + H2}\) (in acid)
\(\ce{fe_{(s)} + 2H2O -> Fe(OH)2_{(s)} + H2}\) (in base)
Iron (and most other metals) are also thermodynamically unstable in air-saturated water, where the potential of the solution is close to the O2 line in the Pourbaix diagram. Here the spontaneous reactions are:
\(\ce{4Fe_{(s)} + 3O2 + 12H^{+} -> 4Fe^{3+} + 6H2O}\) (in acid)
\(\ce{4Fe_{(s)} + 3O2 -> 2Fe2O3_{(s)} (in base)
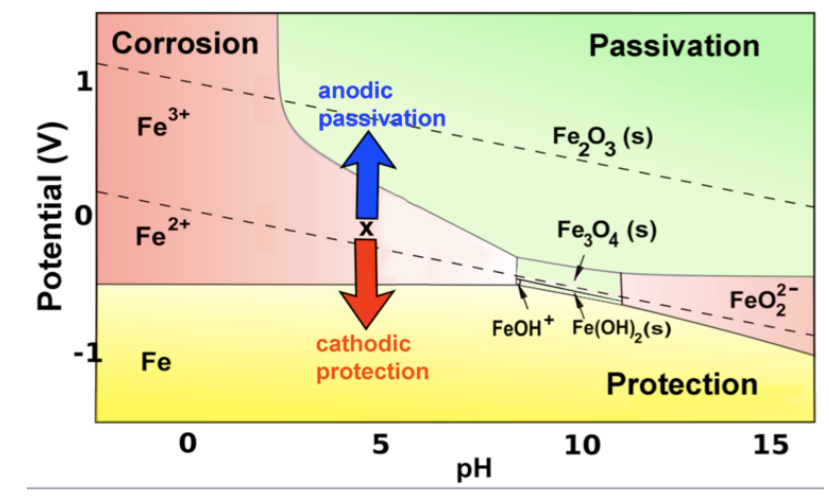
Corrosion and passivation. It certainly sounds bad for our friend Fe: unstable in water, no matter what the pH or potential. Given enough time, it will all turn into rust. But iron (and other active metals) can corrode, or can be stabilized against corrosion, depending on the conditions. Because our civilization is dependent on the use of active metals such as Fe, Al, Zn, Ti, Cr... for practically everything, it is important to understand this, and we can do so by referring to the Pourbaix diagram.
The corrosion of iron (and other active metals such as Al) is indeed rapid in parts of the Pourbaix diagram where the element is oxidized to a soluble, ionic product such as Fe3+(aq) or Al3+(aq). However, solids such as Fe2O3, and especially Al2O3, form a protective coating on the metal that greatly impedes the corrosion reaction. This phenomenon is called passivation.
Draw a vertical line through the iron Pourbaix diagram at the pH of tap water (about 6) and you will discover something interesting: at slightly acidic pH, iron is quite unstable with respect to corrosion by the reaction:
\[\ce{Fe_{(s)} + 2H^{+} -> Fe^{2+}_{(aq)} + H2}\]
but only in water that contains relatively little oxygen, i.e., in solutions where the potential is near the H2 line. Saturating the water with air or oxygen moves the system closer to the O2 line, where the most stable species is Fe2O3 and the corrosion reaction is:
\[\ce{4Fe_{(s)} + 3O2 -> 2Fe2O3_{(s)}}\]
This oxidation reaction is orders of magnitude slower because the oxide that is formed passivates the surface. Therefore iron corrodes much more slowly in oxygenated solutions.
More generally, iron (and other active metals) are passivated whenever they oxidize to produce a solid product, and corrode whenever the product is ionic and soluble. This behavior can be summed up on the color-coded Pourbaix diagram below. The red and green regions represent conditions under which oxidation of iron produces soluble and insoluble products, respectively.