
6.3.5: Latimer and Frost Diagrams
- Page ID
- 301384
\( \newcommand{\vecs}[1]{\overset { \scriptstyle \rightharpoonup} {\mathbf{#1}} } \)
\( \newcommand{\vecd}[1]{\overset{-\!-\!\rightharpoonup}{\vphantom{a}\smash {#1}}} \)
\( \newcommand{\id}{\mathrm{id}}\) \( \newcommand{\Span}{\mathrm{span}}\)
( \newcommand{\kernel}{\mathrm{null}\,}\) \( \newcommand{\range}{\mathrm{range}\,}\)
\( \newcommand{\RealPart}{\mathrm{Re}}\) \( \newcommand{\ImaginaryPart}{\mathrm{Im}}\)
\( \newcommand{\Argument}{\mathrm{Arg}}\) \( \newcommand{\norm}[1]{\| #1 \|}\)
\( \newcommand{\inner}[2]{\langle #1, #2 \rangle}\)
\( \newcommand{\Span}{\mathrm{span}}\)
\( \newcommand{\id}{\mathrm{id}}\)
\( \newcommand{\Span}{\mathrm{span}}\)
\( \newcommand{\kernel}{\mathrm{null}\,}\)
\( \newcommand{\range}{\mathrm{range}\,}\)
\( \newcommand{\RealPart}{\mathrm{Re}}\)
\( \newcommand{\ImaginaryPart}{\mathrm{Im}}\)
\( \newcommand{\Argument}{\mathrm{Arg}}\)
\( \newcommand{\norm}[1]{\| #1 \|}\)
\( \newcommand{\inner}[2]{\langle #1, #2 \rangle}\)
\( \newcommand{\Span}{\mathrm{span}}\) \( \newcommand{\AA}{\unicode[.8,0]{x212B}}\)
\( \newcommand{\vectorA}[1]{\vec{#1}} % arrow\)
\( \newcommand{\vectorAt}[1]{\vec{\text{#1}}} % arrow\)
\( \newcommand{\vectorB}[1]{\overset { \scriptstyle \rightharpoonup} {\mathbf{#1}} } \)
\( \newcommand{\vectorC}[1]{\textbf{#1}} \)
\( \newcommand{\vectorD}[1]{\overrightarrow{#1}} \)
\( \newcommand{\vectorDt}[1]{\overrightarrow{\text{#1}}} \)
\( \newcommand{\vectE}[1]{\overset{-\!-\!\rightharpoonup}{\vphantom{a}\smash{\mathbf {#1}}}} \)
\( \newcommand{\vecs}[1]{\overset { \scriptstyle \rightharpoonup} {\mathbf{#1}} } \)
\( \newcommand{\vecd}[1]{\overset{-\!-\!\rightharpoonup}{\vphantom{a}\smash {#1}}} \)
\(\newcommand{\avec}{\mathbf a}\) \(\newcommand{\bvec}{\mathbf b}\) \(\newcommand{\cvec}{\mathbf c}\) \(\newcommand{\dvec}{\mathbf d}\) \(\newcommand{\dtil}{\widetilde{\mathbf d}}\) \(\newcommand{\evec}{\mathbf e}\) \(\newcommand{\fvec}{\mathbf f}\) \(\newcommand{\nvec}{\mathbf n}\) \(\newcommand{\pvec}{\mathbf p}\) \(\newcommand{\qvec}{\mathbf q}\) \(\newcommand{\svec}{\mathbf s}\) \(\newcommand{\tvec}{\mathbf t}\) \(\newcommand{\uvec}{\mathbf u}\) \(\newcommand{\vvec}{\mathbf v}\) \(\newcommand{\wvec}{\mathbf w}\) \(\newcommand{\xvec}{\mathbf x}\) \(\newcommand{\yvec}{\mathbf y}\) \(\newcommand{\zvec}{\mathbf z}\) \(\newcommand{\rvec}{\mathbf r}\) \(\newcommand{\mvec}{\mathbf m}\) \(\newcommand{\zerovec}{\mathbf 0}\) \(\newcommand{\onevec}{\mathbf 1}\) \(\newcommand{\real}{\mathbb R}\) \(\newcommand{\twovec}[2]{\left[\begin{array}{r}#1 \\ #2 \end{array}\right]}\) \(\newcommand{\ctwovec}[2]{\left[\begin{array}{c}#1 \\ #2 \end{array}\right]}\) \(\newcommand{\threevec}[3]{\left[\begin{array}{r}#1 \\ #2 \\ #3 \end{array}\right]}\) \(\newcommand{\cthreevec}[3]{\left[\begin{array}{c}#1 \\ #2 \\ #3 \end{array}\right]}\) \(\newcommand{\fourvec}[4]{\left[\begin{array}{r}#1 \\ #2 \\ #3 \\ #4 \end{array}\right]}\) \(\newcommand{\cfourvec}[4]{\left[\begin{array}{c}#1 \\ #2 \\ #3 \\ #4 \end{array}\right]}\) \(\newcommand{\fivevec}[5]{\left[\begin{array}{r}#1 \\ #2 \\ #3 \\ #4 \\ #5 \\ \end{array}\right]}\) \(\newcommand{\cfivevec}[5]{\left[\begin{array}{c}#1 \\ #2 \\ #3 \\ #4 \\ #5 \\ \end{array}\right]}\) \(\newcommand{\mattwo}[4]{\left[\begin{array}{rr}#1 \amp #2 \\ #3 \amp #4 \\ \end{array}\right]}\) \(\newcommand{\laspan}[1]{\text{Span}\{#1\}}\) \(\newcommand{\bcal}{\cal B}\) \(\newcommand{\ccal}{\cal C}\) \(\newcommand{\scal}{\cal S}\) \(\newcommand{\wcal}{\cal W}\) \(\newcommand{\ecal}{\cal E}\) \(\newcommand{\coords}[2]{\left\{#1\right\}_{#2}}\) \(\newcommand{\gray}[1]{\color{gray}{#1}}\) \(\newcommand{\lgray}[1]{\color{lightgray}{#1}}\) \(\newcommand{\rank}{\operatorname{rank}}\) \(\newcommand{\row}{\text{Row}}\) \(\newcommand{\col}{\text{Col}}\) \(\renewcommand{\row}{\text{Row}}\) \(\newcommand{\nul}{\text{Nul}}\) \(\newcommand{\var}{\text{Var}}\) \(\newcommand{\corr}{\text{corr}}\) \(\newcommand{\len}[1]{\left|#1\right|}\) \(\newcommand{\bbar}{\overline{\bvec}}\) \(\newcommand{\bhat}{\widehat{\bvec}}\) \(\newcommand{\bperp}{\bvec^\perp}\) \(\newcommand{\xhat}{\widehat{\xvec}}\) \(\newcommand{\vhat}{\widehat{\vvec}}\) \(\newcommand{\uhat}{\widehat{\uvec}}\) \(\newcommand{\what}{\widehat{\wvec}}\) \(\newcommand{\Sighat}{\widehat{\Sigma}}\) \(\newcommand{\lt}{<}\) \(\newcommand{\gt}{>}\) \(\newcommand{\amp}{&}\) \(\definecolor{fillinmathshade}{gray}{0.9}\)There are a few different types of redox stability diagrams, two of which are known as Latimer diagrams and Frost diagrams. Each of these diagrams contains similar information, but one representation may be more useful in a given situation than the others.
Latimer and Frost diagrams help predict stability relative to higher and lower valence states, usually at one fixed pH. A third type of diagram, a Pourbaix diagram, helps understand pH-dependent equilibria, which are often coupled to solubility equilibria and corrosion (which will be talked about more later).
Latimer diagrams:
Latimer diagrams are the oldest and most compact way to represent electrochemical equilibria for substances that have multiple valence states. Electrochemical potential values are written for successive redox reactions (from highest to lowest oxidation state), typically under standard conditions in either strong acid ([H+] = 1 M, pH 0) or strong base ([OH-] = 1 M, pH 14). The valence states of successive substances in a Latimer diagram can differ by one or more electrons. Valence states for the element undergoing redox are typically determined by difference; we assign the oxygen atoms a valence state of -2 and the hydrogen atoms avalence state of +1.
Example:
Mn in Acid
|
The Latimer diagram for Mn illustrates its standard reduction potentials (in 1 M acid) in valence states from +7 to 0. |
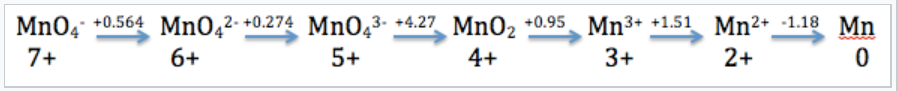
The Latimer diagram compresses into shorthand notation all the standard potentials for redox reactions of the element Mn. For example, the entry that connects Mn2+ and Mn gives the potential for the half-cell reaction:
\(\ce{Mn^{2+}_{(aq)} + 2e^{-} ->Mn_{(s)}}\) E1/2° = -1.18V
and the entry connecting Mn4+ and Mn3+ represents the reaction:
\(\ce{MnO2_{(s)} + 4H^{+}_{(aq)} + e^{-} -> Mn^{3+}_{(aq)} + 2H2O_{(l)}}\), :E1/2° = +0.95V
We can also calculate values for multi-electron reactions by first adding ΔG°(=-nFE°) values and then dividing by the total number of electrons
For example, for the 5-electron reduction of MnO4- to Mn2+, we write
\[E^{o} =\frac{1(0.564) + 1(0.274) + 1(4.27) + 1(0.95) + 1(1.51)}{5} = + 1.51V\]
and for the three-electron reduction of MnO4-(aq) to MnO2(s),
\[E^{o} = \frac{1(0.564) + 1(0.274) + 1(4.27)}{3} = +1.70V\]
Remember to divide by the number of electrons involved in the valence number change (5 and 3 for the above equations).
Thermodynamically stable and unstable oxidation states
An unstable species on a Latimer diagram will have a lower standard potential to the left than to the right.
Example:
\(\ce{2MnO4^{3-} -> MnO2 + MnO4^{2-}}\ ) the MnO43- species is unstable
\(E^{o}= +4.27-0.274 = 3.997V\) (spontaneous disproportionation)
Which Mn species are unstable with respect to disproportionation?
MnO43- 5+ → 6+,4+
Mn3+ 3+ → 4+,2+
So stable species are: MnO4-, MnO42-, MnO2, Mn2+, and Mn0.
But MnO42- is also unstable - why?
\(\ce{MnO4^{2-} -> MnO2}\)
\(\ce{2MnO4^{2-}->2MnO4^{-} + MnO2}\) E° = 2.272 - 0.564 = +1.708 V
Moral: All possible disproportionation reactions must be considered in order to determine stability (this is often more convenient with a Frost diagram).
Note
Thermodynamically unstable ions can be quite stable kinetically. For example, most N-containing molecules (NO2, NO, N2H4) are unstable relative to the elements (O2, N2, H2), but they are still quite stable kinetically.
Frost diagrams:
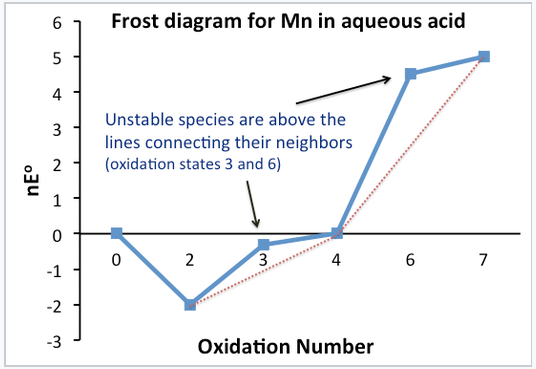
In a Frost diagram, we plot ΔG°⁄F (= nE°) vs. valence number. The zero valence state is assigned a nE° value of zero.[2]
Stable and unstable oxidation states can be easily identified in the plot. Unstable compounds are higher on the plot than the line connecting their neighbors. Note that this is simply a graphical representation of what we did with the Latimer diagram to determine which valence states were stable and unstable.
The standard potential for any electrochemical reaction is given by the slope of the line connecting the two species on a Frost diagram. For example, the line connecting Mn3+ and MnO2 on the Frost diagram has a slope of +0.95, the standard potential of MnO2 reduction to Mn3+. This is the number that is written above the arrow in the Latimer diagram for Mn. Multielectron potentials can be calculated easily by connecting the dots in a Frost diagram.
|
|
A Frost diagram:
- Contains the same information as in a Latimer diagram, but graphically shows stability and oxidizing power.
- The lowest species on the diagram are the most stable (Mn2+, MnO2)
- The highest species on diagram are the strongest oxidizers (MnO4-)