
4.3: HPLC procedure and instructions for data analysis
- Page ID
- 401437

Readying the HPLC for Operation
- Making sure the solvent reservoirs are full and the waste bottles have at least 1 Liter of volume available.
- Make sure there is room in the waste container to accommodate about 2 L of waste solvent.
- Launch Open Lab by clicking HPLC (online) (Figure \(\PageIndex{1}\)).
Figure \(\PageIndex{1}\): HPLC (online) desktop icon. - Use the Instrument Control Tab. Confirm that all components are green and indicate “ready.” (Figure \(\PageIndex{2}\))
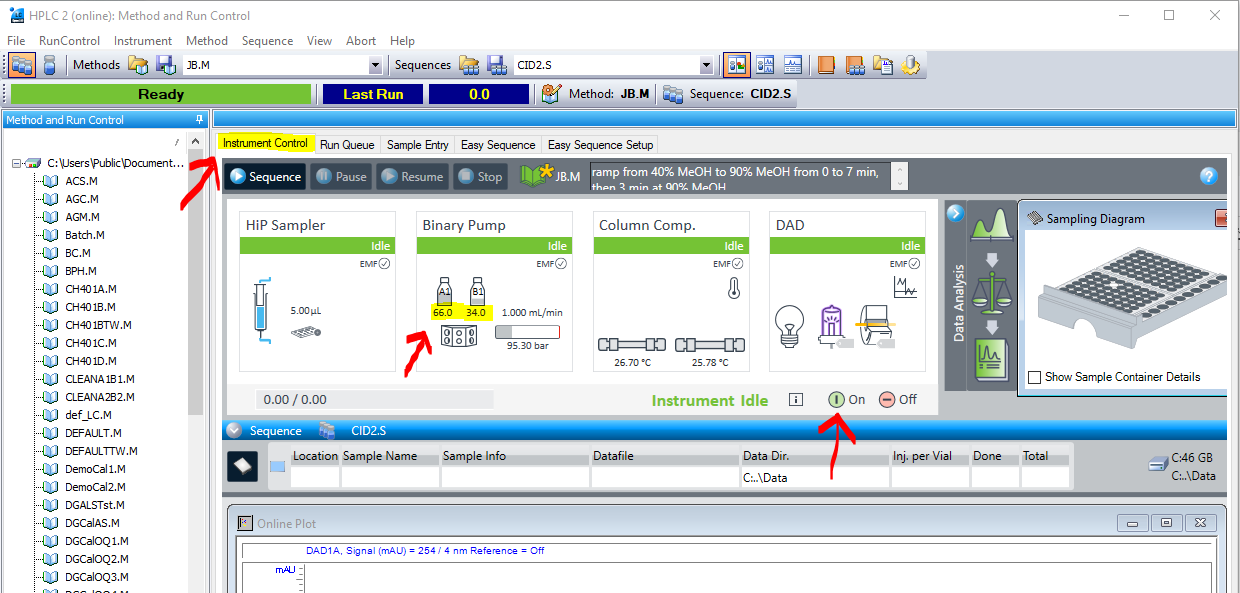
Figure \(\PageIndex{2}\): "Instrument Control" tab, "on" button, and solvent levels in the Binary Pump icon indicated by red arrows and yellow highlighting. The Ready Bar at the top left is green in this figure. - If this is not the case, press the “On” button.
- The DAD will take a few minutes to warm up; if there is a lightning bolt through the purple lamp, wait until it has gone away, and the ready bar has turned green.
- Make sure that the solvent amounts listed under the Binary Pump module are accurate. Adjust them as necessary.
- Prime the pumps to remove air bubbles from the lines (get your TA to help you with this).
- Equilibrate the column for your first injection: Begin pumping solvent through the column so that it is equilibrated prior to your first injection. If your first injection will use 100% methanol, pump 100% methanol through the column at a flow rate of 1 mL/min until the system is equilibrated.
Get your TA to help with this or follow these instructions:- Choose the DEFAULT method. You can do this by double clicking on DEFAULT.M in the Method and Run Control Panel (Left of instrument control screen) or by selecting Method from the top level menu, then Load Method, and selecting DEFAULT.M.
- After the method is loaded, go to Method --> Edit Entire Method.
- A box will appear in which you can select parts of the method to edit. Check only the Instrument/Acquisition option, and press OK. Then press OK in the next box also.
- The Setup Method control box will appear. In Binary Pump Tab, you can choose the solvents and flow rate. So, if you wish to flow 100% methanol, you would choose solvent B1, and type 100 into the percentage of B1. The flow rate should be 1.00 mL/min.
- After your solvent and flow rate are chosen, press apply, and the instrument should beginning to pump the solvent and flow rate you chose.
Part 1: Optimizing the Separation of a Paraben Mixture
Parabens are a class of chemicals widely used as preservatives in the cosmetic and pharmaceutical industries. Parabens are effective preservatives and are primarily used for their bactericidal and fungicidal properties. Parabens can be found in shampoos, shaving gels, personal lubricants, topical/parenteral pharmaceuticals, spray tanning lotion and toothpaste. Parabens can also be used as food additives. Paraben mixtures are often used in order to increase the efficiency of the preservation.
Recently, in-vivo and in-vitro studies have shown that parabens have weak estrogenic activity. Because parabens are endocrine disrupters, paraben concentrations have been mitigated and must not surpass the maximum permitted levels. Take the time to look up general paraben structures to develop an understanding of their chemical structure and polarity.
Because parabens are often found in mixtures, HPLC can be used to separate the individual compounds. To determine the components in the mixture, reverse phase HPLC will be performed through a C18 column. In this portion of the experiment, gradient and isocratic elution data will be collected and compared. The paraben mixture has already been prepared for you and contains 4-hydroxy benzoic acid, methyl-4-hydroxy benzoate, ethyl-4-hydroxy benzoate, and propyl-4-hydroxy benzoate.
To begin, five isocratic experiments will be performed. The conditions for the five experiments are listed in Table 2.2.
Table \(\PageIndex{1}\): Isocratic Experiment Conditions
| Experimental Run | Mobile Phase Composition |
|---|---|
| 1 | 100 % methanol |
| 2 | 90 % methanol / 10 % water |
| 3 | 80 % methanol / 20 % water |
| 4 | 70 % methanol / 30 % water |
| 5 | 60 % methanol / 40 % water |
Preparing a Sequence for the Paraben mixture
1. Set up six methods. Use the instructions for writing a method to create one method for each of the 5 isocratic runs and one for the gradient run.
- First create one method and then look through the method carefully with your TA and check that all the parameters are correct. Save the method once you are done.
- Use that method as the template for the next, and check your own work. Consult with your TA as necessary.
2. Set up a sequence. Use the instructions for setting up a sequence to run the paraben mixture using each of the five methods in Table \(\PageIndex{1}\).
3. Check your sequence. Go to Sequence and click Sequence Table and see the order of the samples.
- Each run will use the same sample which should be vial slot 1.
- Each method should be different for each run. To check this, click the “method” menu bar, click “method” in the selection menu, and select “edit entire method.”
6. Confirm that you have enough of the paraben mixture in the sample vial and that the sample vial is in the position that you entered into your sequence.
7. Run the sequence (instructions are in the Running a sequence section).
8. If you used the instructions for writing a method, the data will automatically print after each run. You can also print manually: find the data reports by clicking the “data analysis” tab in the bottom, and then print.
9. Before moving on, confirm that you have peaks for each of your runs. If you notice any issues with your data, talk with your TA.
*The sequence will take approximately one hour to run, so samples for Part 2 can be prepared while you wait.*
Part 2: Analysis of Caffeine in Beverages
Caffeine is a common chemical that we interact with on a daily basis and people have access to it in many forms. People may drink it in many types of beverages, eat it in different types of food, and even take it in pill form. Reverse phase HPLC can be used to determine the amount of caffeine in these items. In this experiment, you will be determining the amount of caffeine in coffee, tea, and a soft drink (or, bring your own sample of interest! Maybe you are really curious about how much caffeine is in the different coffees available around campus, or in your favorite energy drink. We can do that!). If the runs are performed with the same isocratic parameters, retention time can be used as a qualitative measure and peak area or peak height can be used as a quantitative measure of caffeine in a sample. In order to determine the concentration of caffeine in these samples, a calibration curve must be constructed using a set of standard solutions comparing either the peak height or peak area to the known concentration of the solution. For this experiment, you should use the caffeine standards that you created in the previous module. If for some reason your caffeine samples are not available, instructions for creating them are in the previous module.
Procedure for preparing the Standard Caffeine Samples for HPLC analysis
Prepare a stock solution 0.1 g/L caffeine
Use the solutions you prepared in the previous module (the caffeine standards) to complete the calibration of the HPLC. To prepare the solutions for the HPLC, you will need to filter them and place them in HPLC vials.
- Filter the solutions using the provided filter and syringe.
- The filter and syringe can be reused if the solutions are filtered from low concentration to high concentration.
- The syringes and filters can be found on the shelves above the balances. Use only one filter and one syringe.
- Rinse the filter with the solution to be filtered: Filter approximately 1 mL and dispose of it into a waste beaker.
- After the filter is rinsed, use it to filter the solution directly into the appropriate HPLC autosampler vial. (Figure \(\PageIndex{3}\)) DO NOT put tape on the vials; ask your TA for a sharpie to write directly on the vials.
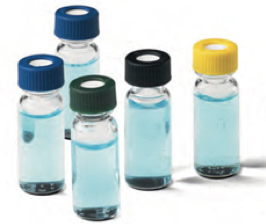
Figure \(\PageIndex{3}\): HPLC/CE vials. The HPLC can also use plastic vials that look quite similar. Image is taken from www.thermofisher.com
Procedure for preparing the Beverage Samples
The beverages are stored in the refrigerator in the lab. Beverages used in lab should not be consumed. Take the beverages out of the fridge and let them warm to room temperature before measuring volumes!
- Prepare the Coffee Sample.
- Pipette 5 mL of coffee into a clean and dry 50 mL volumetric flask and dilute to the mark with clean deionized water.
- Filter the sample using the provided filter.
- First, rinse the filter three times with 3 mL clean deionized water.
- Rinse the filter with the sample solution by filtering the first 1-2mL of the sample into the waste beaker.
- After rinsing the filter apparatus with sample solution, filter the sample directly into a clean vial and label the vial.
- Prepare the Tea Sample.
- Pipette 10 mL of tea into a clean and Dry 50 mL volumetric flask and dilute to the mark with clean deionized water.
- Filter the sample using the provided filter.
- First, rinse the filter three times with 3 mL clean deionized water.
- Rinse the filter with the sample solution by filtering the first 1-2mL of the sample into the waste beaker.
- After rinsing the filter apparatus with sample solution, filter the sample directly into a clean vial and label the vial.
- Prepare the Soft Drink Sample.
- If the soft drink you selected is carbonated, decarbonate the soft drink by pouring it back and forth between two beakers until the bubbles cease.
- Pipette 25 mL of the soft drink into a clean and Dry 50 mL volumetric flask and dilute to the mark with clean deionized water.
- Filter the sample using the provided filter.
- First, rinse the filter three times with 3 mL clean deionized water.
- Rinse the filter with the sample solution by filtering the first 1-2mL of the sample into the waste beaker.
- After rinsing the filter apparatus with sample solution, filter the sample directly into a clean vial and label the vial.
Preparing a Sequence for the Caffeine Standards and Samples
- Create an isocratic method for analysis of the caffeine samples.
- Use a solvent mixture of anywhere between 25-40% Methanol in water.
- Use the DAD to monitor the caffeine at the maximum absorbance that you determined in the previous module.
- Put standard caffeine solutions in Tray 1 (P1), positions D1-D5 with the least concentrated in slot 1 and the most concentrated in slot 5.
- Place the beverage samples in slots 6-8.
- Select the appropriate method in the menu bar.
- Click “method” in the selection menu and select “edit entire method.”
- Confirm that the flow rate is 1 mL/min
- Confirm that the solvent mixture is 50% Methanol and 50% Water.
- Confirm that the DAD is monitoring at 272 nm.
- Confirm that the injection volume is 5 uL.
- Go to “sequence” menu bar and select “CAFFEINE_LC.S.”
- Click “sequence” followed by “sequence template” and check to see that your samples are in the correct sample order/slots. Click “run sequence.”
- While the samples are running, make sure all of your bulk samples and caffeine standards are in sealed containers and are properly labeled in case you need to repeat this module.
- Confirm with your TA that your data looks appropriate before disposing of any solutions. You should clean the small vials for this experiment once you have collected all of your data.
- All caffeine solutions can be discarded down the sink.
- The markings on the outside of the vials should be removed.
- All vials should be rinsed well at least 5 times with deionized water and then with methanol.
- Dried vials should be returned to the appropriate storage location.
Treatment of Data
The general criteria for writing and submitting lab reports are found in the orientation module. Specific additional expectations for this module are given below.
- You can print the reports after each run or after all runs are complete. You can find the data reports by clicking the “data analysis” tab in the bottom left toolbar of the instrument control software window.
- Before completing the lab, confirm that you have peaks for each of your runs. If you notice any issues with your data, talk with your TA.
- Create a calibration curve using the caffeine standard peak height or area versus the concentration. This can be done using the Chemstation Sfotware or using the calibration template that you created earlier this semester.
- To create a calibration curve in Chemstation, start by clicking the “data analysis” tab in the bottom left corner of the window. This will open the HPLC (offline) window.
- Find your data in the file navigator on the left panel, and highlight it.
- Double click the first standard run in the sequence window.
- Find the “Calibration” tab in the menu bar and select “New Calibration Table.”
- A new window “Calibrate: HPLC1” will appear and select “Automatic setup.”
- Set the “level” to 1 and put the concentration of the first run in the “Default Amount.” Press “OK.”
- Double click the second run and go to the “Calibration” menu bar and click “Add Level.”
- Set the “Level” to 2 and enter the second run’s concentration in the “Default Amount.” Press “OK.”
- Repeat steps g and h for each of the remaining standard solutions.
- The Calibration Table and the Calibration Curve can be viewed in the bottom of the window. Confirm that all the points are there.
- Validate your calibration using a control sample provided by your instructors.
- Calculate the concentrations of caffeine in each beverage sample. *Note that each beverage was diluted differently.
Post-Lab Questions
Questions for Part 1: Separating a Paraben Mixture
**Include ALL Elution Data Reports**
- How many compounds are observed in the paraben mixture? Identify each peak on the gradient chromatogram.
- How would you experimentally confirm that your peak identifications are correct?
- Compare the results from the isocratic runs to the results from the gradient run.
- What advantages does the gradient elution offer?
- What disadvantages does the gradient elution have compared to the isocratic elution?
- Plot the results of the retention time of the last component (longest retention time in isocratic runs) versus percent Methanol for the series of isocratic runs. (plot log r.t. versus %MeOH). Do you obtain a linear plot? Explain.
-
The molar response factor (r) for a component \( \mathrm{C}_{\mathrm{n}}\) is defined as:
\(\mathrm{rC}_{\mathrm{n}}=\frac{\text { peak area }}{\text { moles of } \mathrm{C}_{\mathrm{n}} \text { injected }}\)
Use your data as the basis for a qualitative discussion of the wavelength dependence of response factors in HPLC using UV detection. Explain this dependence.
Questions for Part 2: Analysis of Caffeine in Beverages
- Using the calibration curve, determine the concentration of caffeine for each beverage in g/L.
a. Describe whether you used peak height, peak area, or both to estimate the concentration. Discuss the advantages to each method.
b. Make sure you take into account the dilutions you made when preparing the samples.
- Discuss the errors potentially made during this experiment.
- Discuss how retention times depend on methanol and the pH of the mobile phase. What factors contribute to the choice of mobile phase composition and pH in the present analysis.
References
- Engeli RT, Rohrer SR, Vuorinen A, et al. Interference of Paraben Compounds with Estrogen Metabolism by Inhibition of 17β-Hydroxysteroid Dehydrogenases. Int J Mol Sci. 2017;18(9):2007. pdf
- Larsson K, Ljung Björklund K, Palm B, et al. Exposure determinants of phthalates, parabens, bisphenol A and triclosan in Swedish mothers and their children. Environ Int. 2014;73:323-33. pdf
- McDevitt, V. L.; Rodriguez, A.; Williams, K. R. Analysis of Soft Drinks: UV Spectrophotometry, Liquid Chromatography, and Capillary Electrophoresis. J. Chem. Ed. 1998, 75, 625-629. pdf
- Skoog, D., Holler, F. J., & Crouch, S. R. (2017). Principles of Instrumental Analysis (Seventh ed.). Boston, MA: Cengage Learning.