
4.2: High performance liquid chromatography
- Page ID
- 401131

\( \newcommand{\vecs}[1]{\overset { \scriptstyle \rightharpoonup} {\mathbf{#1}} } \)
\( \newcommand{\vecd}[1]{\overset{-\!-\!\rightharpoonup}{\vphantom{a}\smash {#1}}} \)
\( \newcommand{\id}{\mathrm{id}}\) \( \newcommand{\Span}{\mathrm{span}}\)
( \newcommand{\kernel}{\mathrm{null}\,}\) \( \newcommand{\range}{\mathrm{range}\,}\)
\( \newcommand{\RealPart}{\mathrm{Re}}\) \( \newcommand{\ImaginaryPart}{\mathrm{Im}}\)
\( \newcommand{\Argument}{\mathrm{Arg}}\) \( \newcommand{\norm}[1]{\| #1 \|}\)
\( \newcommand{\inner}[2]{\langle #1, #2 \rangle}\)
\( \newcommand{\Span}{\mathrm{span}}\)
\( \newcommand{\id}{\mathrm{id}}\)
\( \newcommand{\Span}{\mathrm{span}}\)
\( \newcommand{\kernel}{\mathrm{null}\,}\)
\( \newcommand{\range}{\mathrm{range}\,}\)
\( \newcommand{\RealPart}{\mathrm{Re}}\)
\( \newcommand{\ImaginaryPart}{\mathrm{Im}}\)
\( \newcommand{\Argument}{\mathrm{Arg}}\)
\( \newcommand{\norm}[1]{\| #1 \|}\)
\( \newcommand{\inner}[2]{\langle #1, #2 \rangle}\)
\( \newcommand{\Span}{\mathrm{span}}\) \( \newcommand{\AA}{\unicode[.8,0]{x212B}}\)
\( \newcommand{\vectorA}[1]{\vec{#1}} % arrow\)
\( \newcommand{\vectorAt}[1]{\vec{\text{#1}}} % arrow\)
\( \newcommand{\vectorB}[1]{\overset { \scriptstyle \rightharpoonup} {\mathbf{#1}} } \)
\( \newcommand{\vectorC}[1]{\textbf{#1}} \)
\( \newcommand{\vectorD}[1]{\overrightarrow{#1}} \)
\( \newcommand{\vectorDt}[1]{\overrightarrow{\text{#1}}} \)
\( \newcommand{\vectE}[1]{\overset{-\!-\!\rightharpoonup}{\vphantom{a}\smash{\mathbf {#1}}}} \)
\( \newcommand{\vecs}[1]{\overset { \scriptstyle \rightharpoonup} {\mathbf{#1}} } \)
\( \newcommand{\vecd}[1]{\overset{-\!-\!\rightharpoonup}{\vphantom{a}\smash {#1}}} \)
Introduction
Samples collected from medical patients, industry products, and the environment are usually mixtures of many chemical compounds. Often times, doctors, producers, and researchers are interested in specific components in these mixtures, so these mixtures need to be separated into their individual components. High performance liquid chromatography (HPLC), or liquid chromatography (LC) is an extremely important analytical technique that is used for the separation, identification and quantitation of complex mixtures.
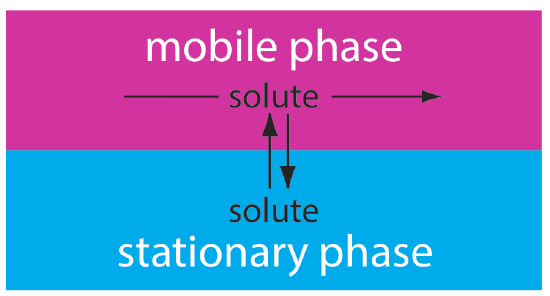
In liquid chromatography the chemical components in a mixture are carried through a stationary phase by the flow of a liquid mobile phase. Separation in liquid chromatography is achieved by means of differences in the interactions of the analytes with BOTH the mobile and stationary phases.
During an HPLC analysis of a mixture, the components will separate and elute from the column depending on the analytes interactions with the two phases. The time that it takes for a compound to elute from the column is the compound's retention time \(r_t\). This will produce a chromatogram; an example of a chromatogram can be seen in Figure \(\PageIndex{2}\). Notice that the \(x\) axis is in units of time. The \(y\) axis units depend on the detector used to monitor the elution. Either the peak height or the peak area can be used to estimate the concentration. Peak height and area values are proportional to the concentration when the peaks are sharp, and the flow rate is carefully controlled. Because the peak height and area are proportional to concentration, HPLC can be used to quantitate the amounts of each analyte in a mixture.

HPLC Instrumentation
A specialized apparatus is required for an HPLC separation because of the high pressures and low tolerances under which the separation occurs. If the results are to be reproducible, then the conditions of the separation must also be reproducible. Thus HPLC equipment must be able to pump solvent at reproducible rates, concentrations, and pressures. A diagram of an HPLC is shown in Figure \(\PageIndex{3}\). The HPLC apparatus consists of at least one or more reservoirs of solvent (mobile phase), a pump capable of pressures up to 4000 psi or greater, a valve for injecting the sample (usually \(2-500 \; \mu L\) volumes), a column, a detector, electronics associated with the detector, a computer to operate the instrument and record data, and a waste container. A schematic of an HPLC instrument can be seen in Figure 2.3. This instrument in the teaching labs at Duke lab uses a C18 column. The column compartment on our instruments is thermostated (temperature controlled). Our solvent delivery system includes solvent degassers and gradient valves for mixing solvents. And our instruments include a robot that automatically injects sample (robot/autosampler not shown on the diagram below).
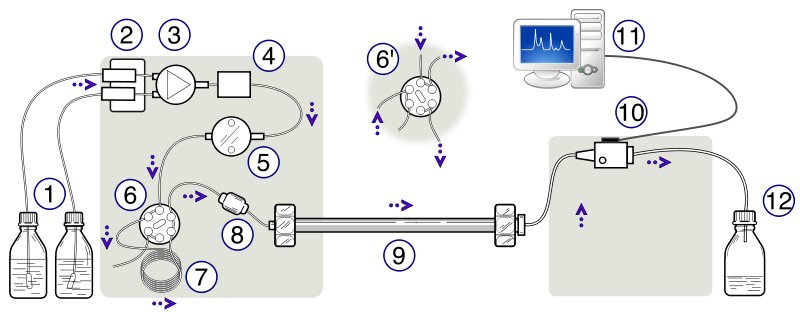
UV-visible absorbance is the most commonly used mode of detection, and our instruments at Duke include a photodiode array (PDA) detector that monitors absorption of UV-vis light. Such detectors enable the eluent (or effluent) from the column to flow through an 8 to 10 μL spectrophotometric cell for detection of compounds at a particular wavelength (often in the ultraviolet, < 400nm, where many organic molecules absorb). Electrochemical and fluorescence detectors often are used to achieve lower detection limits. The other commonly used detector is based on a measurement of the differential refractive index.
What to know about HPLC Components
The following is a list of common HPLC components. Details about the components you will use in this lab are found in the section on the Agilent HPLC Components at Duke (click here).
- The mobile phase, or solvent, is usually a mixture of polar and non-polar liquid components whose respective concentrations are varied depending on the composition of the sample. It is critical that the mobile phase is kept free of particulate matter or dissolved gas. As the solvent is passed through a very narrow bore column, any particles could at worst plug the column, or at the very least add variability to the retention times during repeated different trials. Therefore HPLC solvent and sample should be filtered through sub-micron filters to remove solid particles. The solvent is degassed to keep it free of dissolved gases, which could bubble out of solution mid-separation under changing pressures. Bubbles in the column causes band spreading. In addition, both bubbles and dust interfere with detector performance.
- The HPLC column, separates components of the sample based on their differing interactions with the column packing (stationary phase). If a species interacts more strongly with the stationary phase in the column, it will spend more time adsorbed to the column's adsorbent and will therefore have a greater retention time. Columns can be packed with solids such as silica or alumina; these columns are called homogeneous columns. If stationary phase in the column is a liquid, the column is deemed a bonded column. Bonded columns contain a liquid stationary phase bonded to a solid support, which is again usually silica or alumina. The value of the constant C described in the van Deemter equation is proportional, in HPLC, to the diameter of the particles that constitute the column's packing material.
- The HPLC pump drives the solvent and sample through the column. The requirements for the pumps used in liquid chromatography are severe and include (1) the generation of pressures up to 6000 psi, (2) pulse-free output, (3) flow rates ranging from 0.1 to 10 mL/min, (4) flow reproducibility of 0.2% or better, and (5) resistance to corrosion by a variety of solvents. To reduce variation in the elution, the pump must maintain a constant, pulse free, flow rate; this is achieved with multi-piston pumps. The presence of two pistons allows the flow rate to be controlled by one piston as the other recharges.
- The HPLC detector, located at the end of the column, must register the presence of various components of the sample, but must not detect the solvent. For that reason there is no universal detector that works for all separations. A common HPLC detector is a UV absorption detector, as most medium to large molecules absorb UV radiation. Detectors that measure fluorescence and refractive index are also used for special applications. It is also common for an instrument to include many different kinds of detectors. For example, it is common for HPLC with a UV-vis detector to be coupled with a mass spectrometer so that analytes can be identified based on mass. A relatively new development is the combination of an HPLC separation with an NMR detector. This allows the pure components of the sample to be identified and quantified by nuclear magnetic resonance after having been separated by HPLC, in one integrated process.
- Sample injection: The ideal sample injection system places the sample at the top of the column in a sharp well-defined plug of minimum thickness. Injection can be done manually or automatically using an automated sample injection system (autosampler).
Classes of Liquid Chromatography
The conventional classification of separation modes in LC is that of liquid-solid, liquid-liquid, ion-exchange, and size-exclusion chromatography. Four general classes of LC can be distinguished from this perspective (listed below); these classes differ in the type of stationary phase and mobile phase used. Reverse phase will be used in the in-lab HPLC module of this course.
Classes of Liquid Chromatography:
- Normal-phase chromatography calls for the use of a polar stationary phase in conjunction with a non-polar (dispersive) mobile phase.
- Reverse-phase chromatography, the opposite possibility, calls for the use of a non-polar stationary phase and a polar mobile phase (composed of one or more of the solvents water, methanol, acetonitrile, and tetrahydrofuran). The majority of chromatographic analyses fall into one of these two classes.
- Ion-exchange chromatography involves ionic interactions. In this case the mobile phase must support ionization to ensure solubility of ionic solutes. The stationary phase must also be partially ionic to promote some retention. Consequently, the interactions with the stationary phase are strong, and this is usually reflected in longer analysis times and broad peaks.
- Size-Exclusion chromatography involves separations based on molecular size alone and ideally requires that there be no energetic interaction of the solutes with the stationary phase.
In this HPLC module, you will use reverse-phase LC using C18-modified silica particles packed tightly into a metal cylinder. The alkyl group is bound covalently to the silica particles; bonded stationary phases are created by reacting the silica particles with an organochlorosilane of the general form Si(CH3)2RCl, where R is an alkyl or substituted alkyl group.

The properties of a stationary phase depend on the organosilane’s alkyl group. If R is a polar functional group, then the stationary phase is polar. Examples of polar stationary phases include those where R contains a cyano (–C2H4CN), a diol (–C3H6OCH2CHOHCH2OH), or an amino (–C3H6NH2) functional group. Because the stationary phase is polar, the mobile phase is a nonpolar or a moderately polar solvent. The combination of a polar stationary phase and a nonpolar mobile phase is called normal- phase chromatography.
In reversed-phase chromatography, which is the more common form of HPLC, the stationary phase is nonpolar and the mobile phase is polar. The most common nonpolar stationary phases use an organochlorosilane where the R group is an n-octyl (\(\ce{C8}\)) or n-octyldecyl (\(\ce{C18}\)) hydrocarbon chain. In this course, you will be using the most common type; a \(\ce{C18}\) - derivatized silica stationary phase (aka "C18")
It seems odd that the more common form of liquid chromatography is identified as reverse-phase instead of normal phase. One of the earliest examples of chromatography was Mikhail Tswett’s separation of plant pigments using a polar column of calcium carbonate and a nonpolar mobile phase of petroleum ether. The assignment of "normal" and "reversed", therefore, is all about precedence.
The interactions of solutes with an alkyl-bonded phase, such as the C18 bonded-phase silica, are dispersive, and a polar mobile phase is conventionally used in conjunction with these stationary phases. The non-polar stationary phase makes these systems very useful for separating organic compounds with slight differences in the backbones or side-chains.
Separation Efficiency Depends on Affinities for Mobile and Stationary Phases
All chromatographic separations, including HPLC operate under the same basic principle; every compound interacts with other chemical species in a characteristic manner. Chromatography separates a sample into its constituent parts because of the difference in the relative affinities of different molecules for the mobile phase and the stationary phase used in the separation.
Distribution Constant (\(K_c\))
All chemical reactions have a characteristic equilibrium constant. For the reaction
\[ A_{aq} + B_s \rightleftharpoons AB_s \label{1}\]
There is a chemical equilibrium constant Keq that dictates what percentage of compound A will be in solution and what percentage will be bound to the stationary compound B. During a chromatographic separation, there is similar relationship between compound A and the solvent, or mobile phase, C. This will yield an overall equilibrium equation which dictates the quantity of A that will be associated with the stationary phase and the quantity of A that will be associated with the mobile phase.
\[ A_{mobile} \rightleftharpoons A_{stationary} \label{2}\]
The equilibrium between the mobile phase and stationary phase is given by the constant distribution constant, Kc.
\[ K_c = \dfrac{(a_A )_S}{(a_A )_M} \label{3}\]
Where \((a_A )_S\) is the activity of compound A in the stationary phase, and \((a_A )_M\) is the activity of compound A in the mobile phase. In most separations, which contain low concentrations of the species to be separated, the activity of A in each is approximately equal to the concentration of A in that state (\((a_A )\approx [A]\)); thus equation \ref{3} can be approximated in terms of concentration:
\[ K_c \approx \frac{[A]_S}{[A]_M} \label{kc}\]
The distribution constant indicates the amount of time that compound A spends adsorbed to the stationary phase as the opposed to the amount of time A spends solvated by the mobile phase. This relationship determines the amount of time it will take for compound A to travel the length of the column. The more time A spends adsorbed to the stationary phase, the more time compound A will take to travel the length of the column. The amount of time between the injection of a sample and its elution from the column is known as the retention time; it is given the symbol tR.
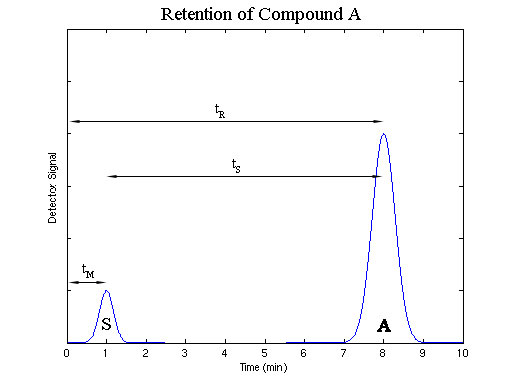
The amount of time required for a sample that does not interact with the stationary phase, or has a Kc equal to zero, to travel the length of the column is known as the void time, tM. No compound can be eluted in less than the void time.
Retention Factor
Since Kc is a factor that is wholly dependent on a particular column and solvent flow rate, a quantitative measure of the affinity of a compound for a particular set of mobile and stationary phases that does not depend on the column geometry is useful. The retention factor, k, can be derived from Kc and is independent of the column size and the solvent flow rate.
\[ k = \dfrac{K_C V_S }{V_M } \label{4}\]
The retention factor is calculated by multiplying the distribution constant by the volume of stationary phase in the column and dividing by the volume of mobile phase in the column.
Selectivity
In order to separate two compounds, their respective retention factors must be different, otherwise both compounds would be eluted simultaneously; the selectivity factor is the ratio of the retention factors.
\[ \alpha = \dfrac{k_B }{k_A} \label{5}\]
Where B is the compound that is retained more strongly by the column and A is the compound with the faster elution time.
Band Broadening
As a compound passes through the column it slowly diffuses away from the initial injection band, which is the area of greatest concentration. The initial, narrow, band that contained all of the sample becomes broader the longer the analyte remains in the column. This band broadening increases the time required for complete elution of a particular compound and is generally undesirable. It must be minimized so that overly broad elution bands do not overlap with one another. We will see how this is measured quantitatively when we discuss peak resolution momentarily.
Plate Height is a Measure of Separation Efficiency
In analytical chemistry, a quantitative metric of separation efficiency is theoretical plates. The concept of plates as a separation metric arose from the original method of fractional distillation, where compounds were separated based on their volatilities through many simultaneous simple distillations, each simple distillation occurred on one of many distillation plates. In chromatography, there are no actual plates, and you should think of the theoretical plates purely as a measure of separation efficiency. We say that a column is more efficient at a separation if it has a smaller theoretical plate height (\(H\)) or a higher number (\(N\)) of theoretical plates. And, for any given column, the \(H\) and \(N\) depend on an individual solute's diffusion coefficient.
Since there is no "real" height, nor are their "real" plates, we refer to the plates as theoretical plates, and their height is the height equivalent of the theoretical plate (HETP or H). When a solute travels through a column, its peak width depends on its diffusion and the length or time that it has traveled on the column. Assuming that the peak is Gaussian in shape, the width of an elution peak at its base is approximately four standard deviations (\(w=4\sigma\)). The theoretical plate height is given by the peak's variance (variance = standard deviation squared...\(\sigma^2\) ) divided by the distance it has traveled (the length of the column, \(L\)).
\[ H = \dfrac{\sigma ^2}{L} \label{7}\]
For a column of length \(L\), the number of theoretical plates is the length divided by the plate height (\(N=\frac{L}{H}\)). Using the relationship between plate height and number of plates, and the relationship between peak width and standard deviation, the number of plates can also be found in terms of retention time and peak width (Equation \ref{8}). \(N\) is a dimensionless number, and in equation \ref{8} both \(L\) and \(w\) are in units of length.
\[ N = \frac{L}{H}= \frac{L^2}{\sigma ^2}= \frac{16L^2}{w^2} \label{8} \]
A more useful form of equation \ref{8} is in terms of time; L can be expressed as retention time \(t_R\) and \(w\) is the width of the base of the elution peak in units of time.
\[N=\frac{16t_R^2}{w^2} = {t_R^2}{\sigma ^2}\]
In order to optimize separation efficiency, it is necessary in maximize the number of theoretical plates, which requires reducing the plate height. The plate height is related to the flow rate of the mobile phase, so for a fixed set of mobile phase, stationary phase, and analytes; separation efficiency can be maximized by optimizing flow rate as dictated by the van Deemter equation.
\[ H = A + \dfrac{B}{v} + Cv \label{10}\]
The three constants in the van Deemter equation are factors that describe possible causes of band broadening in a particular separation. \(A\) is a constant which represents the different possible paths that can be taken by the analyte through the stationary phase, it decreases if the packing of the column is kept as small as possible. \(B\) is a constant that describes the longitudinal diffusion that occurs in the system. \(C\) is a constant that describes the rate of adsorption and desorption of the analyte to the stationary phase. \(A\), \(B\) and \(C\) are constant for any given system (with constant analyte, stationary phase, and mobile phase), so flow rate must be optimized accordingly. If the flow rate is too low, the longitudinal diffusion factor (\(\dfrac{B}{v}\)) will increase significantly, which will increase plate height. At low flow rates, the analyte spends more time at rest in the column and therefore longitudinal diffusion in a more significant problem. If the flow rate is too high, the mass transfer term (\(Cv\)) will increase and reduce column efficiency. At high flow rates the adsorption of the analyte to the stationary phase results in some of the sample lagging behind, which also leads to band broadening.
Resolution
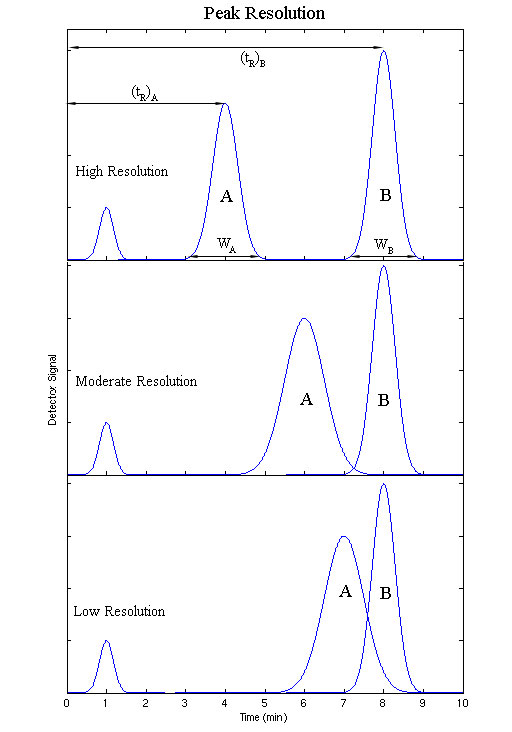
The resolution of a elution is a quantitative measure of how well two elution peaks can be differentiated in a chromatographic separation. It is defined as the difference in retention times between the two peaks, divided by the combined widths of the elution peaks.
\[ R_S = \dfrac{2\left[ {\left( {t_R } \right)_B - \left( {t_R } \right)_A } \right]}{W_B + W_A} \label{11}\]
Where B is the species with the longer retention time, and tR and W are the retention time and elution peak width respectively. If the resolution is greater than one, the peaks can usually be differentiated successfully.
Optimizing Separation using Reverse-Phase Chromatography
The objective of optimization in chromatography depends on the goals of a given project. For an analytic chemist, optimization usually means that the resolution is maximized while the time and solvent use is minimized. This mans that individual peaks elute separately (with no overlapping peaks), the peak shapes are consistent and sharp across the entire chromatogram, and that this is accomplished in the shortest amount of time possible. By and large, and certainly in this experiment, optimization of the mobile phase composition is the primary objective. Your goal is to select the mobile phase composition and elution timetable that will achieve good resolution and peak shape within a reasonable analysis time.
Selection of mobile phase
Selecting the mobile phase (or solvent) is one of the most important steps when performing HPLC and is selected based on polarity. Solvent polarity relates to the ability of the components to partition into that phase. The polarity scale for different solvents can be found in Table \(\PageIndex{1}\). These solvents can be used exclusively or mixed to achieve the desired polarity.
| Solvent | Relative Polarity |
|---|---|
| Fluoroalkanes | <-2> |
| Cyclohexane | .04 |
| 1-Chlorobutane | 1.0 |
| Carbon tetrachloride | 1.6 |
| Toluene | 2.4 |
| Tetrahydrofuran (THF) | 4.0 |
| Ethanol | 4.3 |
| Methanol | 5.1 |
| Acetonitrile | 5.8 |
| Ethylene glycol | 6.9 |
| Water | 10.2 |
When considering which factors affect the separation in a reverse phase HPLC experiment we should think not only about polarity, but also about hydrogen bonding ability (of both solvents and species being separated). The following data offer information on the dielectric constants (\(\epsilon\))1 of the solvents we could use in this experiment; and, the hydrogen bonding donor (\(\alpha\), also known as hydrogen bonding acidity) and hydrogen bonding acceptor (\(\beta\), also known as hydrogen bonding basicity)2 values.
| Solvent | \(\epsilon\) | \(\alpha\) | \(\beta\) |
|---|---|---|---|
| Water | 78.5 | 1.17 | 0.47 |
| Methanol | 32.6 | 0.98 | 0.66 |
| Acetonitrile | 37.5 | 0.19 | 0.40 |
1. Common Organic Solvents: Table of Properties, http://www2.onu.edu/~b-myers/organic_solvents.html, accessed December 7, 2012.
2. Tables for Chemistry: Kamlet-Taft Solvent Parameters, http://www.stenutz.eu/chem/solv26.php, accessed December 7, 2012.
What we see from these numbers is that all three solvents are polar. While water has by far the highest dielectric constant, methanol and acetonitrile have high values (for comparison: hexane, toluene and methylene chloride have ε values of 1.89, 2.38 and 9.08 respectively). All three also have similar hydrogen bonding acceptor values, not surprising since all three have atoms with one or more lone pair of electrons that could interact with an electron deficient hydrogen from a solvent or a solute molecule. Notice that compared to water and methanol, acetonitrile has a very low hydrogen bonding donor number. This too is not surprising since acetonitrile is not considered a protic solvent. It has no hydrogen bound to an electronegative atom, that would participate in hydrogen bonding.
When considering how a molecule will behave in an HPLC experiment we want to consider not only solute-solvent interactions (i.e., is the sample strongly associated with the solvent or the column), but also solvent-solvent interactions (how will the sample associate with, or disrupt, the structure of the solvent)
Gradient Elution vs. Isocratic Elution
If the composition of the mobile phase remains constant throughout the HPLC separation, the separation is deemed an isocratic elution. Often the only way to elute all of the compounds in the sample in a reasonable amount of time, while still maintaining peak resolution, is to change the ratio of polar to non-polar compounds in the mobile phase during the sample run. Known as gradient chromatography, this is the technique of choice when a sample contains components of a wide range of polarities. For a reverse phase gradient, the solvent starts out relatively polar and slowly becomes more non-polar. The gradient elution offers the most complete separation of the peaks, without taking an inordinate amount of time. A sample containing compounds of a wide range of polarities can be separated by a gradient elution in a shorter time period without a loss of resolution in the earlier peaks or excessive broadening of later peaks. However, gradient elution requires more complex and expensive equipment and it is more difficult to maintain a constant flow rate while there are constant changes in mobile phase composition. Gradient elution tests the limitations of lower-quality experimental apparatus, making the results obtained less reproducible in equipment already prone to variation. If the flow rate or mobile phase composition fluctuates, the results will not be reproducible.
Applications
HPLC can be used in both qualitative and quantitative applications, that is for both compound identification and quantification. Normal phase HPLC is only rarely used now, almost all HPLC separation can be performed in reverse phase. Reverse phase HPLC is broadly effective, with the exception of only a few separation types; it cannot separate inorganic ions (they can be separated by ion exchange chromatography). It cannot separate polysaccharides (they are too hydrophilic for any solid phase adsorption to occur), nor polynucleotides (they adsorb irreversibly to the reverse phase packing). Lastly, incredibly hydrophobic compounds cannot be separated effectively (there is little selectivity). Aside from these few exceptions, Reverse phase HPLC is used for the separation of almost all other compound varieties. It can be used to effectively separate similar simple and aromatic hydrocarbons, even those that differ only by a single methylene group. It also effectively separates simple amines, sugars, lipids, and even pharmaceutically active compounds. Reverse phase HPLC is also used in the separation of amino acids, peptides, and proteins. Finally reverse phase HPLC is used to separate molecules of biological origin.
The determination of caffeine content in coffee products is routinely done by reverse phase HPLC in commercial applications in order to guarantee purity and quality of ground coffee. HPLC is a useful addition to an analytical arsenal, especially for the separation of a sample before further analysis.
References
- Skoog, D.; Holler, F.; Crouch, S. Principles of Instrumental Analysis 2007
- Swadesh, J.K. HPLC: Practical and Industrial Applications 2001
- Waters Corporation: History of Chromatography (accessed March 3, 2008)
- Harvey, Analytical Chemistry 2.1, Chapter 12: Chromatographic and Eletrophoretic Methods.
- High Performance Liquid Chromatography (Supplemental Modules, Analytical Chemistry, Libretexts)