
13.1: The Electromagnetic Spectrum
- Page ID
- 63740
\( \newcommand{\vecs}[1]{\overset { \scriptstyle \rightharpoonup} {\mathbf{#1}} } \)
\( \newcommand{\vecd}[1]{\overset{-\!-\!\rightharpoonup}{\vphantom{a}\smash {#1}}} \)
\( \newcommand{\id}{\mathrm{id}}\) \( \newcommand{\Span}{\mathrm{span}}\)
( \newcommand{\kernel}{\mathrm{null}\,}\) \( \newcommand{\range}{\mathrm{range}\,}\)
\( \newcommand{\RealPart}{\mathrm{Re}}\) \( \newcommand{\ImaginaryPart}{\mathrm{Im}}\)
\( \newcommand{\Argument}{\mathrm{Arg}}\) \( \newcommand{\norm}[1]{\| #1 \|}\)
\( \newcommand{\inner}[2]{\langle #1, #2 \rangle}\)
\( \newcommand{\Span}{\mathrm{span}}\)
\( \newcommand{\id}{\mathrm{id}}\)
\( \newcommand{\Span}{\mathrm{span}}\)
\( \newcommand{\kernel}{\mathrm{null}\,}\)
\( \newcommand{\range}{\mathrm{range}\,}\)
\( \newcommand{\RealPart}{\mathrm{Re}}\)
\( \newcommand{\ImaginaryPart}{\mathrm{Im}}\)
\( \newcommand{\Argument}{\mathrm{Arg}}\)
\( \newcommand{\norm}[1]{\| #1 \|}\)
\( \newcommand{\inner}[2]{\langle #1, #2 \rangle}\)
\( \newcommand{\Span}{\mathrm{span}}\) \( \newcommand{\AA}{\unicode[.8,0]{x212B}}\)
\( \newcommand{\vectorA}[1]{\vec{#1}} % arrow\)
\( \newcommand{\vectorAt}[1]{\vec{\text{#1}}} % arrow\)
\( \newcommand{\vectorB}[1]{\overset { \scriptstyle \rightharpoonup} {\mathbf{#1}} } \)
\( \newcommand{\vectorC}[1]{\textbf{#1}} \)
\( \newcommand{\vectorD}[1]{\overrightarrow{#1}} \)
\( \newcommand{\vectorDt}[1]{\overrightarrow{\text{#1}}} \)
\( \newcommand{\vectE}[1]{\overset{-\!-\!\rightharpoonup}{\vphantom{a}\smash{\mathbf {#1}}}} \)
\( \newcommand{\vecs}[1]{\overset { \scriptstyle \rightharpoonup} {\mathbf{#1}} } \)
\( \newcommand{\vecd}[1]{\overset{-\!-\!\rightharpoonup}{\vphantom{a}\smash {#1}}} \)
\(\newcommand{\avec}{\mathbf a}\) \(\newcommand{\bvec}{\mathbf b}\) \(\newcommand{\cvec}{\mathbf c}\) \(\newcommand{\dvec}{\mathbf d}\) \(\newcommand{\dtil}{\widetilde{\mathbf d}}\) \(\newcommand{\evec}{\mathbf e}\) \(\newcommand{\fvec}{\mathbf f}\) \(\newcommand{\nvec}{\mathbf n}\) \(\newcommand{\pvec}{\mathbf p}\) \(\newcommand{\qvec}{\mathbf q}\) \(\newcommand{\svec}{\mathbf s}\) \(\newcommand{\tvec}{\mathbf t}\) \(\newcommand{\uvec}{\mathbf u}\) \(\newcommand{\vvec}{\mathbf v}\) \(\newcommand{\wvec}{\mathbf w}\) \(\newcommand{\xvec}{\mathbf x}\) \(\newcommand{\yvec}{\mathbf y}\) \(\newcommand{\zvec}{\mathbf z}\) \(\newcommand{\rvec}{\mathbf r}\) \(\newcommand{\mvec}{\mathbf m}\) \(\newcommand{\zerovec}{\mathbf 0}\) \(\newcommand{\onevec}{\mathbf 1}\) \(\newcommand{\real}{\mathbb R}\) \(\newcommand{\twovec}[2]{\left[\begin{array}{r}#1 \\ #2 \end{array}\right]}\) \(\newcommand{\ctwovec}[2]{\left[\begin{array}{c}#1 \\ #2 \end{array}\right]}\) \(\newcommand{\threevec}[3]{\left[\begin{array}{r}#1 \\ #2 \\ #3 \end{array}\right]}\) \(\newcommand{\cthreevec}[3]{\left[\begin{array}{c}#1 \\ #2 \\ #3 \end{array}\right]}\) \(\newcommand{\fourvec}[4]{\left[\begin{array}{r}#1 \\ #2 \\ #3 \\ #4 \end{array}\right]}\) \(\newcommand{\cfourvec}[4]{\left[\begin{array}{c}#1 \\ #2 \\ #3 \\ #4 \end{array}\right]}\) \(\newcommand{\fivevec}[5]{\left[\begin{array}{r}#1 \\ #2 \\ #3 \\ #4 \\ #5 \\ \end{array}\right]}\) \(\newcommand{\cfivevec}[5]{\left[\begin{array}{c}#1 \\ #2 \\ #3 \\ #4 \\ #5 \\ \end{array}\right]}\) \(\newcommand{\mattwo}[4]{\left[\begin{array}{rr}#1 \amp #2 \\ #3 \amp #4 \\ \end{array}\right]}\) \(\newcommand{\laspan}[1]{\text{Span}\{#1\}}\) \(\newcommand{\bcal}{\cal B}\) \(\newcommand{\ccal}{\cal C}\) \(\newcommand{\scal}{\cal S}\) \(\newcommand{\wcal}{\cal W}\) \(\newcommand{\ecal}{\cal E}\) \(\newcommand{\coords}[2]{\left\{#1\right\}_{#2}}\) \(\newcommand{\gray}[1]{\color{gray}{#1}}\) \(\newcommand{\lgray}[1]{\color{lightgray}{#1}}\) \(\newcommand{\rank}{\operatorname{rank}}\) \(\newcommand{\row}{\text{Row}}\) \(\newcommand{\col}{\text{Col}}\) \(\renewcommand{\row}{\text{Row}}\) \(\newcommand{\nul}{\text{Nul}}\) \(\newcommand{\var}{\text{Var}}\) \(\newcommand{\corr}{\text{corr}}\) \(\newcommand{\len}[1]{\left|#1\right|}\) \(\newcommand{\bbar}{\overline{\bvec}}\) \(\newcommand{\bhat}{\widehat{\bvec}}\) \(\newcommand{\bperp}{\bvec^\perp}\) \(\newcommand{\xhat}{\widehat{\xvec}}\) \(\newcommand{\vhat}{\widehat{\vvec}}\) \(\newcommand{\uhat}{\widehat{\uvec}}\) \(\newcommand{\what}{\widehat{\wvec}}\) \(\newcommand{\Sighat}{\widehat{\Sigma}}\) \(\newcommand{\lt}{<}\) \(\newcommand{\gt}{>}\) \(\newcommand{\amp}{&}\) \(\definecolor{fillinmathshade}{gray}{0.9}\)Electromagnetic radiation—light—is a form of energy whose behavior is described by the properties of both waves and particles. Some properties of electromagnetic radiation, such as its refraction when it passes from one medium to another are explained best by describing light as a wave. Other properties, such as absorption and emission, are better described by treating light as a particle. The exact nature of electromagnetic radiation remains unclear, as it has since the development of quantum mechanics in the first quarter of the 20th century.1 Nevertheless, the dual models of wave and particle behavior provide a useful description for electromagnetic radiation.
Electromagnetic radiation consists of oscillating electric and magnetic fields that propagate through space along a linear path and with a constant velocity. In a vacuum electromagnetic radiation travels at the speed of light, c, which is 2.997 92 × 108 m/s. When electromagnetic radiation moves through a medium other than a vacuum its velocity, v, is less than the speed of light in a vacuum. The difference between v and c is sufficiently small (<0.1%) that the speed of light to three significant figures, 3.00 × 10⁸ m/s, is accurate enough for most purposes.
The oscillations in the electric and magnetic fields are perpendicular to each other, and to the direction of the wave’s propagation. Figure \(\PageIndex{1}\) shows an example of plane-polarized electromagnetic radiation, consisting of a single oscillating electric field and a single oscillating magnetic field.
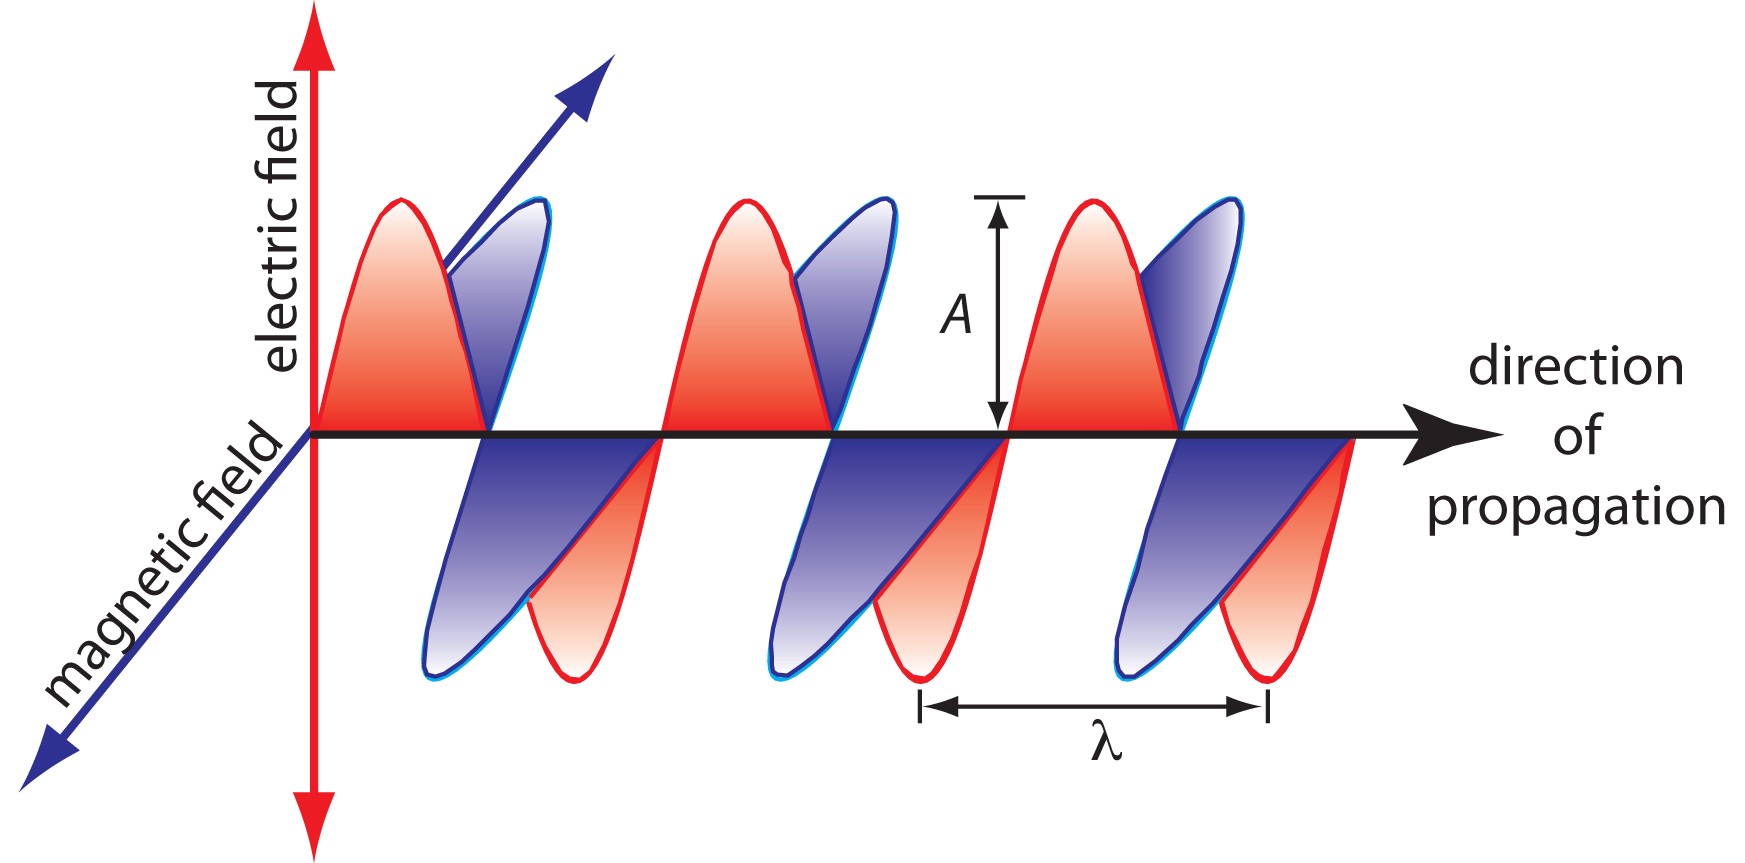
Figure \(\PageIndex{1}\): Plane-polarized electromagnetic radiation showing the oscillating electric field in red and the oscillating magnetic field in blue. The radiation’s amplitude, A, and its wavelength, λ, are shown. Normally, electromagnetic radiation is unpolarized, with oscillating electric and magnetic fields present in all possible planes perpendicular to the direction of propagation.
An electromagnetic wave is characterized by several fundamental properties, including its velocity, amplitude, frequency, phase angle, polarization, and direction of propagation.2 For example, the amplitude of the oscillating electric field at any point along the propagating wave is
\[A_\ce{t} = A_\ce{e}\sin(2πνt + \phi)\]
where At is the magnitude of the electric field at time t, Ae is the electric field’s maximum amplitude, ν is the wave’s frequency—the number of oscillations in the electric field per unit time—and \(\phi\) is a phase angle, which accounts for the fact that At need not have a value of zero at t = 0. The identical equation for the magnetic field is
\[A_\ce{t} =A_\ce{m}\sin(2πνt + \phi)\]
where Am is the magnetic field’s maximum amplitude.
Units
Other properties also are useful for characterizing the wave behavior of electromagnetic radiation. The wavelength, λ, is defined as the distance between successive maxima (Figure \(\PageIndex{1}\)). For ultraviolet and visible electromagnetic radiation the wavelength is usually expressed in nanometers (1 nm = 10–9 m), and for infrared radiation it is given in microns (1 μm = 10–6 m). The relationship between wavelength and frequency is
\[λ = \dfrac{c}{ν}\]
Another unit useful unit is the wavenumber, \(\tilde{ν}\), which is the reciprocal of wavelength
\[\tilde{ν} = \dfrac{1}{λ}\]
Wavenumbers are frequently used to characterize infrared radiation, with the units given in cm–1.
In 1817, Josef Fraunhofer studied the spectrum of solar radiation, observing a continuous spectrum with numerous dark lines. Fraunhofer labeled the most prominent of the dark lines with letters. In 1859, Gustav Kirchhoff showed that the D line in the sun’s spectrum was due to the absorption of solar radiation by sodium atoms. The wavelength of the sodium D line is 589 nm. What are the frequency and the wavenumber for this line?
Solution
The frequency and wavenumber of the sodium D line are
\[ν = \dfrac{c}{λ} = \mathrm{\dfrac{3.00×10^8\: m/s}{589×10^{−9}\: m} = 5.09×10^{14}\: s^{−1}}\]
\[\tilde{ν} = \dfrac{1}{λ} = \mathrm{\dfrac{1}{589×10^{−9}\: m} × \dfrac{1\: m}{100\: cm} = 1.70×10^4\: cm^{−1}}\]
Another historically important series of spectral lines is the Balmer series of emission lines form hydrogen. One of the lines has a wavelength of 656.3 nm. What are the frequency and the wavenumber for this line?
Click here to review your answer to this exercise.
Regions of the Spectrum
The frequency and wavelength of electromagnetic radiation vary over many orders of magnitude. For convenience, we divide electromagnetic radiation into different regions—the electromagnetic spectrum—based on the type of atomic or molecular transition that gives rise to the absorption or emission of photons (Figure \(\PageIndex{2}\)). The boundaries between the regions of the electromagnetic spectrum are not rigid, and overlap between spectral regions is possible.
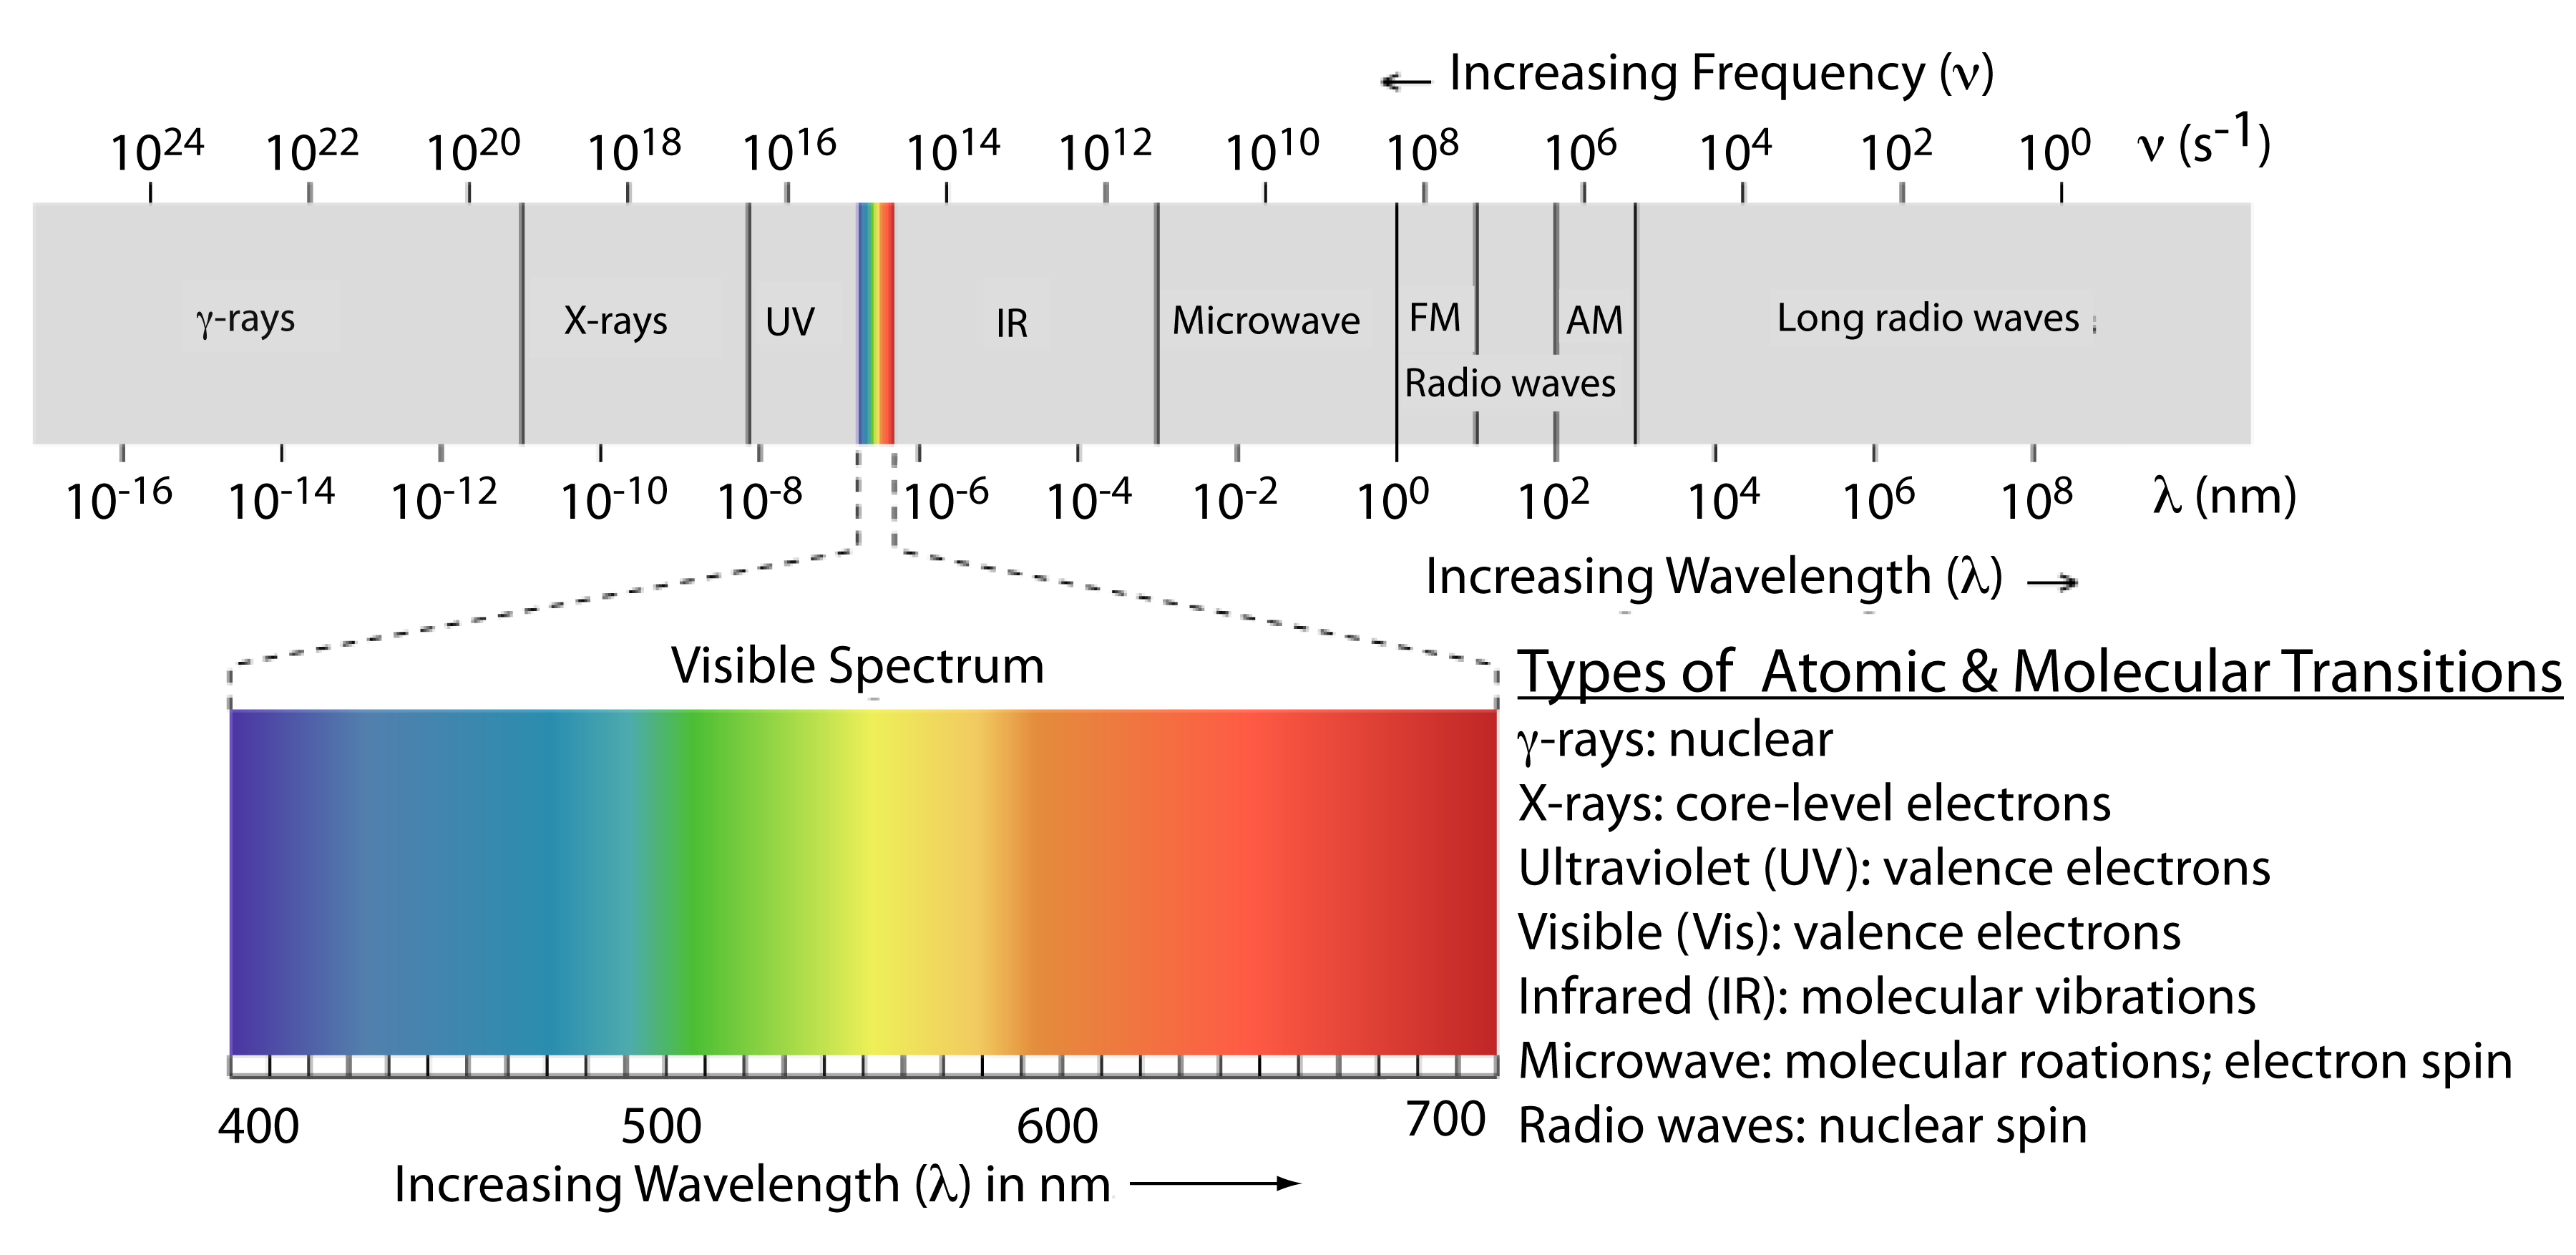
Figure \(\PageIndex{2}\): The electromagnetic spectrum showing the boundaries between different regions and the type of atomic or molecular transition responsible for the change in energy. The colored inset shows the visible spectrum. Source: modified from Zedh (www.commons.wikipedia.org).
Above, we defined several characteristic properties of electromagnetic radiation, including its energy, velocity, amplitude, frequency, phase angle, polarization, and direction of propagation. A spectroscopic measurement is possible only if the photon’s interaction with the sample leads to a change in one or more of these characteristic properties. We can divide spectroscopy into two broad classes of techniques. In one class of techniques there is a transfer of energy between the photon and the sample. Table \(\PageIndex{1}\) provides a list of several representative examples.
|
|
Region of |
|
|---|---|---|
|
absorption |
γ-ray |
Mossbauer spectroscopy |
|
|
X-ray |
X-ray absorption spectroscopy |
|
|
UV/Vis |
UV/Vis spectroscopy atomic absorption spectroscopy |
|
|
IR |
infrared spectroscopy raman spectroscopy |
|
|
Microwave |
microwave spectroscopy |
|
|
Radio wave |
electron spin resonance spectroscopy nuclear magnetic resonance spectroscopy |
|
emission (thermal excitation) |
UV/Vis |
atomic emission spectroscopy |
|
photoluminescence |
X-ray |
X-ray fluorescence |
|
|
UV/Vis |
fluorescence spectroscopy phosphorescence spectroscopy atomic fluorescence spectroscopy |
|
chemiluminescence |
UV/Vis |
chemiluminescence spectroscopy |
When given the energy level of the molecules along with wavelength, we can easily figure the frequency of the molecules where they fall in the electromagnetic spectrum regions. The given equation:
\(\Delta E=E_u-E_l=h\)
The above equation describes the energy change between upper state and lower state of energy.
- Frequency falls between 109 - 1011 which is in the microwave range correlates to the rotation of polyatomic molecules.
- Frequency falls between 1011 - 1013 which is in the far infared range correlates to the rotation of small molecules.
- Frequency falls between 1013 - 1014 which is in the infared range correlates to the vibrations of flexible bonds.
- Frequency falls between 1014 - 1016 which is in the visible and ultraviolet range correlates to the electronic transitions.
The powerful technique of figuring out the the frequency of the molecules can help us determine the bond length, temperature, probability distribution as you will learn later on from the degree of freedoms and how the process is undergo in specific a reaction.
Absorption and Emission
In absorption spectroscopy a photon is absorbed by an atom or molecule, which undergoes a transition from a lower-energy state to a higher-energy, or excited state (Figure \(\PageIndex{3}\)). The type of transition depends on the photon’s energy. The electromagnetic spectrum in Figure \(\PageIndex{2}\), for example, shows that absorbing a photon of visible light promotes one of the atom’s or molecule’s valence electrons to a higher-energy level. When an molecule absorbs infrared radiation, on the other hand, one of its chemical bonds experiences a change in vibrational energy.
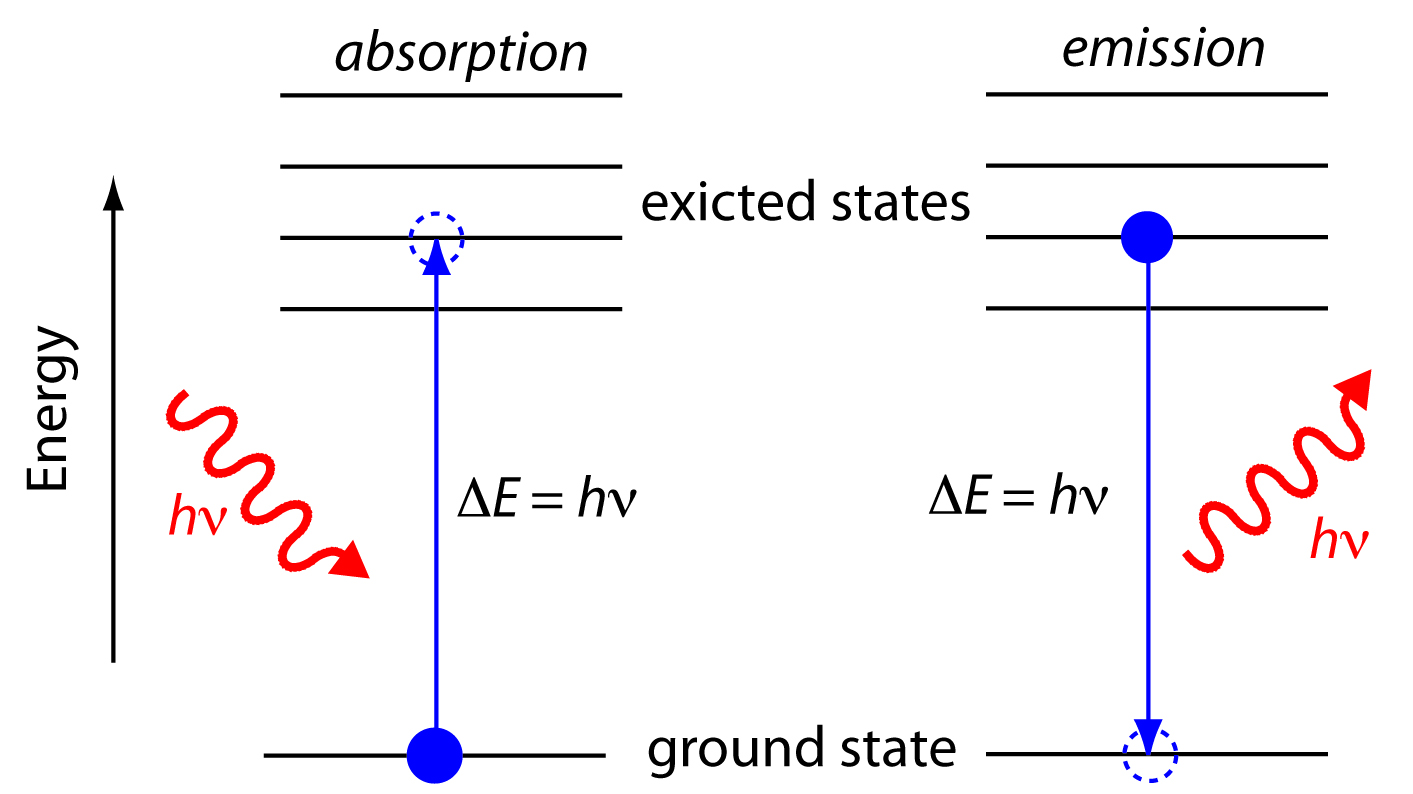
Figure \(\PageIndex{3}\): Simplified energy diagram showing the absorption and emission of a photon by an atom or a molecule. When a photon of energy hν strikes the atom or molecule, absorption may occur if the difference in energy, ∆E, between the ground state and the excited state is equal to the photon’s energy. An atom or molecule in an excited state may emit a photon and return to the ground state. The photon’s energy, hν, equals the difference in energy, ∆E, between the two states.
When it absorbs electromagnetic radiation the number of photons passing through a sample decreases. The measurement of this decrease in photons, which we call absorbance, is a useful analytical signal. Note that the each of the energy levels in Figure \(\PageIndex{3}\) has a well-defined value because they are quantized. Absorption occurs only when the photon’s energy, hν, matches the difference in energy, ∆E, between two energy levels. A plot of absorbance as a function of the photon’s energy is called an absorbance spectrum. Figure \(\PageIndex{4}\), for example, shows the absorbance spectrum of cranberry juice.
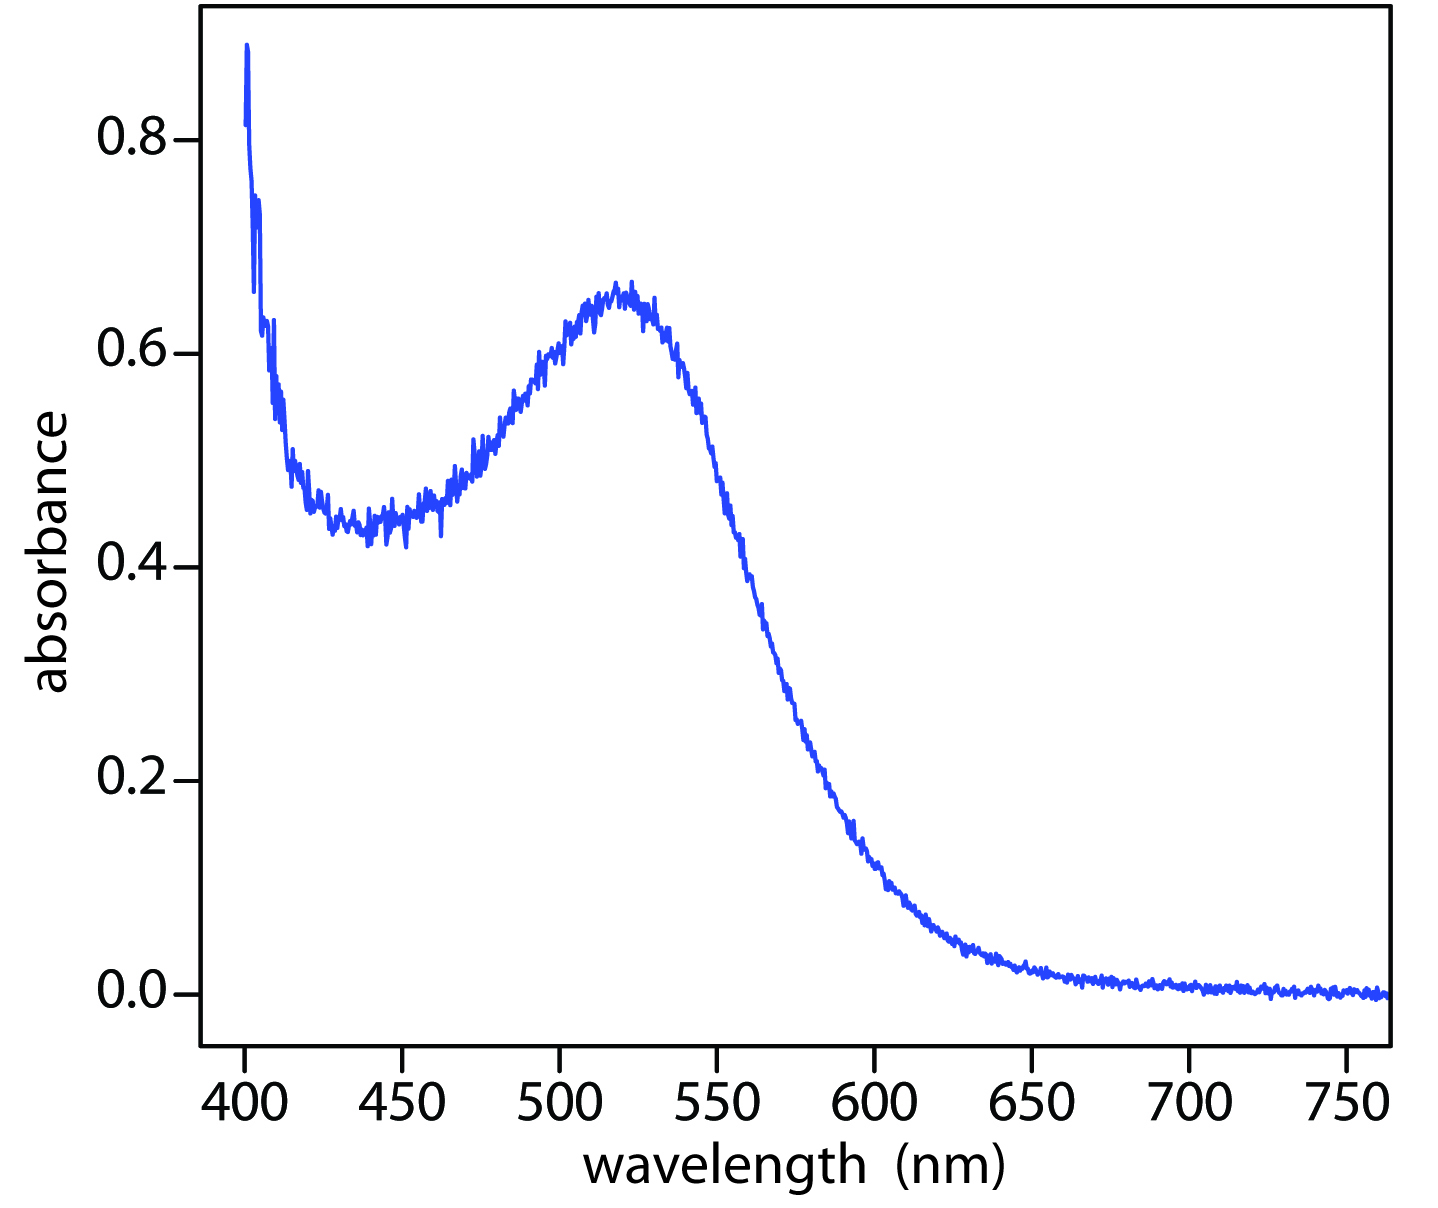
Figure \(\PageIndex{4}\): Visible absorbance spectrum for cranberry juice. The anthocyanin dyes in cranberry juice absorb visible light with blue, green, and yellow wavelengths (see Figure \(\PageIndex{3}\)). As a result, the juice appears red.
When an atom or molecule in an excited state returns to a lower energy state, the excess energy often is released as a photon, a process we call emission (Figure \(\PageIndex{4}\)). There are several ways in which an atom or molecule may end up in an excited state, including thermal energy, absorption of a photon, or by a chemical reaction. Emission following the absorption of a photon is also called photoluminescence, and that following a chemical reaction is called chemiluminescence. A typical emission spectrum is shown in Figure \(\PageIndex{5}\).
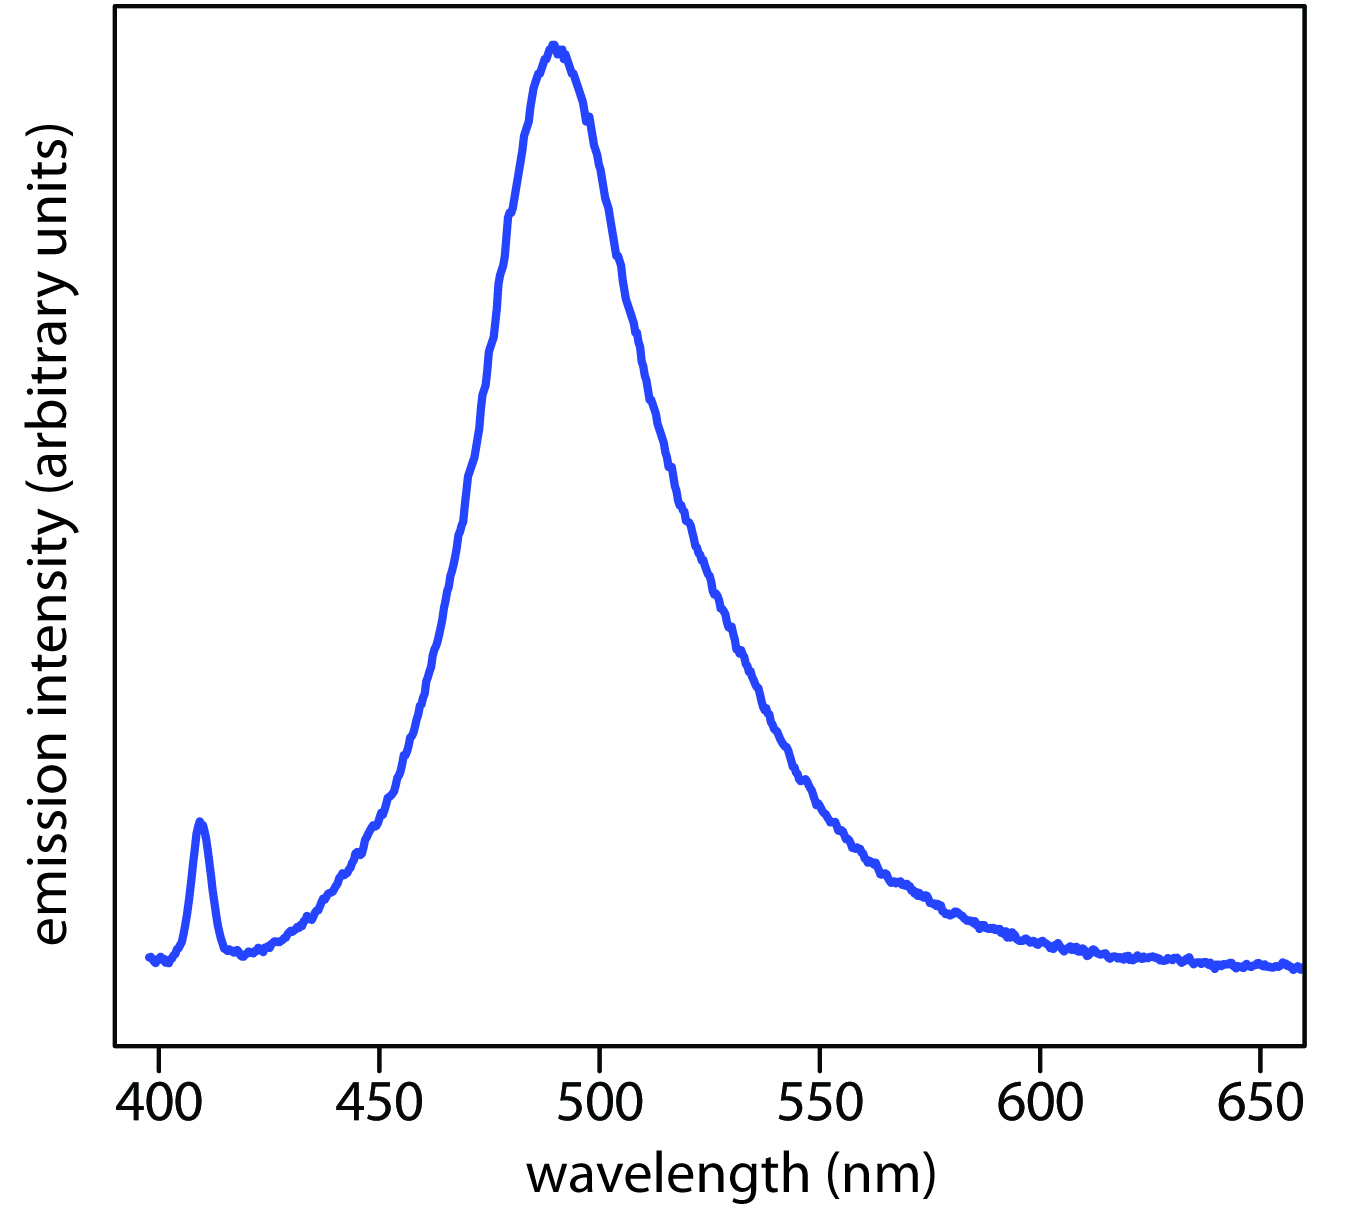
Figure \(\PageIndex{5}\): Photoluminescence spectrum of the dye coumarin 343, which is incorporated in a reverse micelle suspended in cyclohexanol. The dye’s absorbance spectrum (not shown) has a broad peak around 400 nm. The sharp peak at 409 nm is from the laser source used to excite coumarin 343. The broad band centered at approximately 500 nm is the dye’s emission band. Because the dye absorbs blue light, a solution of coumarin 343 appears yellow in the absence of photoluminescence. Its photoluminescent emission is blue-green. Source: data from Bridget Gourley, Department of Chemistry & Biochemistry, DePauw University).
Contributors
Jim Clark (Chemguide.co.uk)
- Gamini Gunawardena from the OChemPal site (Utah Valley University)