
6.5: Acid-Base Titrations
- Page ID
- 364682

\( \newcommand{\vecs}[1]{\overset { \scriptstyle \rightharpoonup} {\mathbf{#1}} } \)
\( \newcommand{\vecd}[1]{\overset{-\!-\!\rightharpoonup}{\vphantom{a}\smash {#1}}} \)
\( \newcommand{\dsum}{\displaystyle\sum\limits} \)
\( \newcommand{\dint}{\displaystyle\int\limits} \)
\( \newcommand{\dlim}{\displaystyle\lim\limits} \)
\( \newcommand{\id}{\mathrm{id}}\) \( \newcommand{\Span}{\mathrm{span}}\)
( \newcommand{\kernel}{\mathrm{null}\,}\) \( \newcommand{\range}{\mathrm{range}\,}\)
\( \newcommand{\RealPart}{\mathrm{Re}}\) \( \newcommand{\ImaginaryPart}{\mathrm{Im}}\)
\( \newcommand{\Argument}{\mathrm{Arg}}\) \( \newcommand{\norm}[1]{\| #1 \|}\)
\( \newcommand{\inner}[2]{\langle #1, #2 \rangle}\)
\( \newcommand{\Span}{\mathrm{span}}\)
\( \newcommand{\id}{\mathrm{id}}\)
\( \newcommand{\Span}{\mathrm{span}}\)
\( \newcommand{\kernel}{\mathrm{null}\,}\)
\( \newcommand{\range}{\mathrm{range}\,}\)
\( \newcommand{\RealPart}{\mathrm{Re}}\)
\( \newcommand{\ImaginaryPart}{\mathrm{Im}}\)
\( \newcommand{\Argument}{\mathrm{Arg}}\)
\( \newcommand{\norm}[1]{\| #1 \|}\)
\( \newcommand{\inner}[2]{\langle #1, #2 \rangle}\)
\( \newcommand{\Span}{\mathrm{span}}\) \( \newcommand{\AA}{\unicode[.8,0]{x212B}}\)
\( \newcommand{\vectorA}[1]{\vec{#1}} % arrow\)
\( \newcommand{\vectorAt}[1]{\vec{\text{#1}}} % arrow\)
\( \newcommand{\vectorB}[1]{\overset { \scriptstyle \rightharpoonup} {\mathbf{#1}} } \)
\( \newcommand{\vectorC}[1]{\textbf{#1}} \)
\( \newcommand{\vectorD}[1]{\overrightarrow{#1}} \)
\( \newcommand{\vectorDt}[1]{\overrightarrow{\text{#1}}} \)
\( \newcommand{\vectE}[1]{\overset{-\!-\!\rightharpoonup}{\vphantom{a}\smash{\mathbf {#1}}}} \)
\( \newcommand{\vecs}[1]{\overset { \scriptstyle \rightharpoonup} {\mathbf{#1}} } \)
\(\newcommand{\longvect}{\overrightarrow}\)
\( \newcommand{\vecd}[1]{\overset{-\!-\!\rightharpoonup}{\vphantom{a}\smash {#1}}} \)
\(\newcommand{\avec}{\mathbf a}\) \(\newcommand{\bvec}{\mathbf b}\) \(\newcommand{\cvec}{\mathbf c}\) \(\newcommand{\dvec}{\mathbf d}\) \(\newcommand{\dtil}{\widetilde{\mathbf d}}\) \(\newcommand{\evec}{\mathbf e}\) \(\newcommand{\fvec}{\mathbf f}\) \(\newcommand{\nvec}{\mathbf n}\) \(\newcommand{\pvec}{\mathbf p}\) \(\newcommand{\qvec}{\mathbf q}\) \(\newcommand{\svec}{\mathbf s}\) \(\newcommand{\tvec}{\mathbf t}\) \(\newcommand{\uvec}{\mathbf u}\) \(\newcommand{\vvec}{\mathbf v}\) \(\newcommand{\wvec}{\mathbf w}\) \(\newcommand{\xvec}{\mathbf x}\) \(\newcommand{\yvec}{\mathbf y}\) \(\newcommand{\zvec}{\mathbf z}\) \(\newcommand{\rvec}{\mathbf r}\) \(\newcommand{\mvec}{\mathbf m}\) \(\newcommand{\zerovec}{\mathbf 0}\) \(\newcommand{\onevec}{\mathbf 1}\) \(\newcommand{\real}{\mathbb R}\) \(\newcommand{\twovec}[2]{\left[\begin{array}{r}#1 \\ #2 \end{array}\right]}\) \(\newcommand{\ctwovec}[2]{\left[\begin{array}{c}#1 \\ #2 \end{array}\right]}\) \(\newcommand{\threevec}[3]{\left[\begin{array}{r}#1 \\ #2 \\ #3 \end{array}\right]}\) \(\newcommand{\cthreevec}[3]{\left[\begin{array}{c}#1 \\ #2 \\ #3 \end{array}\right]}\) \(\newcommand{\fourvec}[4]{\left[\begin{array}{r}#1 \\ #2 \\ #3 \\ #4 \end{array}\right]}\) \(\newcommand{\cfourvec}[4]{\left[\begin{array}{c}#1 \\ #2 \\ #3 \\ #4 \end{array}\right]}\) \(\newcommand{\fivevec}[5]{\left[\begin{array}{r}#1 \\ #2 \\ #3 \\ #4 \\ #5 \\ \end{array}\right]}\) \(\newcommand{\cfivevec}[5]{\left[\begin{array}{c}#1 \\ #2 \\ #3 \\ #4 \\ #5 \\ \end{array}\right]}\) \(\newcommand{\mattwo}[4]{\left[\begin{array}{rr}#1 \amp #2 \\ #3 \amp #4 \\ \end{array}\right]}\) \(\newcommand{\laspan}[1]{\text{Span}\{#1\}}\) \(\newcommand{\bcal}{\cal B}\) \(\newcommand{\ccal}{\cal C}\) \(\newcommand{\scal}{\cal S}\) \(\newcommand{\wcal}{\cal W}\) \(\newcommand{\ecal}{\cal E}\) \(\newcommand{\coords}[2]{\left\{#1\right\}_{#2}}\) \(\newcommand{\gray}[1]{\color{gray}{#1}}\) \(\newcommand{\lgray}[1]{\color{lightgray}{#1}}\) \(\newcommand{\rank}{\operatorname{rank}}\) \(\newcommand{\row}{\text{Row}}\) \(\newcommand{\col}{\text{Col}}\) \(\renewcommand{\row}{\text{Row}}\) \(\newcommand{\nul}{\text{Nul}}\) \(\newcommand{\var}{\text{Var}}\) \(\newcommand{\corr}{\text{corr}}\) \(\newcommand{\len}[1]{\left|#1\right|}\) \(\newcommand{\bbar}{\overline{\bvec}}\) \(\newcommand{\bhat}{\widehat{\bvec}}\) \(\newcommand{\bperp}{\bvec^\perp}\) \(\newcommand{\xhat}{\widehat{\xvec}}\) \(\newcommand{\vhat}{\widehat{\vvec}}\) \(\newcommand{\uhat}{\widehat{\uvec}}\) \(\newcommand{\what}{\widehat{\wvec}}\) \(\newcommand{\Sighat}{\widehat{\Sigma}}\) \(\newcommand{\lt}{<}\) \(\newcommand{\gt}{>}\) \(\newcommand{\amp}{&}\) \(\definecolor{fillinmathshade}{gray}{0.9}\)- Interpret titration curves for strong and weak acid-base systems
- Compute sample pH at important stages of a titration
- Explain the function of acid-base indicators
As seen in the chapter on the stoichiometry of chemical reactions, titrations can be used to quantitatively analyze solutions for their acid or base concentrations. In this section, we will explore the changes in the concentrations of the acidic and basic species present in a solution during the process of a titration.
Titration Curves
Previously, when we studied acid-base reactions in solution, we focused only on the point at which the acid and base were stoichiometrically equivalent. No consideration was given to the pH of the solution before, during, or after the neutralization. How the pH changes during a titration is governed by the equilibrium reactions that surround the acid(s) and base(s) in the mixture.
The simplest acid-base reactions are those of a strong acid with a strong base. Table \(\PageIndex{1}\) shows data for the titration of a 25.0-mL sample of 0.100 M hydrochloric acid with 0.100 M sodium hydroxide. The values of the pH measured after successive additions of small amounts of NaOH are listed in the first column of this table, and are graphed in Figure \(\PageIndex{1}\), in a form that is called a titration curve. The pH increases slowly at first, increases rapidly in the middle portion of the curve, and then increases slowly again. The point of inflection (located at the midpoint of the vertical part of the curve) is the equivalence point for the titration. It indicates when equivalent quantities of acid and base are present. For the titration of a strong acid with a strong base, the equivalence point occurs at a pH of 7.00 and the points on the titration curve can be calculated using solution stoichiometry (Table \(\PageIndex{1}\) and Figure \(\PageIndex{1}\)).

The titration of a weak acid with a strong base (or of a weak base with a strong acid) is somewhat more complicated than that just discussed, but it follows the same general principles. Let us consider the titration of 25.0 mL of 0.100 M acetic acid (a weak acid) with 0.100 M sodium hydroxide and compare the titration curve with that of the strong acid. Table \(\PageIndex{1}\) gives the pH values during the titration, Figure \(\PageIndex{1b}\) shows the titration curve.
Although the initial volume and molarity of the acids are the same, there are important differences between the two titration curves. The titration curve for the weak acid begins at a higher value (less acidic) and maintains higher pH values up to the equivalence point. This is because acetic acid is a weak acid, which is only partially ionized. The pH at the equivalence point is also higher (8.72 rather than 7.00) due to the hydrolysis of acetate, a weak base that raises the pH:
\[\ce{CH3CO2-}(aq)+\ce{H2O}(l)⇌\ce{CH3CO2H}(l)+\ce{OH-}(aq)\]
After the equivalence point, the two curves are identical because the pH is dependent on the excess of hydroxide ion in both cases.
Acid-Base Indicators
Certain organic substances change color in dilute solution when the hydronium ion concentration reaches a particular value. For example, phenolphthalein is a colorless substance in any aqueous solution with a hydronium ion concentration greater than 5.0 × 10⁻⁹ M (pH < 8.3). In more basic solutions where the hydronium ion concentration is less than 5.0 × 10⁻⁹ M (pH > 8.3), it is red or pink. Substances such as phenolphthalein, which can be used to determine the pH of a solution, are called acid-base indicators. Acid-base indicators are either weak organic acids or weak organic bases.
The equilibrium in a solution of the acid-base indicator methyl orange, a weak acid, can be represented by an equation in which we use \(\ce{HIn}\) as a simple representation for the complex methyl orange molecule:
\[\underbrace{\ce{HIn (aq)}}_{\ce{red}}+\ce{H2O (l)}⇌\ce{H3O^{+} (aq)}+\underbrace{\ce{In^{-} (aq)}}_{\ce{yellow}}\]
\[K_\ce{a}=\ce{\dfrac{[H3O+][In- ]}{[HIn]}}=4.0\times 10^{−4}\]
The anion of methyl orange, \(\ce{In^{-}}\), is yellow, and the nonionized form, \(\ce{HIn}\), is red. When we add acid to a solution of methyl orange, the increased hydronium ion concentration shifts the equilibrium toward the nonionized red form, in accordance with Le Chatelier’s principle. If we add base, we shift the equilibrium towards the yellow form. This behavior is completely analogous to the action of buffers.
An indicator’s color is the visible result of the ratio of the concentrations of the two species In− and \(\ce{HIn}\). If most of the indicator (typically about 60−90% or more) is present as \(\ce{In^{-}}\), then we see the color of the \(\ce{In^{-}}\) ion, which would be yellow for methyl orange. If most is present as \(\ce{HIn}\), then we see the color of the \(\ce{HIn}\) molecule: red for methyl orange. For methyl orange, we can rearrange the equation for Ka and write:
\[\mathrm{\dfrac{[In^-]}{[HIn]}=\dfrac{[substance\: with\: yellow\: color]}{[substance\: with\: red\: color]}=\dfrac{\mathit{K}_a}{[H_3O^+]}} \label{ABeq2}\]
Equation \ref{ABeq2} shows us how the ratio of \(\ce{\dfrac{[In- ]}{[HIn]}}\) varies with the concentration of hydronium ion. The above expression describing the indicator equilibrium can be rearranged:
\[ \begin{align} \dfrac{[H_3O^+]}{\mathit{K}_a} &=\dfrac{[HIn]}{[In^- ]} \\[8pt] \log\left(\dfrac{[H_3O^+]}{\mathit{K}_a}\right) &= \log\left(\dfrac{[HIn]}{[In^- ]}\right) \\[8pt] \log([H_3O^+])-\log(\mathit{K}_a) &=-\log\left(\dfrac{[In^-]}{[HIn]}\right) \\[8pt] -pH+p\mathit{K}_a & =-\log\left(\dfrac{[In^-]}{[HIn]}\right) \\[8pt] pH &=p\mathit{K}_a+\log\left(\dfrac{[In^-]}{[HIn]}\right) \end {align}\]
or in general terms
\[pH=p\mathit{K}_a+\log\left(\dfrac{[base]}{[acid]}\right) \label{HHeq} \]
Equation \ref{HHeq} is the same as the Henderson-Hasselbalch equation, which can be used to describe the equilibrium of indicators.
When [H3O+] has the same numerical value as Ka, the ratio of [In−] to [HIn] is equal to 1, meaning that 50% of the indicator is present in the red form (HIn) and 50% is in the yellow ionic form (In−), and the solution appears orange in color. When the hydronium ion concentration increases to 8 × 10⁻⁴ M (a pH of 3.1), the solution turns red. No change in color is visible for any further increase in the hydronium ion concentration (decrease in pH). At a hydronium ion concentration of 4 × 10⁻⁵ M (a pH of 4.4), most of the indicator is in the yellow ionic form, and a further decrease in the hydronium ion concentration (increase in pH) does not produce a visible color change. The pH range between 3.1 (red) and 4.4 (yellow) is the color-change interval of methyl orange; the pronounced color change takes place between these pH values.
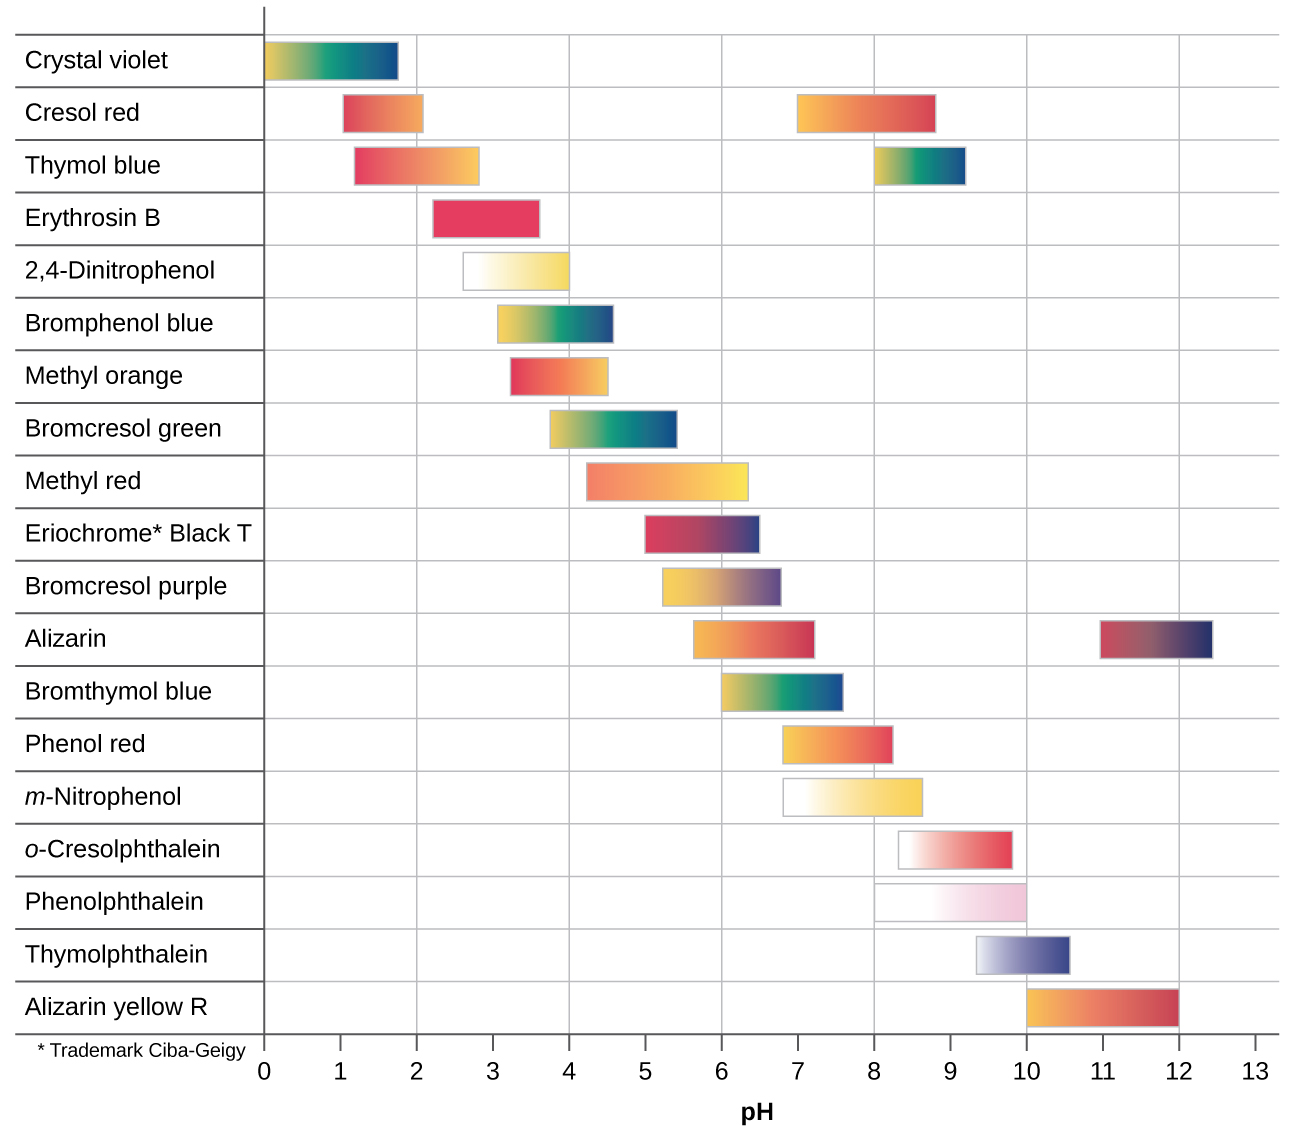
There are many different acid-base indicators that cover a wide range of pH values and can be used to determine the approximate pH of an unknown solution by a process of elimination. Universal indicators and pH paper contain a mixture of indicators and exhibit different colors at different pHs. Figure \(\PageIndex{2}\) presents several indicators, their colors, and their color-change intervals.
Titration curves help us pick an indicator that will provide a sharp color change at the equivalence point. The best selection would be an indicator that has a color change interval that brackets the pH at the equivalence point of the titration.
The color change intervals of three indicators are shown in Figure \(\PageIndex{3}\). The equivalence points of both the titration of the strong acid and of the weak acid are located in the color-change interval of phenolphthalein. We can use it for titrations of either strong acid with strong base or weak acid with strong base.
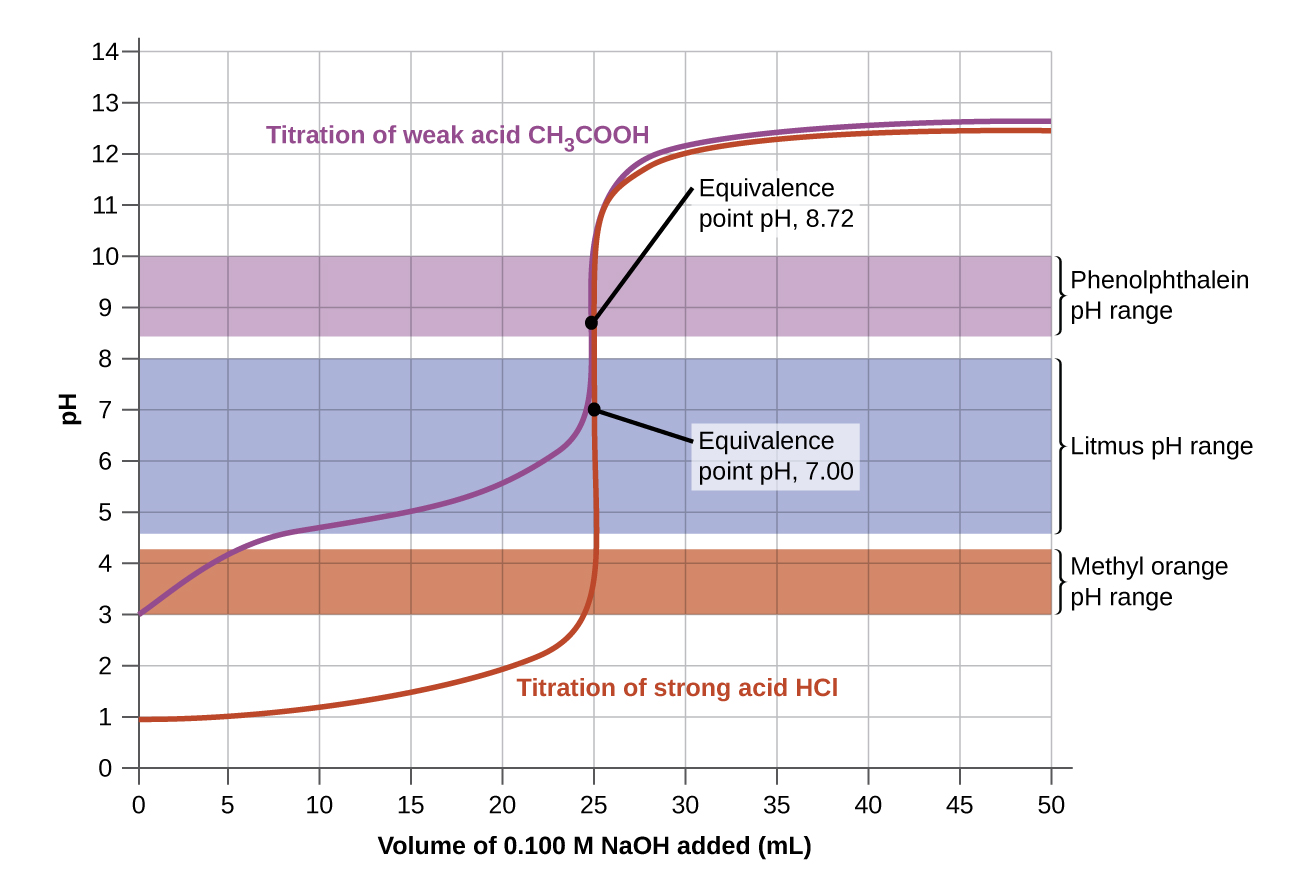
Litmus is a suitable indicator for the HCl titration because its color change brackets the equivalence point. However, we should not use litmus for the CH3CO2H titration because the pH is within the color-change interval of litmus when only about 12 mL of NaOH has been added, and it does not leave the range until 25 mL has been added. The color change would be very gradual, taking place during the addition of 13 mL of NaOH, making litmus useless as an indicator of the equivalence point.
We could use methyl orange for the HCl titration, but it would not give very accurate results: (1) It completes its color change slightly before the equivalence point is reached (but very close to it, so this is not too serious); (2) it changes color, as Figure \(\PageIndex{2}\) demonstrates, during the addition of nearly 0.5 mL of NaOH, which is not so sharp a color change as that of litmus or phenolphthalein; and (3) it goes from yellow to orange to red, making detection of a precise endpoint much more challenging than the colorless to pink change of phenolphthalein. Figure \(\PageIndex{2}\) shows us that methyl orange would be completely useless as an indicator for the CH3CO2H titration. Its color change begins after about 1 mL of NaOH has been added and ends when about 8 mL has been added. The color change is completed long before the equivalence point (which occurs when 25.0 mL of NaOH has been added) is reached and hence provides no indication of the equivalence point.
We base our choice of indicator on a calculated pH, the pH at the equivalence point. At the equivalence point, equimolar amounts of acid and base have been mixed, and the calculation becomes that of the pH of a solution of the salt resulting from the titration.
Summary
A titration curve is a graph that relates the change in pH of an acidic or basic solution to the volume of added titrant. The characteristics of the titration curve are dependent on the specific solutions being titrated. The pH of the solution at the equivalence point may be greater than, equal to, or less than 7.00. The choice of an indicator for a given titration depends on the expected pH at the equivalence point of the titration, and the range of the color change of the indicator.
Glossary
- acid-base indicator
- organic acid or base whose color changes depending on the pH of the solution it is in
- color-change interval
- range in pH over which the color change of an indicator takes place
- titration curve
- plot of the pH of a solution of acid or base versus the volume of base or acid added during a titration