5.5: Ultraviolet and visible spectroscopy
- Page ID
- 227573
\( \newcommand{\vecs}[1]{\overset { \scriptstyle \rightharpoonup} {\mathbf{#1}} } \)
\( \newcommand{\vecd}[1]{\overset{-\!-\!\rightharpoonup}{\vphantom{a}\smash {#1}}} \)
\( \newcommand{\id}{\mathrm{id}}\) \( \newcommand{\Span}{\mathrm{span}}\)
( \newcommand{\kernel}{\mathrm{null}\,}\) \( \newcommand{\range}{\mathrm{range}\,}\)
\( \newcommand{\RealPart}{\mathrm{Re}}\) \( \newcommand{\ImaginaryPart}{\mathrm{Im}}\)
\( \newcommand{\Argument}{\mathrm{Arg}}\) \( \newcommand{\norm}[1]{\| #1 \|}\)
\( \newcommand{\inner}[2]{\langle #1, #2 \rangle}\)
\( \newcommand{\Span}{\mathrm{span}}\)
\( \newcommand{\id}{\mathrm{id}}\)
\( \newcommand{\Span}{\mathrm{span}}\)
\( \newcommand{\kernel}{\mathrm{null}\,}\)
\( \newcommand{\range}{\mathrm{range}\,}\)
\( \newcommand{\RealPart}{\mathrm{Re}}\)
\( \newcommand{\ImaginaryPart}{\mathrm{Im}}\)
\( \newcommand{\Argument}{\mathrm{Arg}}\)
\( \newcommand{\norm}[1]{\| #1 \|}\)
\( \newcommand{\inner}[2]{\langle #1, #2 \rangle}\)
\( \newcommand{\Span}{\mathrm{span}}\) \( \newcommand{\AA}{\unicode[.8,0]{x212B}}\)
\( \newcommand{\vectorA}[1]{\vec{#1}} % arrow\)
\( \newcommand{\vectorAt}[1]{\vec{\text{#1}}} % arrow\)
\( \newcommand{\vectorB}[1]{\overset { \scriptstyle \rightharpoonup} {\mathbf{#1}} } \)
\( \newcommand{\vectorC}[1]{\textbf{#1}} \)
\( \newcommand{\vectorD}[1]{\overrightarrow{#1}} \)
\( \newcommand{\vectorDt}[1]{\overrightarrow{\text{#1}}} \)
\( \newcommand{\vectE}[1]{\overset{-\!-\!\rightharpoonup}{\vphantom{a}\smash{\mathbf {#1}}}} \)
\( \newcommand{\vecs}[1]{\overset { \scriptstyle \rightharpoonup} {\mathbf{#1}} } \)
\( \newcommand{\vecd}[1]{\overset{-\!-\!\rightharpoonup}{\vphantom{a}\smash {#1}}} \)
\(\newcommand{\avec}{\mathbf a}\) \(\newcommand{\bvec}{\mathbf b}\) \(\newcommand{\cvec}{\mathbf c}\) \(\newcommand{\dvec}{\mathbf d}\) \(\newcommand{\dtil}{\widetilde{\mathbf d}}\) \(\newcommand{\evec}{\mathbf e}\) \(\newcommand{\fvec}{\mathbf f}\) \(\newcommand{\nvec}{\mathbf n}\) \(\newcommand{\pvec}{\mathbf p}\) \(\newcommand{\qvec}{\mathbf q}\) \(\newcommand{\svec}{\mathbf s}\) \(\newcommand{\tvec}{\mathbf t}\) \(\newcommand{\uvec}{\mathbf u}\) \(\newcommand{\vvec}{\mathbf v}\) \(\newcommand{\wvec}{\mathbf w}\) \(\newcommand{\xvec}{\mathbf x}\) \(\newcommand{\yvec}{\mathbf y}\) \(\newcommand{\zvec}{\mathbf z}\) \(\newcommand{\rvec}{\mathbf r}\) \(\newcommand{\mvec}{\mathbf m}\) \(\newcommand{\zerovec}{\mathbf 0}\) \(\newcommand{\onevec}{\mathbf 1}\) \(\newcommand{\real}{\mathbb R}\) \(\newcommand{\twovec}[2]{\left[\begin{array}{r}#1 \\ #2 \end{array}\right]}\) \(\newcommand{\ctwovec}[2]{\left[\begin{array}{c}#1 \\ #2 \end{array}\right]}\) \(\newcommand{\threevec}[3]{\left[\begin{array}{r}#1 \\ #2 \\ #3 \end{array}\right]}\) \(\newcommand{\cthreevec}[3]{\left[\begin{array}{c}#1 \\ #2 \\ #3 \end{array}\right]}\) \(\newcommand{\fourvec}[4]{\left[\begin{array}{r}#1 \\ #2 \\ #3 \\ #4 \end{array}\right]}\) \(\newcommand{\cfourvec}[4]{\left[\begin{array}{c}#1 \\ #2 \\ #3 \\ #4 \end{array}\right]}\) \(\newcommand{\fivevec}[5]{\left[\begin{array}{r}#1 \\ #2 \\ #3 \\ #4 \\ #5 \\ \end{array}\right]}\) \(\newcommand{\cfivevec}[5]{\left[\begin{array}{c}#1 \\ #2 \\ #3 \\ #4 \\ #5 \\ \end{array}\right]}\) \(\newcommand{\mattwo}[4]{\left[\begin{array}{rr}#1 \amp #2 \\ #3 \amp #4 \\ \end{array}\right]}\) \(\newcommand{\laspan}[1]{\text{Span}\{#1\}}\) \(\newcommand{\bcal}{\cal B}\) \(\newcommand{\ccal}{\cal C}\) \(\newcommand{\scal}{\cal S}\) \(\newcommand{\wcal}{\cal W}\) \(\newcommand{\ecal}{\cal E}\) \(\newcommand{\coords}[2]{\left\{#1\right\}_{#2}}\) \(\newcommand{\gray}[1]{\color{gray}{#1}}\) \(\newcommand{\lgray}[1]{\color{lightgray}{#1}}\) \(\newcommand{\rank}{\operatorname{rank}}\) \(\newcommand{\row}{\text{Row}}\) \(\newcommand{\col}{\text{Col}}\) \(\renewcommand{\row}{\text{Row}}\) \(\newcommand{\nul}{\text{Nul}}\) \(\newcommand{\var}{\text{Var}}\) \(\newcommand{\corr}{\text{corr}}\) \(\newcommand{\len}[1]{\left|#1\right|}\) \(\newcommand{\bbar}{\overline{\bvec}}\) \(\newcommand{\bhat}{\widehat{\bvec}}\) \(\newcommand{\bperp}{\bvec^\perp}\) \(\newcommand{\xhat}{\widehat{\xvec}}\) \(\newcommand{\vhat}{\widehat{\vvec}}\) \(\newcommand{\uhat}{\widehat{\uvec}}\) \(\newcommand{\what}{\widehat{\wvec}}\) \(\newcommand{\Sighat}{\widehat{\Sigma}}\) \(\newcommand{\lt}{<}\) \(\newcommand{\gt}{>}\) \(\newcommand{\amp}{&}\) \(\definecolor{fillinmathshade}{gray}{0.9}\)While interaction with infrared light causes molecules to undergo vibrational transitions, the shorter wavelength, higher energy radiation in the UV (200-400 nm) and visible (400-700 nm) range of the electromagnetic spectrum causes many organic molecules to undergo electronic transitions. What this means is that when the energy from UV or visible light is absorbed by a molecule, one of its electrons jumps from a lower energy to a higher energy molecular orbital.
Electronic transitions
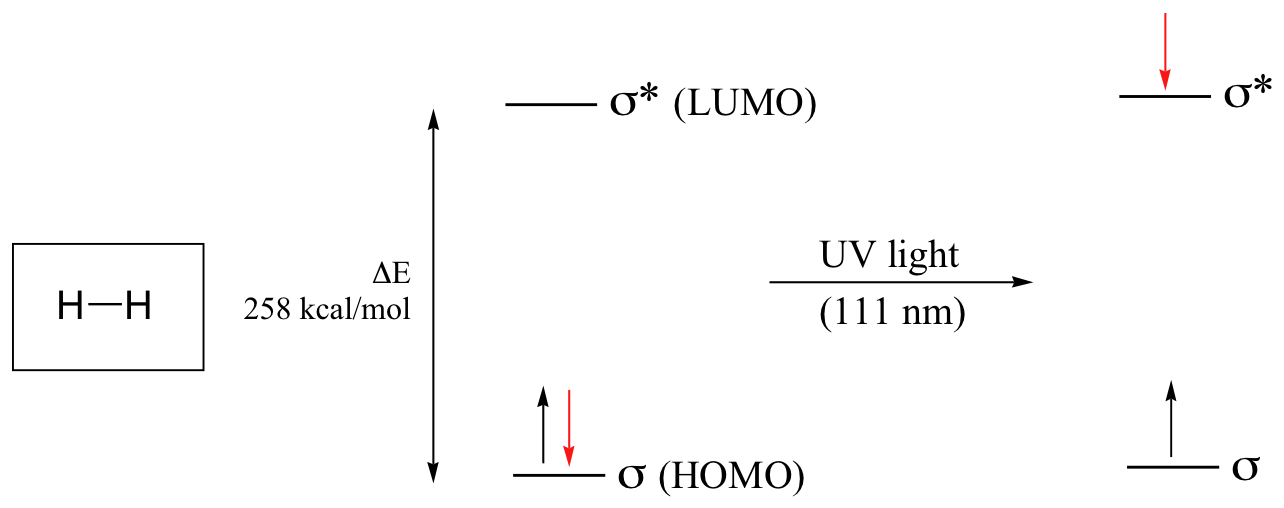
As you may recall from CHE 103, electrons in atoms are occupying atomic orbitals. Analogously, electrons in a molecule are occupying molecular orbitas. These orbitals are called HOMO ( Highest Occupied Molecular Orbital ) and LUMO (Lowest Unoccupied Molecular Orbital). In molecules, electrons can transition from HOMO to LUMO:

If the molecule is exposed to light of a wavelength with energy equal to ΔE, the HOMO-LUMO energy gap, this wavelength will be absorbed and the energy used to bump one of the electrons from the HOMO to the LUMO . For some molecules, these electron transitions occur in the UV-visible region of the electromagnetic spectrum. Molecules or parts of molecules that absorb light strongly in the UV-vis region are called chromophores. These electronic transitions Where UV-vis spectroscopy becomes useful to most organic and biological chemists is in the study of molecules with conjugated \(\pi\) systems.
In molecules with extended pi systems, the HOMO-LUMO energy gap becomes so small that absorption occurs in the visible rather then the UV region of the electromagnetic spectrum. Beta-carotene, with its system of 11 conjugated double bonds, absorbs light with wavelengths in the blue region of the visible spectrum while allowing other visible wavelengths – mainly those in the red-yellow region - to be transmitted. This is why carrots are orange.

Exercise 4.9: What is the energy of the photons (in kJ/mol) of light with wavelength of 470 nm, the lmax of b-carotene?
Exercise 4.10: Which of the following molecules would you expect absorb at a longer wavelength in the UV region of the electromagnetic spectrum? Explain your answer.

Protecting yourself from sunburn
Human skin can be damaged by exposure to ultraviolet light from the sun. We naturally produce a pigment, called melanin, which protects the skin by absorbing much of the ultraviolet radiation. Melanin is a complex polymer, two of the most common monomers units of which are shown below.

Overexposure to the sun is still dangerous, because there is a limit to how much radiation our melanin can absorb. Most commercial sunscreens claim to offer additional protection from both UV-A and UV-B radiation: UV-A refers to wavelengths between 315-400 nm, UV-B to shorter, more harmful wavelengths between 280-315 nm. PABA (para-aminobenzoic acid) was used in sunscreens in the past, but its relatively high polarity meant that it was not very soluble in oily lotions, and it tended to rinse away when swimming. Many sunscreens today contain, among other active ingredients, a more hydrophobic derivative of PABA called Padimate O.
Looking at UV-vis spectra
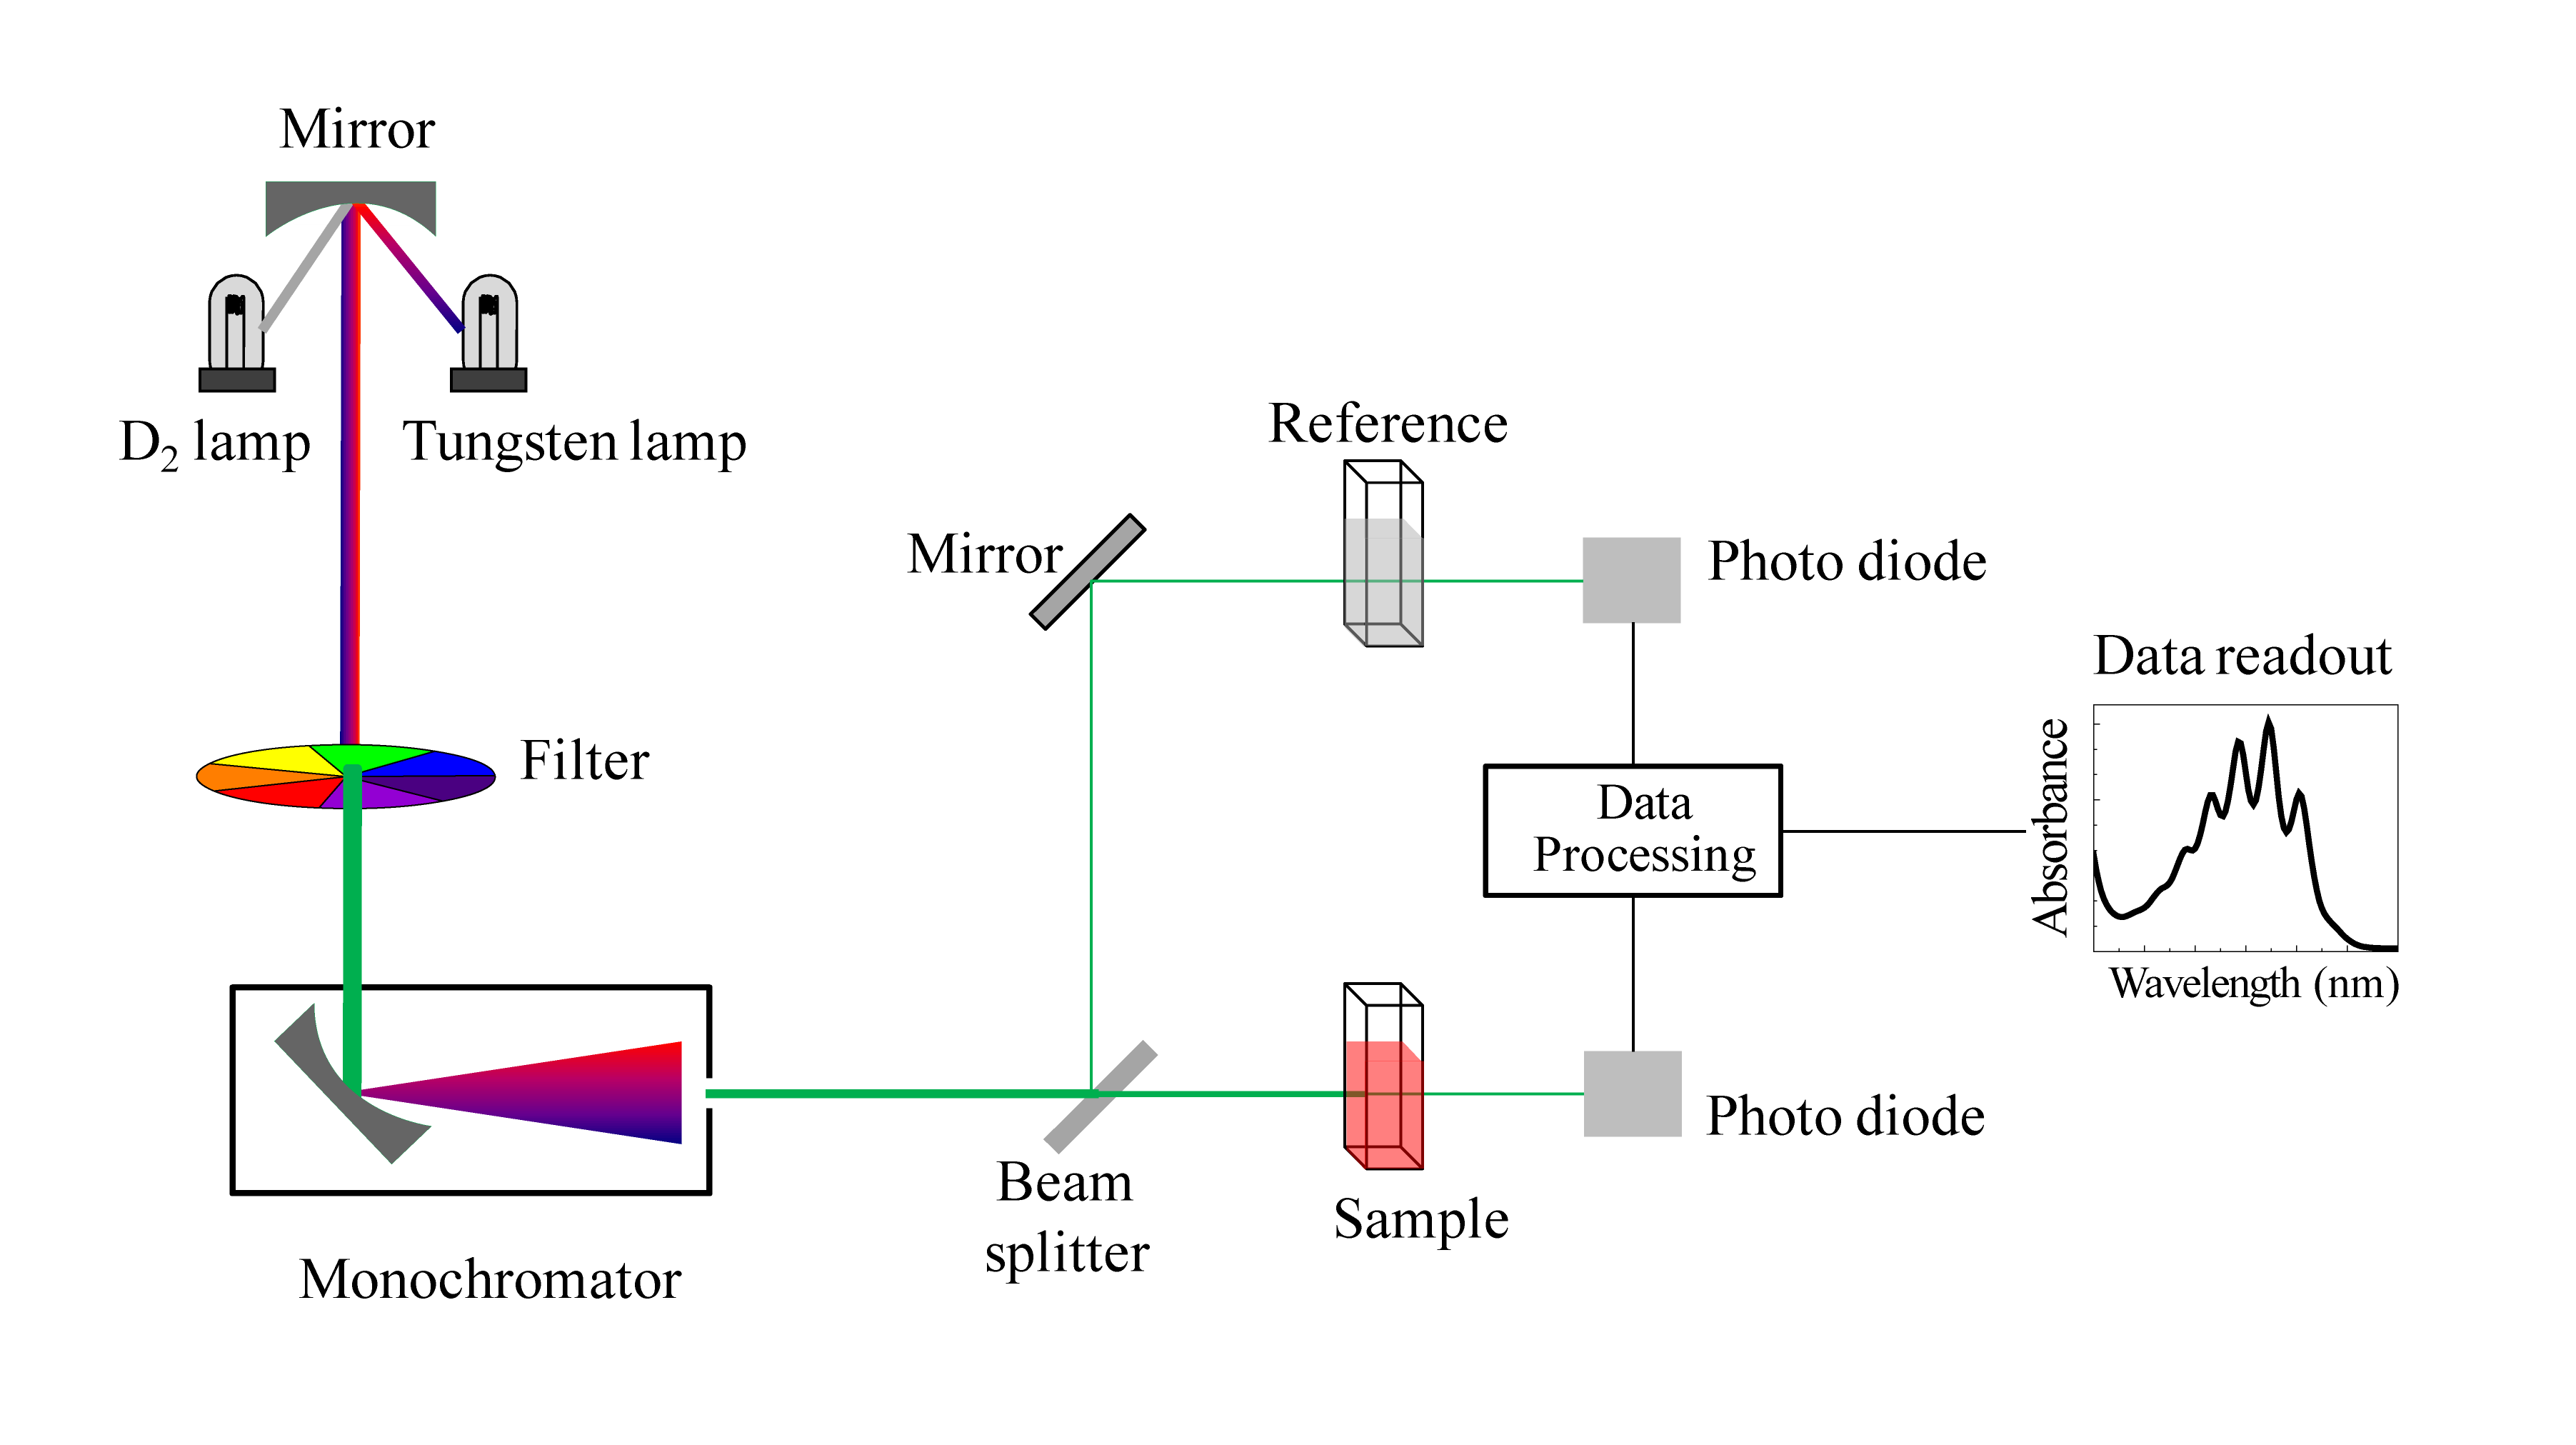
We have been talking in general terms about how molecules absorb UV and visible light – now let's look at some actual examples of data from a UV-vis absorbance spectrophotometer. The basic setup is the same as for IR spectroscopy: radiation with a range of wavelengths is directed through a sample of interest, and a detector records which wavelengths were absorbed and to what extent the absorption occurred.
 Schematic for a UV-Vis spectrophotometer
(Image from Wikipedia Commons)
Below is the absorbance spectrum of an important biological molecule called nicotinamide adenine dinucleotide, abbreviated NAD+. This compound absorbs light in the UV range due to the presence of conjugated pi-bonding systems.

Wavelength values on the x-axis are generally measured in nanometers (nm). Peaks in UV spectra tend to be quite broad, often spanning well over 20 nm at half-maximal height. Typically, there are two things that we look for and record from a UV-Vis spectrum. The first is \(\lambda_{max}\), which is the wavelength at maximal light absorbance. As you can see, NAD+ has \(\lambda_{max} = 260\;nm\). We also want to record how much light is absorbed at \(\lambda_{max}\). Here we use a unitless number called absorbance, abbreviated 'A'. To calculate absorbance at a given wavelength, the computer in the spectrophotometer simply takes the intensity of light at that wavelength before it passes through the sample (I0), divides this value by the intensity of the same wavelength after it passes through the sample (I), then takes the log10 of that number:
\[A = \log \dfrac{I_0}{I} \tag{4.3.1}\]
You can see that the absorbance value at 260 nm (A260) is about 1.0 in this spectrum.
Exercise 4.11: Express A = 1.0 in terms of percent transmittance (%T, the unit usually used in IR spectroscopy (and sometimes in UV-vis as well).
Kahn Academy video tutorials on UV-Vis spectroscopy
Contributors
Organic Chemistry With a Biological Emphasis by Tim Soderberg (University of Minnesota, Morris)


