
13.5: Problems
- Page ID
- 220778

\( \newcommand{\vecs}[1]{\overset { \scriptstyle \rightharpoonup} {\mathbf{#1}} } \)
\( \newcommand{\vecd}[1]{\overset{-\!-\!\rightharpoonup}{\vphantom{a}\smash {#1}}} \)
\( \newcommand{\id}{\mathrm{id}}\) \( \newcommand{\Span}{\mathrm{span}}\)
( \newcommand{\kernel}{\mathrm{null}\,}\) \( \newcommand{\range}{\mathrm{range}\,}\)
\( \newcommand{\RealPart}{\mathrm{Re}}\) \( \newcommand{\ImaginaryPart}{\mathrm{Im}}\)
\( \newcommand{\Argument}{\mathrm{Arg}}\) \( \newcommand{\norm}[1]{\| #1 \|}\)
\( \newcommand{\inner}[2]{\langle #1, #2 \rangle}\)
\( \newcommand{\Span}{\mathrm{span}}\)
\( \newcommand{\id}{\mathrm{id}}\)
\( \newcommand{\Span}{\mathrm{span}}\)
\( \newcommand{\kernel}{\mathrm{null}\,}\)
\( \newcommand{\range}{\mathrm{range}\,}\)
\( \newcommand{\RealPart}{\mathrm{Re}}\)
\( \newcommand{\ImaginaryPart}{\mathrm{Im}}\)
\( \newcommand{\Argument}{\mathrm{Arg}}\)
\( \newcommand{\norm}[1]{\| #1 \|}\)
\( \newcommand{\inner}[2]{\langle #1, #2 \rangle}\)
\( \newcommand{\Span}{\mathrm{span}}\) \( \newcommand{\AA}{\unicode[.8,0]{x212B}}\)
\( \newcommand{\vectorA}[1]{\vec{#1}} % arrow\)
\( \newcommand{\vectorAt}[1]{\vec{\text{#1}}} % arrow\)
\( \newcommand{\vectorB}[1]{\overset { \scriptstyle \rightharpoonup} {\mathbf{#1}} } \)
\( \newcommand{\vectorC}[1]{\textbf{#1}} \)
\( \newcommand{\vectorD}[1]{\overrightarrow{#1}} \)
\( \newcommand{\vectorDt}[1]{\overrightarrow{\text{#1}}} \)
\( \newcommand{\vectE}[1]{\overset{-\!-\!\rightharpoonup}{\vphantom{a}\smash{\mathbf {#1}}}} \)
\( \newcommand{\vecs}[1]{\overset { \scriptstyle \rightharpoonup} {\mathbf{#1}} } \)
\( \newcommand{\vecd}[1]{\overset{-\!-\!\rightharpoonup}{\vphantom{a}\smash {#1}}} \)
\(\newcommand{\avec}{\mathbf a}\) \(\newcommand{\bvec}{\mathbf b}\) \(\newcommand{\cvec}{\mathbf c}\) \(\newcommand{\dvec}{\mathbf d}\) \(\newcommand{\dtil}{\widetilde{\mathbf d}}\) \(\newcommand{\evec}{\mathbf e}\) \(\newcommand{\fvec}{\mathbf f}\) \(\newcommand{\nvec}{\mathbf n}\) \(\newcommand{\pvec}{\mathbf p}\) \(\newcommand{\qvec}{\mathbf q}\) \(\newcommand{\svec}{\mathbf s}\) \(\newcommand{\tvec}{\mathbf t}\) \(\newcommand{\uvec}{\mathbf u}\) \(\newcommand{\vvec}{\mathbf v}\) \(\newcommand{\wvec}{\mathbf w}\) \(\newcommand{\xvec}{\mathbf x}\) \(\newcommand{\yvec}{\mathbf y}\) \(\newcommand{\zvec}{\mathbf z}\) \(\newcommand{\rvec}{\mathbf r}\) \(\newcommand{\mvec}{\mathbf m}\) \(\newcommand{\zerovec}{\mathbf 0}\) \(\newcommand{\onevec}{\mathbf 1}\) \(\newcommand{\real}{\mathbb R}\) \(\newcommand{\twovec}[2]{\left[\begin{array}{r}#1 \\ #2 \end{array}\right]}\) \(\newcommand{\ctwovec}[2]{\left[\begin{array}{c}#1 \\ #2 \end{array}\right]}\) \(\newcommand{\threevec}[3]{\left[\begin{array}{r}#1 \\ #2 \\ #3 \end{array}\right]}\) \(\newcommand{\cthreevec}[3]{\left[\begin{array}{c}#1 \\ #2 \\ #3 \end{array}\right]}\) \(\newcommand{\fourvec}[4]{\left[\begin{array}{r}#1 \\ #2 \\ #3 \\ #4 \end{array}\right]}\) \(\newcommand{\cfourvec}[4]{\left[\begin{array}{c}#1 \\ #2 \\ #3 \\ #4 \end{array}\right]}\) \(\newcommand{\fivevec}[5]{\left[\begin{array}{r}#1 \\ #2 \\ #3 \\ #4 \\ #5 \\ \end{array}\right]}\) \(\newcommand{\cfivevec}[5]{\left[\begin{array}{c}#1 \\ #2 \\ #3 \\ #4 \\ #5 \\ \end{array}\right]}\) \(\newcommand{\mattwo}[4]{\left[\begin{array}{rr}#1 \amp #2 \\ #3 \amp #4 \\ \end{array}\right]}\) \(\newcommand{\laspan}[1]{\text{Span}\{#1\}}\) \(\newcommand{\bcal}{\cal B}\) \(\newcommand{\ccal}{\cal C}\) \(\newcommand{\scal}{\cal S}\) \(\newcommand{\wcal}{\cal W}\) \(\newcommand{\ecal}{\cal E}\) \(\newcommand{\coords}[2]{\left\{#1\right\}_{#2}}\) \(\newcommand{\gray}[1]{\color{gray}{#1}}\) \(\newcommand{\lgray}[1]{\color{lightgray}{#1}}\) \(\newcommand{\rank}{\operatorname{rank}}\) \(\newcommand{\row}{\text{Row}}\) \(\newcommand{\col}{\text{Col}}\) \(\renewcommand{\row}{\text{Row}}\) \(\newcommand{\nul}{\text{Nul}}\) \(\newcommand{\var}{\text{Var}}\) \(\newcommand{\corr}{\text{corr}}\) \(\newcommand{\len}[1]{\left|#1\right|}\) \(\newcommand{\bbar}{\overline{\bvec}}\) \(\newcommand{\bhat}{\widehat{\bvec}}\) \(\newcommand{\bperp}{\bvec^\perp}\) \(\newcommand{\xhat}{\widehat{\xvec}}\) \(\newcommand{\vhat}{\widehat{\vvec}}\) \(\newcommand{\uhat}{\widehat{\uvec}}\) \(\newcommand{\what}{\widehat{\wvec}}\) \(\newcommand{\Sighat}{\widehat{\Sigma}}\) \(\newcommand{\lt}{<}\) \(\newcommand{\gt}{>}\) \(\newcommand{\amp}{&}\) \(\definecolor{fillinmathshade}{gray}{0.9}\)1. Equation 13.2.18 shows how [A]0 is determined using a two-point fixed-time integral method in which the concentration of A for the pseudo-first-order reaction
\[A+R \longrightarrow P \nonumber\]
is measured at times t1 and t2. Derive a similar equation for the case where the product is monitored under pseudo-first order conditions.
2. The concentration of phenylacetate is determined from the kinetics of its pseudo-first order hydrolysis reaction in an ethylamine buffer. When a standard solution of 0.55 mM phenylacetate is analyzed, the concentration of phenylacetate after 60 s is 0.17 mM. When a sample is analyzed the concentration of phenylacetate that remains after 60 s is 0.23 mM. What is the concentration of phenylacetate in the sample?
3. In the presence of acid, iodide is oxidized by hydrogen peroxide
\[2 \mathrm{I}^{-}(a q)+\mathrm{H}_{2} \mathrm{O}_{2}(a q)+2 \mathrm{H}_{3} \mathrm{O}^{+}(a q) \longrightarrow 4 \mathrm{H}_{2} \mathrm{O}(l)+\mathrm{I}_{2}(a q) \nonumber\]
When I– and H3O+ are present in excess, we can use the reaction’s kinetics of the reaction, which is pseudo-first order in H2O2, to determine the concentration of H2O2 by following the production of I2 with time. In one analysis the solution’s absorbance at 348 nm was measured after 240 s. Analysis of a set of standard gives the results shown below.
| [H2O2] (µM) | absorbance |
|---|---|
| 100.0 | 0.236 |
| 200.0 | 0.471 |
| 400.0 | 0.933 |
| 800.0 | 1.872 |
What is the concentration of H2O2 in a sample if its absorbance is 0.669 after 240 s?
4. The concentration of chromic acid is determined by reducing it under conditions that are pseudo-first order in analyte. One approach is to monitor the reaction absorbance at a wavelength of 355 nm. A standard of \(5.1 \times 10^{-4}\) M chromic acid yields absorbances of 0.855 and 0.709 at 100 s and 300 s after the reaction’s initiation. When a sample is analyzed under identical conditions, the absorbances are 0.883 and 0.706. What is the concentration of chromic acid in the sample?
5. Malmstadt and Pardue developed a variable time method for the determination of glucose based on its oxidation by the enzyme glucose oxidase [Malmstadt, H. V.; Pardue, H. L. Anal. Chem. 1961 33, 1040–1047]. To monitor the reaction’s progress, iodide is added to the samples and standards. The H2O2 produced by the oxidation of glucose reacts with I–, forming I2 as a product. The time required to produce a fixed amount of I2 is determined spectrophotometrically. The following data was reported for a set of calibration standards
| [glucose] (ppm) | time (s) | ||
|---|---|---|---|
| 5.0 | 146.5 | 150.0 |
149.6 |
| 10.0 | 69.2 | 67.1 |
66.0 |
| 20.0 | 34.8 | 35.0 |
34.0 |
| 30.0 | 22.3 | 22.7 |
22.6 |
| 40.0 | 16.7 | 16.5 | 17.0 |
| 50.0 | 13.3 | 13.3 | 13.8 |
To verify the method a standard solution of 20.0 ppm glucose was analyzed in the same way as the standards, requiring 34.6 s to produce the same extent of reaction. Determine the concentration of glucose in the standard and the percent error for the analysis.
6. Deming and Pardue studied the kinetics for the hydrolysis of p-nitrophenyl phosphate by the enzyme alkaline phosphatase [Deming, S. N.; Pardue, H. L. Anal. Chem. 1971, 43, 192–200]. The reaction’s progress was monitored by measuring the absorbance of p-nitrophenol, which is one of the reaction’s products. A plot of the reaction’s rate (with units of μmol mL–1 sec–1) versus the volume, V, in milliliters of a serum calibration standard that contained the enzyme, yielded a straight line with the following equation.
\[\text { rate } = 2.7 \times 10^{-7} \mu \text{mol } \mathrm{mL}^{-1} \text{ s}^{-1}+\left(3.485 \times 10^{-5} \mu \text{mol } \mathrm{mL}^{-2} \text{ s}^{-1}\right) V \nonumber\]
A 10.00-mL sample of serum is analyzed, yielding a rate of \(6.84 \times 10^{-5}\) μmol mL–1 sec–1. How much more dilute is the enzyme in the serum sample than in the serum calibration standard?
7. The following data were collected for a reaction known to be pseudo-first order in analyte, A, during the time in which the reaction is monitored.
| time (s) | [A]t (mM) |
|---|---|
| 2 |
1.36 |
| 4 |
1.24 |
| 6 |
1.12 |
| 8 |
1.02 |
| 10 | 0.924 |
| 12 | 0.838 |
| 14 | 0.760 |
| 16 | 0.690 |
| 18 | 0.626 |
| 20 | 0.568 |
What is the rate constant and the initial concentration of analyte in the sample?
8. The enzyme acetylcholinesterase catalyzes the decomposition of acetylcholine to choline and acetic acid. Under a given set of conditions the enzyme has a Km of \(9 \times 10^{-5}\) M and a k2 of \(1.4 \times 10^4\) s–1. What is the concentration of acetylcholine in a sample if the reaction’s rate is 12.33 μM s–1 in the presence of \(6.61 \times 10^{-7}\) M enzyme? You may assume the concentration of acetylcholine is significantly smaller than Km.
9. The enzyme fumarase catalyzes the stereospecific addition of water to fumarate to form l-malate. A standard 0.150 μM solution of fumarase has a rate of reaction of 2.00 μM min–1 under conditions in which the substrate’s concentration is significantly greater than Km. The rate of reaction for a sample under identical condition is 1.15 mM min–1. What is the concentration of fumarase in the sample?
10. The enzyme urease catalyzes the hydrolysis of urea. The rate of this reaction is determined for a series of solutions in which the concentration of urea is changed while maintaining a fixed urease concentration of 5.0 mM. The following data are obtained.
| [urea] (µM) | rate (µM s–1) |
|---|---|
|
0.100 |
6.25 |
| 0.200 | 12.5 |
| 0.300 | 18.8 |
| 0.400 | 25.0 |
| 0.500 | 31.2 |
| 0.600 | 37.5 |
| 0.700 | 43.7 |
| 0.800 | 50.0 |
| 0.900 | 56.2 |
| 1.00 | 62.5 |
Determine the values of Vmax, k2, and Km for urease.
11. To study the effect of an enzyme inhibitor Vmax and Km are measured for several concentrations of inhibitor. As the concentration of the inhibitor increases Vmax remains essentially constant, but the value of Km increases. Which mechanism for enzyme inhibition is in effect?
12. In the case of competitive inhibition, the equilibrium between the enzyme, E, the inhibitor, I, and the enzyme–inhibitor complex, EI, is described by the equilibrium constant KEI. Show that for competitive inhibition the equation for the rate of reaction is
\[\frac{d[P]}{d t}=\frac{V_{\max }[S]}{K_{m}\left\{1+\left([I] / K_{E l}\right)\right\}+[S]} \nonumber\]
where KI is the formation constant for the EI complex
\[E+I \rightleftharpoons E I \nonumber\]
You may assume that k2 << k–1.
13. Analytes A and B react with a common reagent R with first-order kinetics. If 99.9% of A must react before 0.1% of B has reacted, what is the minimum acceptable ratio for their respective rate constants?
14. A mixture of two analytes, A and B, is analyzed simultaneously by monitoring their combined concentration, C = [A] + [B], as a function of time when they react with a common reagent. Both A and B are known to follow first-order kinetics with the reagent, and A is known to react faster than B. Given the data in the following table, determine the initial concentrations of A and B, and the first-order rate constants, kA and kB.
| time (min) | [C] (mM) |
|---|---|
| 1 | 0.313 |
| 6 | 0.200 |
| 11 | 0.136 |
| 16 | 0.098 |
| 21 | 0.074 |
| 26 | 0.058 |
| 31 | 0.047 |
| 36 | 0.038 |
| 41 | 0.032 |
| 46 | 0.027 |
| 51 | 0.023 |
| 56 | 0.019 |
| 61 | 0.016 |
| 66 | 0.014 |
| 71 | 0.012 |
15. Table 13.3.1 provides a list of several isotopes used as tracers. The half-lives for these isotopes also are listed. What is the rate constant for the radioactive decay of each isotope?
16. 60Co is a long-lived isotope (t1/2 = 5.3 yr) frequently used as a radiotracer. The activity in a 5.00-mL sample of a solution of 60Co is \(2.1 \times 10^7\) disintegrations/sec. What is the molar concentration of 60Co in the sample?
17. The concentration of Ni in a new alloy is determined by a neutron activation analysis. A 0.500-g sample of the alloy and a 1.000-g sample of a standard alloy that is 5.93% w/w Ni are irradiated with neutrons in a nuclear reactor. When irradiation is complete, the sample and the standard are allowed to cool and their gamma ray activities measured. Given that the activity is 1020 cpm for the sample and 3540 cpm for the standard, determine the %w/w Ni in the alloy.
18. The vitamin B12 content of a multivitamin tablet is determined by the following procedure. A sample of 10 tablets is dissolved in water and diluted to volume in a 100-mL volumetric flask. A 50.00-mL portion is removed and 0.500 mg of radioactive vitamin B12 having an activity of 572 cpm is added as a tracer. The sample and tracer are homogenized and the vitamin B12 isolated and purified, producing 18.6 mg with an activity of 361 cpm. Calculate the milligrams of vitamin B12 in a multivitamin tablet.
19. The oldest sample that can be dated by 14C is approximately 30 000 yr. What percentage of the 14C remains after this time span?
20. Potassium–argon dating is based on the nuclear decay of 40K to 40Ar (t1/2 = \(1.3 \times 10^9\) yr). If no 40Ar is originally present in the rock, and if 40Ar cannot escape to the atmosphere, then the relative amounts of 40K and 40Ar can be used to determine the age of the rock. When a 100.0-mg rock sample is analyzed it is found to contain \(4.63 \times 10^{-6}\) mol of 40K and \(2.09 \times 10^{-6}\) mol 40Ar. How old is the rock sample?
21. The steady state activity for 14C in a sample is 13 cpm per gram of carbon. If counting is limited to 1 hr, what mass of carbon is needed to give a percent relative standard deviation of 1% for the sample’s activity? How long must we monitor the radioactive decay from a 0.50-g sample of carbon to give a percent relative standard deviation of 1.0% for the activity?
22. To improve the sensitivity of a FIA analysis you might do any of the following: inject a larger volume of sample, increase the flow rate, decrease the length and the diameter of the manifold’s tubing, or merge separate channels before injecting the sample. For each action, explain why it leads to an improvement in sensitivity.
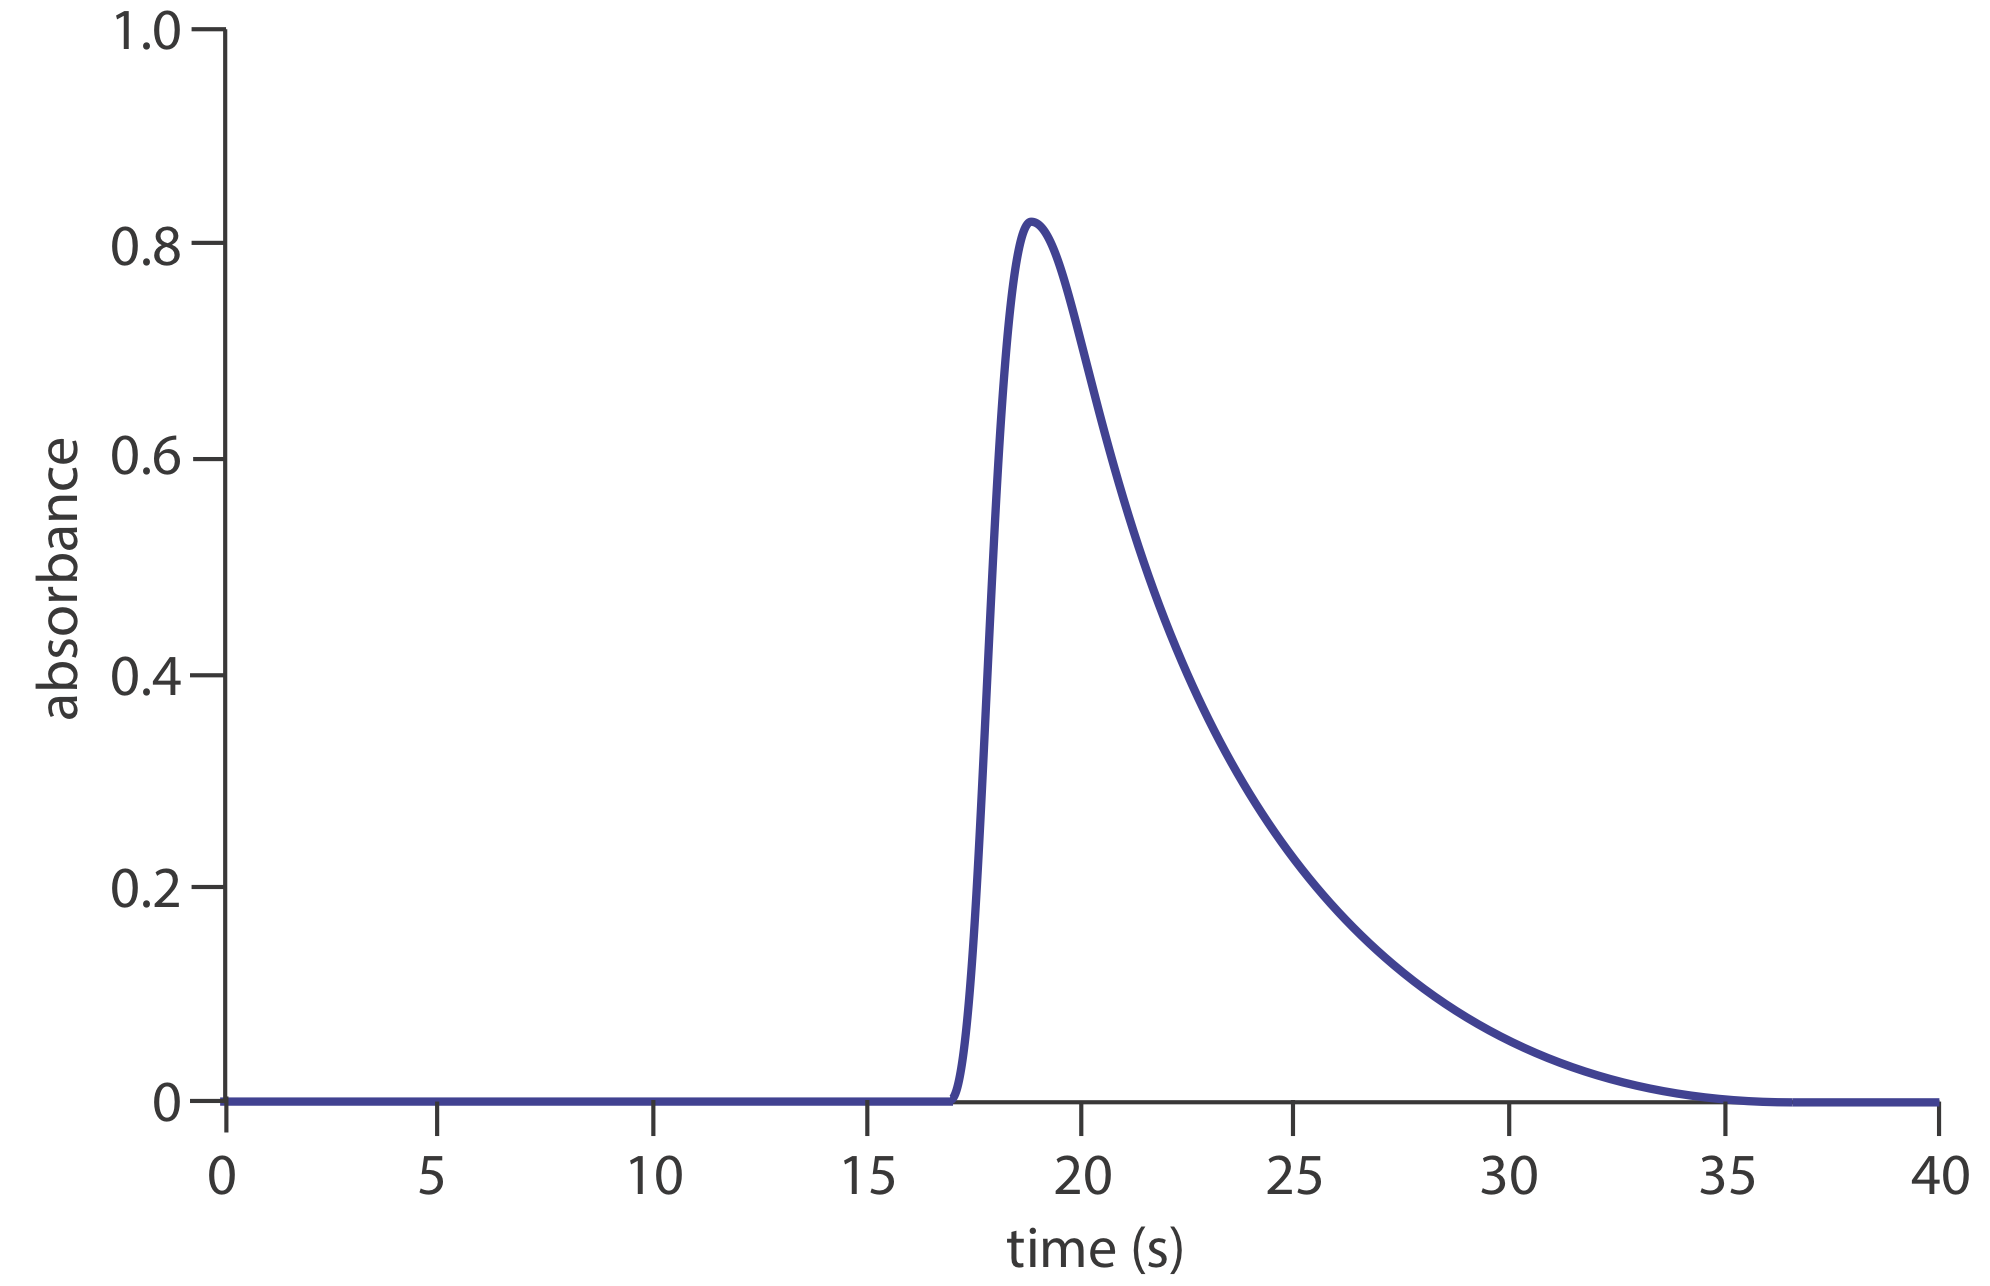
23. The figure below shows a fiagram for a solution of 50.0-ppm \(\text{PO}_4^{3-}\) using the method in Representative Method 13.4.1. Determine values for h, ta, T, t ′, \(\Delta t\), and T ′. What is the sensitivity of this FIA method, assuming a linear relationship between absorbance and concentration? How many samples can be analyzed per hour?
24. A sensitive method for the flow injection analysis of Cu2+ is based on its ability to catalyze the oxidation of di-2-pyridyl ketone hydrazone (DPKH) [Lazaro, F.; Luque de Castro, M. D.; Valcárcel, M. Analyst, 1984, 109, 333–337]. The product of the reaction is fluorescent and is used to generate a signal when using a fluorimeter as a detector. The yield of the reaction is at a maximum when the solution is made basic with NaOH. The fluorescence, however, is greatest in the presence of HCl. Sketch an appropriate FIA manifold for this analysis.
25. The concentration of chloride in seawater is determined by a flow injection analysis. The analysis of a set of calibration standards gives the following results.
| [Cl–] (ppm) | absorbance | [Cl–] (ppm) | absorbance |
|---|---|---|---|
|
5.00 |
0.057 | 40.00 | 0.478 |
| 10.00 | 0.099 | 50.00 | 0.594 |
| 20.00 | 0.230 | 75.00 | 0.840 |
| 30.00 | 0.354 |
A 1.00-mL sample of seawater is placed in a 500-mL volumetric flask and diluted to volume with distilled water. When injected into the flow injection analyzer an absorbance of 0.317 is measured. What is the concentration of Cl– in the sample?
26. Ramsing and co-workers developed an FIA method for acid–base titrations using a carrier stream that is \(2.0 \times 10^{-3}\) M NaOH and that contains the acid–base indicator bromothymol blue [Ramsing, A. U.; Ruzicka, J.; Hansen, E. H. Anal. Chim. Acta 1981, 129, 1–17]. Standard solutions of HCl were injected, and the following values of \(\Delta t\) were measured from the resulting fiagrams.
| [HCl] (M) | \(\Delta t\) (s) | [HCl] (M) | \(\Delta t\) (s) |
|---|---|---|---|
| 0.008 | 3.13 | 0.080 |
7.71 |
| 0.010 | 3.59 | 0.100 |
8.13 |
| 0.020 | 5.11 | 0.200 |
9.27 |
| 0.040 | 6.39 | 0.400 |
10.45 |
| 0.060 | 7.06 | 0.600 | 11.40 |
A sample with an unknown concentration of HCl is analyzed five times, giving values of 7.43, 7.28, 7.41, 7.37, and 7.33 s for \(\Delta t\). Determine the concentration of HCl in the sample.
27. Milardovíc and colleagues used a flow injection analysis method with an amperometric biosensor to determine the concentration of glucose in blood [MilardoviĆ, S.; Kruhak, I.; Ivekovic, D.; Rumenjak, V.; Tkalčec, M.; Grabaric, B. S. Anal. Chim. Acta 1997, 350, 91–96]. Given that a blood sample that is 6.93 mM in glucose has a signal of 7.13 nA, what is the concentration of glucose in a sample of blood if its signal is 11.50 nA?
28. Fernández-Abedul and Costa-García developed an FIA method to determine cocaine in samples using an amperometric detector [Fernández-Abedul, M; Costa-García, A. Anal. Chim. Acta 1996, 328, 67–71]. The following signals (arbitrary units) were collected for 12 replicate injections of a \(6.2 \times 10^{-6}\) M sample of cocaine, C17H21NO4.
|
24.5 |
24.1 |
24.1 |
|
23.8 |
23.9 |
25.1 |
|
23.9 |
24.8 | 23.7 |
| 23.3 | 23.2 | 23.2 |
(a) What is the relative standard deviation for this sample?
(b) The following calibration data are available
| [cocaine] (µM) | signal (arb. units) |
|---|---|
|
0.18 |
0.8 |
|
0.36 |
2.1 |
|
0.60 |
2.4 |
|
0.81 |
3.2 |
|
1.0 |
4.5 |
|
2.0 |
8.1 |
|
4.0 |
14.4 |
|
6.0 |
21.6 |
|
8.0 |
27.1 |
| 10.0 | 32.9 |
In a typical analysis a 10.0-mg sample is dissolved in water and diluted to volume in a 25-mL volumetric flask. A 125-mL aliquot is transferred to a 25-mL volumetric flask and diluted to volume with a pH 9 buffer. When injected into the flow injection apparatus a signal of 21.4 (arb. units) is obtained. What is the %w/w cocaine in the sample?
29. Holman, Christian, and Ruzicka described an FIA method to determine the concentration of H2SO4 in nonaqueous solvents [Holman, D. A.; Christian, G. D.; Ruzicka, J. Anal. Chem. 1997, 69, 1763–1765]. Agarose beads (22–45 mm diameter) with a bonded acid–base indicator are soaked in NaOH and immobilized in the detector’s flow cell. Samples of H2SO4 in n-butanol are injected into the carrier stream. As a sample passes through the flow cell, an acid–base reaction takes place between H2SO4 and NaOH. The endpoint of the neutralization reaction is signaled by a change in the bound indicator’s color and is detected spectrophotometrically. The elution volume needed to reach the titration’s endpoint is inversely proportional to the concentration of H2SO4; thus, a plot of endpoint volume versus [H2SO4]–1 is linear. The following data is typical of that obtained using a set of external standards.
| [H2SO4] (mM) | end point volume (mL) |
|---|---|
|
0.358 |
0.266 |
|
0.436 |
0.227 |
|
0.560 |
0.176 |
|
0.752 |
0.136 |
| 1.38 | 0.075 |
| 2.98 | 0.037 |
| 5.62 | 0.017 |
What is the concentration of H2SO4 in a sample if its endpoint volume is 0.157 mL?