5.4: Vibrational Spectroscopy
- Page ID
- 25384
\( \newcommand{\vecs}[1]{\overset { \scriptstyle \rightharpoonup} {\mathbf{#1}} } \)
\( \newcommand{\vecd}[1]{\overset{-\!-\!\rightharpoonup}{\vphantom{a}\smash {#1}}} \)
\( \newcommand{\id}{\mathrm{id}}\) \( \newcommand{\Span}{\mathrm{span}}\)
( \newcommand{\kernel}{\mathrm{null}\,}\) \( \newcommand{\range}{\mathrm{range}\,}\)
\( \newcommand{\RealPart}{\mathrm{Re}}\) \( \newcommand{\ImaginaryPart}{\mathrm{Im}}\)
\( \newcommand{\Argument}{\mathrm{Arg}}\) \( \newcommand{\norm}[1]{\| #1 \|}\)
\( \newcommand{\inner}[2]{\langle #1, #2 \rangle}\)
\( \newcommand{\Span}{\mathrm{span}}\)
\( \newcommand{\id}{\mathrm{id}}\)
\( \newcommand{\Span}{\mathrm{span}}\)
\( \newcommand{\kernel}{\mathrm{null}\,}\)
\( \newcommand{\range}{\mathrm{range}\,}\)
\( \newcommand{\RealPart}{\mathrm{Re}}\)
\( \newcommand{\ImaginaryPart}{\mathrm{Im}}\)
\( \newcommand{\Argument}{\mathrm{Arg}}\)
\( \newcommand{\norm}[1]{\| #1 \|}\)
\( \newcommand{\inner}[2]{\langle #1, #2 \rangle}\)
\( \newcommand{\Span}{\mathrm{span}}\) \( \newcommand{\AA}{\unicode[.8,0]{x212B}}\)
\( \newcommand{\vectorA}[1]{\vec{#1}} % arrow\)
\( \newcommand{\vectorAt}[1]{\vec{\text{#1}}} % arrow\)
\( \newcommand{\vectorB}[1]{\overset { \scriptstyle \rightharpoonup} {\mathbf{#1}} } \)
\( \newcommand{\vectorC}[1]{\textbf{#1}} \)
\( \newcommand{\vectorD}[1]{\overrightarrow{#1}} \)
\( \newcommand{\vectorDt}[1]{\overrightarrow{\text{#1}}} \)
\( \newcommand{\vectE}[1]{\overset{-\!-\!\rightharpoonup}{\vphantom{a}\smash{\mathbf {#1}}}} \)
\( \newcommand{\vecs}[1]{\overset { \scriptstyle \rightharpoonup} {\mathbf{#1}} } \)
\( \newcommand{\vecd}[1]{\overset{-\!-\!\rightharpoonup}{\vphantom{a}\smash {#1}}} \)
\(\newcommand{\avec}{\mathbf a}\) \(\newcommand{\bvec}{\mathbf b}\) \(\newcommand{\cvec}{\mathbf c}\) \(\newcommand{\dvec}{\mathbf d}\) \(\newcommand{\dtil}{\widetilde{\mathbf d}}\) \(\newcommand{\evec}{\mathbf e}\) \(\newcommand{\fvec}{\mathbf f}\) \(\newcommand{\nvec}{\mathbf n}\) \(\newcommand{\pvec}{\mathbf p}\) \(\newcommand{\qvec}{\mathbf q}\) \(\newcommand{\svec}{\mathbf s}\) \(\newcommand{\tvec}{\mathbf t}\) \(\newcommand{\uvec}{\mathbf u}\) \(\newcommand{\vvec}{\mathbf v}\) \(\newcommand{\wvec}{\mathbf w}\) \(\newcommand{\xvec}{\mathbf x}\) \(\newcommand{\yvec}{\mathbf y}\) \(\newcommand{\zvec}{\mathbf z}\) \(\newcommand{\rvec}{\mathbf r}\) \(\newcommand{\mvec}{\mathbf m}\) \(\newcommand{\zerovec}{\mathbf 0}\) \(\newcommand{\onevec}{\mathbf 1}\) \(\newcommand{\real}{\mathbb R}\) \(\newcommand{\twovec}[2]{\left[\begin{array}{r}#1 \\ #2 \end{array}\right]}\) \(\newcommand{\ctwovec}[2]{\left[\begin{array}{c}#1 \\ #2 \end{array}\right]}\) \(\newcommand{\threevec}[3]{\left[\begin{array}{r}#1 \\ #2 \\ #3 \end{array}\right]}\) \(\newcommand{\cthreevec}[3]{\left[\begin{array}{c}#1 \\ #2 \\ #3 \end{array}\right]}\) \(\newcommand{\fourvec}[4]{\left[\begin{array}{r}#1 \\ #2 \\ #3 \\ #4 \end{array}\right]}\) \(\newcommand{\cfourvec}[4]{\left[\begin{array}{c}#1 \\ #2 \\ #3 \\ #4 \end{array}\right]}\) \(\newcommand{\fivevec}[5]{\left[\begin{array}{r}#1 \\ #2 \\ #3 \\ #4 \\ #5 \\ \end{array}\right]}\) \(\newcommand{\cfivevec}[5]{\left[\begin{array}{c}#1 \\ #2 \\ #3 \\ #4 \\ #5 \\ \end{array}\right]}\) \(\newcommand{\mattwo}[4]{\left[\begin{array}{rr}#1 \amp #2 \\ #3 \amp #4 \\ \end{array}\right]}\) \(\newcommand{\laspan}[1]{\text{Span}\{#1\}}\) \(\newcommand{\bcal}{\cal B}\) \(\newcommand{\ccal}{\cal C}\) \(\newcommand{\scal}{\cal S}\) \(\newcommand{\wcal}{\cal W}\) \(\newcommand{\ecal}{\cal E}\) \(\newcommand{\coords}[2]{\left\{#1\right\}_{#2}}\) \(\newcommand{\gray}[1]{\color{gray}{#1}}\) \(\newcommand{\lgray}[1]{\color{lightgray}{#1}}\) \(\newcommand{\rank}{\operatorname{rank}}\) \(\newcommand{\row}{\text{Row}}\) \(\newcommand{\col}{\text{Col}}\) \(\renewcommand{\row}{\text{Row}}\) \(\newcommand{\nul}{\text{Nul}}\) \(\newcommand{\var}{\text{Var}}\) \(\newcommand{\corr}{\text{corr}}\) \(\newcommand{\len}[1]{\left|#1\right|}\) \(\newcommand{\bbar}{\overline{\bvec}}\) \(\newcommand{\bhat}{\widehat{\bvec}}\) \(\newcommand{\bperp}{\bvec^\perp}\) \(\newcommand{\xhat}{\widehat{\xvec}}\) \(\newcommand{\vhat}{\widehat{\vvec}}\) \(\newcommand{\uhat}{\widehat{\uvec}}\) \(\newcommand{\what}{\widehat{\wvec}}\) \(\newcommand{\Sighat}{\widehat{\Sigma}}\) \(\newcommand{\lt}{<}\) \(\newcommand{\gt}{>}\) \(\newcommand{\amp}{&}\) \(\definecolor{fillinmathshade}{gray}{0.9}\)Vibrational spectroscopy provides the most definitive means of identifying the surface species generated upon molecular adsorption and the species generated by surface reactions. In principle, any technique that can be used to obtain vibrational data from solid state or gas phase samples (IR, Raman etc.) can be applied to the study of surfaces - in addition there are a number of techniques which have been specifically developed to study the vibrations of molecules at interfaces (EELS, SFG etc.).
There are, however, only two techniques that are routinely used for vibrational studies of molecules on surfaces - these are:
- IR Spectroscopy (of various forms, e.g. RAIRS, MIR)
- Electron Energy Loss Spectroscopy ( EELS )
IR Spectroscopy
There are a number of ways in which the IR technique may be implemented for the study of adsorbates on surfaces. For solid samples possessing a high surface area:
- Transmission IR Spectroscopy: employing the same basic experimental geometry as that used for liquid samples and mulls. This is often used for studies on supported metal catalysts where the large metallic surface area permits a high concentration of adsorbed species to be sampled. The solid sample must, of course, be IR transparent over an appreciable wavelength range.
- Diffuse Reflectance IR Spectroscopy ( DRIFTS ): in which the diffusely scattered IR radiation from a sample is collected, refocused and analysed. This modification of the IR technique can be employed with high surface area catalytic samples that are not sufficiently transparent to be studied in transmission.
- For studies on low surface area samples (e.g. single crystals):
- Reflection-Absorption IR Spectroscopy ( RAIRS ): where the IR beam is specularly reflected from the front face of a highly-reflective sample, such as a metal single crystal surface.
- Multiple Internal Reflection Spectroscopy ( MIR ): in which the IR beam is passed through a thin, IR transmitting sample in a manner such that it alternately undergoes total internal reflection from the front and rear faces of the sample. At each reflection, some of the IR radiation may be absorbed by species adsorbed on the solid surface - hence the alternative name of Attenuated Total Reflection (ATR).
RAIRS - the Study of Adsorbates on Metallic Surfaces by Reflection IR Spectroscopy
It can be shown theoretically that the best sensitivity for IR measurements on metallic surfaces is obtained using a grazing-incidence reflection of the IR light.

Furthermore, since it is an optical (photon in/photon out) technique it is not necessary for such studies to be carried out in vacuum. The technique is not inherently surface-specific, but
- there is no bulk signal to worry about
- the surface signal is readily distinguishable from gas-phase absorptions using polarization effects.
One major problem, is that of sensitivity (i.e. the signal is usually very weak owing to the small number of adsorbing molecules). Typically, the sampled area is ca. 1 cm2 with less than 1015 adsorbed molecules (i.e. about 1 nanomole). With modern FTIR spectrometers, however, such small signals (0.01% - 2% absorption) can still be recorded at relatively high resolution (ca. 1 cm-1 ).
For a number of practical reasons, low frequency modes ( < 600 cm-1 ) are not generally observable - this means that it is not usually possible to see the vibration of the metal-adsorbate bond and attention is instead concentrated on the intrinsic vibrations of the adsorbate species in the range 600 - 3600 cm-1.
Selection Rules
The observation of vibrational modes of adsorbates on metallic substrates is subject to the surface dipole selection rule. This states that only those vibrational modes which give rise to an oscillating dipole perpendicular (normal) to the surface are IR active and give rise to an observable absorption band.
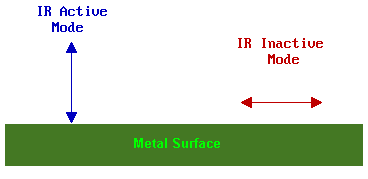
Further information on the selection rules for surface IR spectroscopy can be found in the review by Sheppard & Erkelens [Appl. Spec. 38, 471 (1984)]. It also needs to be remembered that even if a transition is allowed it may still be very weak if the transition moment is small.
The sequence of spectra shown below demonstrate how IR spectroscopy can clearly reveal changes in the adsorption geometry of chemisorbed molecules. In this particular instance, all the bands are due to the stretching mode of the N-O bond in NO molecules adsorbed on a Pt surface, but the vibrational frequency is sensitive to changes in the coordination and molecular orientation of the adsorbed NO molecules.
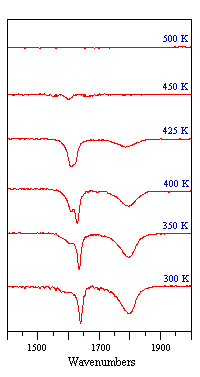
Fig. ν(N-O) spectra obtained from a Pt surface subjected to a fixed exposure of NO at various temperatures
Note - the surface coverage of adsorbed NO molecules decreases as the temperature is raised and little NO remains adsorbed at temperatures of 450 K and above.
The RAIRS spectra shown below were observed during HCN adsorption on Pt at sub-ambient temperatures; the surface species which are generated give rise to much weaker absorptions than NO, and signal:noise considerations become much more important. These spectra also illustrate the effect of the surface normal selection rule for metallic surfaces.
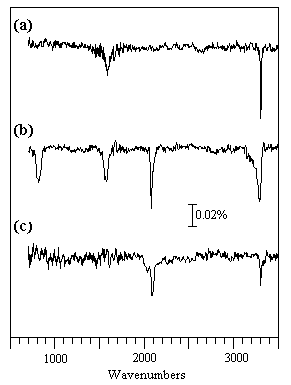
(a) 0.15 L HCN at 100 K: The HCN molecules are weakly coordinated to the surface in a linear end-on fashion via the nitrogen; the ν(H-CN) mode is seen at 3302 cm-1 but the ν(C-N) mode is too weak to be seen and the δ(HCN) mode expected at ca. 850 cm-1 is forbidden by the surface selection rule. The overtone of the bending mode, 2δ(HCN), is however allowed and is evident at ca. 1580 cm-1.
(b) 1.50 L HCN at 100 K: Higher exposures lead to the physisorption of HCN molecules into a second layer. These molecules are inclined to the surface normal and the HCN bending mode (∼ 820 cm-1) of these second layer molecules is no longer symmetry forbidden. Hydrogen bonding between molecules in the first and second layers also leads to a noticeable broadening of the ν(H-CN) band to lower wavenumbers.
(c) 30 L HCN at 200 K: At the higher temperature of 200 K only a small amount of molecular HCN remains bound in an end-on fashion to the surface. The relatively strong band at 2084 cm-1 suggests that some dissociation has also occurred to give adsorbed CN groups, which give rise to a markedly more intense ν(C-N) band than the HCN molecule itself.
Electron Energy Loss Spectroscopy (EELS)
This is a technique utilising the inelastic scattering of low energy electrons in order to measure vibrational spectra of surface species: superficially, it can be considered as the electron-analogue of Raman spectroscopy. To avoid confusion with other electron energy loss techniques it is sometimes referred to as HREELS - high resolution EELS or VELS - vibrational ELS. Since the technique employs low energy electrons, it is necessarily restricted to use in high vacuum (HV) and UHV environments - however, the use of such low energy electrons ensures that it is a surface specific technique and, arguably, it is the vibrational technique of choice for the study of most adsorbates on single crystal substrates.
The basic experimental geometry is fairly simple as illustrated schematically below - it involves using an electron monochromator to give a well-defined beam of electrons of a fixed incident energy, and then analysing the scattered electrons using an appropriate electron energy analyser.

A substantial number of electrons are elastically scattered (\( E = E_o\)) - this gives rise to a strong elastic peak in the spectrum.
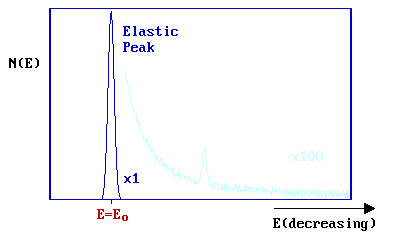
On the low kinetic energy side of this main peak (\(E < E_o\)), additional weak peaks are superimposed on a mildly sloping background. These peaks correspond to electrons which have undergone discrete energy losses during the scattering from the surface.

The magnitude of the energy loss, \(ΔE = (E_o - E)\), is equal to the vibrational quantum (i.e. the energy) of the vibrational mode of the adsorbate excited in the inelastic scattering process. In practice, the incident energy ( Eo ) is usually in the range 5-10 eV (although occasionally up to 200 eV) and the data is normally plotted against the energy loss (frequently measured in meV).

Selection Rules
The selection rules that determine whether a vibrational band may be observed depend upon the nature of the substrate and also the experimental geometry: specifically the angles of the incident and (analysed) scattered beams with respect to the surface. For metallic substrates and a specular geometry, scattering is principally by a long-range dipole mechanism. In this case the loss features are relatively intense, but only those vibrations giving rise to a dipole change normal to the surface can be observed.
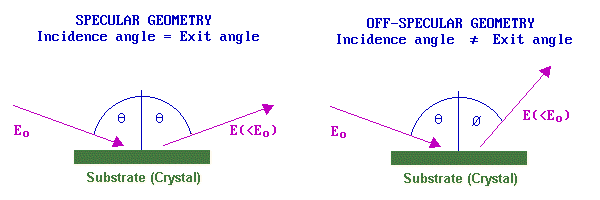
By contrast, in an off-specular geometry, electrons lose energy to surface species by a short-range impact scattering mechanism. In this case the loss features are relatively weak but all vibrations are allowed and may be observed. If spectra can be recorded in both specular and off-specular modes the selection rules for metallic substrates can be put to good use - helping the investigator to obtain more definitive identification of the nature and geometry of the adsorbate species. The resolution of the technique (despite the HREELS acronym !) is generally rather poor; 40-80 cm-1 is not untypical. A measure of the instrumental resolution is given by looking at the FWHM (full-width at half maximum) of the elastic peak.
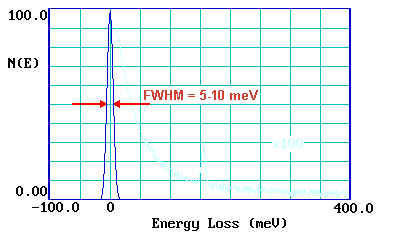
This poor resolution can cause problems in distinguishing between closely similar surface species - however, recent improvements in instrumentation have opened up the possibility of much better spectral resolution ( < 10 cm-1 ) and will undoubtedly enhance the utility of the technique.
In summary, there are both advantages and disadvantages in utilising EELS, as opposed to IR techniques, for the study of surface species It offers the advantages of ...
- high sensitivity
- variable selection rules
- spectral acquisition to below 400 cm-1
but suffers from the limitations of ...
- use of low energy electrons (requiring a HV environment and hence the need for low temperatures to study weakly-bound species, and also the use of magnetic shielding to reduce the magnetic field in the region of the sample)
- requirement for flat, preferably conducting, substrates
- lower resolution
Applications of Vibrational Spectroscopy
One of the classic examples of an area in which vibrational spectroscopy has contributed significantly to the understanding of the surface chemistry of an adsorbate is that of:
Molecular Adsorption of CO on Metallic Surfaces
Adsorbed carbon monoxide usually gives rise to strong absorptions in both the IR and EELS spectra at the (C-O) stretching frequency. The metal-carbon stretching mode (ca. 400 cm-1 ) is usually also accessible to EELS.
The interpretation of spectra of CO as an adsorbed surface species draws heavily upon IR spectra from related inorganic cluster and coordination complexes - the structure of such complexes usually being available from x-ray single crystal diffraction measurements. This comparison suggests that the CO stretching frequency can provide a good indication of the surface coordination of the molecule: as a rough guideline,
|
ν(C-O) |
|
|---|---|
|
CO ( gas phase ) |
2143 cm-1 |
|
Terminal CO |
2100 - 1920 cm-1 |
|
Bridging ( 2f site ) |
1920 - 1800 cm-1 |
|
Bridging ( 3f / 4f site ) |
< 1800 cm-1 |
The RAIRS spectrum shown below was obtained for a saturation coverage of CO on a Pt surface at 300 K.
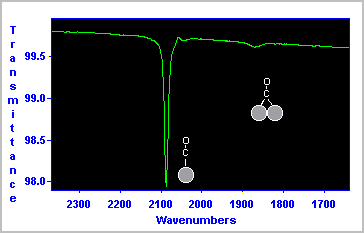
The data indicate that the majority of the CO molecules are bound in a terminal fashion to a single Pt surface atom (νCO ∼ 2090 cm-1 ), whilst a smaller number of molecules are co-ordinated in a bridging site between two Pt atoms (νCO ∼ 1870 cm-1 ).
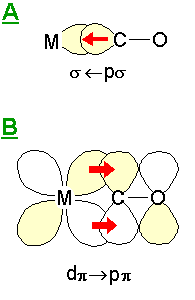
The reduction in the stretching frequency of terminally-bound CO from the value observed for the gas phase molecule ( 2143 cm-1 ) can be explained in terms of the Dewar-Chatt or Blyholder model for the bonding of CO to metals.
|
|
This simple model considers the metal-CO bonding to consist of two main components: A: this is a σ-bonding interaction due to overlap of a filled s -"lone pair" orbital on the carbon atom with empty metal orbitals of the correct symmetry - this leads to electron density transfer from the CO molecule to the metal centre. B: this is a π bonding interaction due to overlap of filled metal dπ (and pπ ?) orbitals with the π* antibonding molecular orbital of the CO molecule. Since this interaction leads to the introduction of electron density into the CO antibonding orbital there is a consequent reduction in the CO bond strength and its intrinsic vibrational frequency (relative to the isolated molecule). |
For a more detailed discussions on the bonding of CO to metals, you are recommended to refer to one of the following:
- " Advanced Inorganic Chemistry " by F.A. Cotton & G. Wilkinson (5th Edn.) pp. 58 - 62 .
- " Solids & Surfaces: a chemist's view of bonding in extended structures " by R. Hoffman pp. 71-74.


