Electronic Spectroscopy: Application
- Page ID
- 1763
\( \newcommand{\vecs}[1]{\overset { \scriptstyle \rightharpoonup} {\mathbf{#1}} } \)
\( \newcommand{\vecd}[1]{\overset{-\!-\!\rightharpoonup}{\vphantom{a}\smash {#1}}} \)
\( \newcommand{\dsum}{\displaystyle\sum\limits} \)
\( \newcommand{\dint}{\displaystyle\int\limits} \)
\( \newcommand{\dlim}{\displaystyle\lim\limits} \)
\( \newcommand{\id}{\mathrm{id}}\) \( \newcommand{\Span}{\mathrm{span}}\)
( \newcommand{\kernel}{\mathrm{null}\,}\) \( \newcommand{\range}{\mathrm{range}\,}\)
\( \newcommand{\RealPart}{\mathrm{Re}}\) \( \newcommand{\ImaginaryPart}{\mathrm{Im}}\)
\( \newcommand{\Argument}{\mathrm{Arg}}\) \( \newcommand{\norm}[1]{\| #1 \|}\)
\( \newcommand{\inner}[2]{\langle #1, #2 \rangle}\)
\( \newcommand{\Span}{\mathrm{span}}\)
\( \newcommand{\id}{\mathrm{id}}\)
\( \newcommand{\Span}{\mathrm{span}}\)
\( \newcommand{\kernel}{\mathrm{null}\,}\)
\( \newcommand{\range}{\mathrm{range}\,}\)
\( \newcommand{\RealPart}{\mathrm{Re}}\)
\( \newcommand{\ImaginaryPart}{\mathrm{Im}}\)
\( \newcommand{\Argument}{\mathrm{Arg}}\)
\( \newcommand{\norm}[1]{\| #1 \|}\)
\( \newcommand{\inner}[2]{\langle #1, #2 \rangle}\)
\( \newcommand{\Span}{\mathrm{span}}\) \( \newcommand{\AA}{\unicode[.8,0]{x212B}}\)
\( \newcommand{\vectorA}[1]{\vec{#1}} % arrow\)
\( \newcommand{\vectorAt}[1]{\vec{\text{#1}}} % arrow\)
\( \newcommand{\vectorB}[1]{\overset { \scriptstyle \rightharpoonup} {\mathbf{#1}} } \)
\( \newcommand{\vectorC}[1]{\textbf{#1}} \)
\( \newcommand{\vectorD}[1]{\overrightarrow{#1}} \)
\( \newcommand{\vectorDt}[1]{\overrightarrow{\text{#1}}} \)
\( \newcommand{\vectE}[1]{\overset{-\!-\!\rightharpoonup}{\vphantom{a}\smash{\mathbf {#1}}}} \)
\( \newcommand{\vecs}[1]{\overset { \scriptstyle \rightharpoonup} {\mathbf{#1}} } \)
\(\newcommand{\longvect}{\overrightarrow}\)
\( \newcommand{\vecd}[1]{\overset{-\!-\!\rightharpoonup}{\vphantom{a}\smash {#1}}} \)
\(\newcommand{\avec}{\mathbf a}\) \(\newcommand{\bvec}{\mathbf b}\) \(\newcommand{\cvec}{\mathbf c}\) \(\newcommand{\dvec}{\mathbf d}\) \(\newcommand{\dtil}{\widetilde{\mathbf d}}\) \(\newcommand{\evec}{\mathbf e}\) \(\newcommand{\fvec}{\mathbf f}\) \(\newcommand{\nvec}{\mathbf n}\) \(\newcommand{\pvec}{\mathbf p}\) \(\newcommand{\qvec}{\mathbf q}\) \(\newcommand{\svec}{\mathbf s}\) \(\newcommand{\tvec}{\mathbf t}\) \(\newcommand{\uvec}{\mathbf u}\) \(\newcommand{\vvec}{\mathbf v}\) \(\newcommand{\wvec}{\mathbf w}\) \(\newcommand{\xvec}{\mathbf x}\) \(\newcommand{\yvec}{\mathbf y}\) \(\newcommand{\zvec}{\mathbf z}\) \(\newcommand{\rvec}{\mathbf r}\) \(\newcommand{\mvec}{\mathbf m}\) \(\newcommand{\zerovec}{\mathbf 0}\) \(\newcommand{\onevec}{\mathbf 1}\) \(\newcommand{\real}{\mathbb R}\) \(\newcommand{\twovec}[2]{\left[\begin{array}{r}#1 \\ #2 \end{array}\right]}\) \(\newcommand{\ctwovec}[2]{\left[\begin{array}{c}#1 \\ #2 \end{array}\right]}\) \(\newcommand{\threevec}[3]{\left[\begin{array}{r}#1 \\ #2 \\ #3 \end{array}\right]}\) \(\newcommand{\cthreevec}[3]{\left[\begin{array}{c}#1 \\ #2 \\ #3 \end{array}\right]}\) \(\newcommand{\fourvec}[4]{\left[\begin{array}{r}#1 \\ #2 \\ #3 \\ #4 \end{array}\right]}\) \(\newcommand{\cfourvec}[4]{\left[\begin{array}{c}#1 \\ #2 \\ #3 \\ #4 \end{array}\right]}\) \(\newcommand{\fivevec}[5]{\left[\begin{array}{r}#1 \\ #2 \\ #3 \\ #4 \\ #5 \\ \end{array}\right]}\) \(\newcommand{\cfivevec}[5]{\left[\begin{array}{c}#1 \\ #2 \\ #3 \\ #4 \\ #5 \\ \end{array}\right]}\) \(\newcommand{\mattwo}[4]{\left[\begin{array}{rr}#1 \amp #2 \\ #3 \amp #4 \\ \end{array}\right]}\) \(\newcommand{\laspan}[1]{\text{Span}\{#1\}}\) \(\newcommand{\bcal}{\cal B}\) \(\newcommand{\ccal}{\cal C}\) \(\newcommand{\scal}{\cal S}\) \(\newcommand{\wcal}{\cal W}\) \(\newcommand{\ecal}{\cal E}\) \(\newcommand{\coords}[2]{\left\{#1\right\}_{#2}}\) \(\newcommand{\gray}[1]{\color{gray}{#1}}\) \(\newcommand{\lgray}[1]{\color{lightgray}{#1}}\) \(\newcommand{\rank}{\operatorname{rank}}\) \(\newcommand{\row}{\text{Row}}\) \(\newcommand{\col}{\text{Col}}\) \(\renewcommand{\row}{\text{Row}}\) \(\newcommand{\nul}{\text{Nul}}\) \(\newcommand{\var}{\text{Var}}\) \(\newcommand{\corr}{\text{corr}}\) \(\newcommand{\len}[1]{\left|#1\right|}\) \(\newcommand{\bbar}{\overline{\bvec}}\) \(\newcommand{\bhat}{\widehat{\bvec}}\) \(\newcommand{\bperp}{\bvec^\perp}\) \(\newcommand{\xhat}{\widehat{\xvec}}\) \(\newcommand{\vhat}{\widehat{\vvec}}\) \(\newcommand{\uhat}{\widehat{\uvec}}\) \(\newcommand{\what}{\widehat{\wvec}}\) \(\newcommand{\Sighat}{\widehat{\Sigma}}\) \(\newcommand{\lt}{<}\) \(\newcommand{\gt}{>}\) \(\newcommand{\amp}{&}\) \(\definecolor{fillinmathshade}{gray}{0.9}\)Electronic Absorption and Fluorescence spectroscopy are both analytical methods that center around the idea that when one perturbs a known or unknown solution with a spectrum of energetic photons, those photons that have the correct energy to interact with the molecules in solution will do so, and those molecules under observation will always interact with photons of energies characteristic to that molecule. These methods have tremendously helped scientists elucidate and characterize the physical properties of a variety of molecules by giving a means to probe the fundamental electronic structure of those molecules.
Introduction
The theory behind Electronic Absorption and Fluorescence was described in a previous text. If you are unfamiliar with electronic spectroscopy, browsing the theory might help paint a better picture of what will be discussed in this module.But even if you understand what a Jablonski diagram represents or the mathematical description behind the transition dipole moment operator, eventually you want to know how to apply the information you've learned to your world.
What this means to you is that you now have the ability that allow you to find the reason why carrots are orange or why plants are green. You could take leaves and carrots, chop them into fine pieces, extract and separate the molecules inside of them, and use Electronic Absorption or Fluorescence spectroscopy to figure out that the orange color in carrots is due to a family of molecules known as the carotenoids and that the green color in the leaves is due to a variety of different chlorophyll molecules. So excited by this knowledge, you could take the carotenoids that you now know are responsible for the color orange and dye cloth to make yourself a carrot costume!
But what if you wanted a different color? What if you wanted a lighter shade of orange? What if you wanted a very exact and very specific color? Before you can go explore the world (or lab) to find (or design) a molecule that has those properties you need to be able to understand the instruments that allow you to do the work so you can be certain you get the results you desire.
The remainder of this wikitext describes the design and components of a photospectrometer to measure the the Ultra Violet through Visable (UV-Vis) region of the electromagnetic spectrum. Basic instrumental design and theory behind a spectrofluorometer will also be discussed along with the errors and limits known to plague these instruments. By the end of this text, you should be fully able to design a a photospectrometer in order to characterize the electronic behavior of molecules in order to prove to yourself that carotenoids are responsible for the color orange (building of a carrot costume is optional)
Basic Design
As stated in the introduction, the purpose of a spectrophotometer is to characterize how molecules react with photons of varying wavelengths. This easiest way to do this is to design an instrument that can control what type of light is in contact with the sample and the amount of that light that makes it through. Shown below is a simple spectrophotometer that does just what was described. A light source produces light that can be separated and controlled by the monochrometer which then allows only the desired light to impinge upon the sample. The light that travels through the sample is detected and sent to a recorder. Keep this overall picture in mind when thinking about the components and what each of their parts are in whole experiment.
Sources
As shown above, the first piece of equipment needed is a source of photons (light). Since we are interested in the UV-Vis region of the electromagnetic spectrum, we need to assure that this source is able to produce photons with the correct wavelengths (180-780 nm) that are characteristic to the spectrums of interest so that the experiment can be completed. Typical sources come in two forms, either in the form of a lamp, or in the form of a laser. Lamps can provide a wide spectrum of light that can be used for almost any purpose at a very reasonable cost, while lasers provide very intense monochromatic light and tend can be used for fluorescence and other specialized experiments due to their high costs.
Tungsten Filament Lamps
A common lamp source that might be familiar is the tungsten filament lamp or sometimes referred to as the incandescent light bulb. This type of lamp produces a spectrum of light perfect for the visible spectrum (320 nm - 3.5 µm)1 by applying a voltage through a thin filament of tungsten until it heats up enough to produce black body radiation. The Tungsten-Halogen lamp is a significant improvement over the normal tungsten filament lamp due to its longer lifetime and the wider range of light it produces. This is achieved by incasing the filament with quartz instead of silica so the filament can be forced to higher temperatures (thus increasing the range of light produced) and by trapping a halogen gas (normally Iodine) that can react with sublimated tungsten atoms to form WI2 that can then redeposit the tungsten by coming into contact with the filament (thus increasing the lifespan).
Hydrogen/Deuterium Lamps
This type of lamp is used to obtain a spectrum of light in the Ultra Violet region (190-400 nm). The spectrum is obtained by trapping Hydrogen at low pressures inside of a glass tube and creating an electrical arc inside of the cell. This electrical arc creates high energy hydrogen gas atoms that dissociate into two hydrogen atoms along with producing photons. The wavelength of the photons created from the dissociation is dependent on the resulting kinetic energies of the two hydrogen atoms after the dissociation. Since the kinetic energies of the dissociated atoms can vary from zero to the original energy of the excited atom, the photon produced can also vary which leads to a spectrum of photons. Deuterium is often used in lieu of hydrogen because it can produce more a more intense spectrum and has a longer lifetime. Both types of this lamp are housed within a quartz shell since silica absorbs in the Ultraviolet range.
Lasers
Tunable dye and fixed wavelength lasers that produce photons within the UV-Vis spectrum are commonly used for fluorescence experiments where the intensity of the resulting fluorescence is directly proportional to the intensity of the source. Lasers are inherently focused which provides the benefit of being able to work with very small or dilute samples. The caveats of using a laser are that the spectrum produced is physically limited and that care must also be taken to avoid photodegredation of your samples by attenuating the power of the laser. A description of the construction and theory behind lasers won't be discussed here, but can be found through a variety of sources.1,2,3,4,5,6
Filters and Monochrometers
Unless a laser is used, a device is needed to restrict and isolate the wavelengths that our sources provide in order to control the experiment. If a isolated wavelength is needed or isn't needed, interference or absorption filters can be used. If a spectrum of wavelengths needs to be passed through the sample, monochrometers provide the ability to separate and control the light passed through the sample while preserving the available spectrum.
Filters
Intereference filters are designed to provide constructive or destructive interference of light by taking advantage of the refraction of light through different materials. As light passes from one medium to the other the direction and wavelength of light can be changed based on the index of refraction of both mediums involved and the angle of the incident and exiting light (For more look at Snell's Law). Due to this behavior, constructive and destructive interference can be controlled by varying the thickness (d) of a transparent dielectric material between two semi-reflective sheets and the angle the light is shined upon the surface. As light hits the first semi-reflective sheet, a portion is reflected, while the rest travels through the dielectric to be bent and reflected by the second semi-reflective sheet. If the conditions are correct, the reflected light and the initial incident light will be in phase and constructive interference occurs for only a particular wavelength.
Another common filter is the Absorption Filter. Absorption filters work on the premise of being able to filter light by absorbing all other wavelengths that aren't of interest. They are normally constructed from a colored glass that absorbs over a wide range. Although normally cheaper than interference filters, absorbance filters tend to be less precise at filtering for a selected wavelength and also have the added penalty of absorbing some of the selected light thus lowering the intensity.
Monochrometers
Monochrometers, as previously mentioned, are used to control and separate light so that a sample can be subjected to a span of wavelengths. Light entering a monochrometer is filtered by a thin slit. The filtered light is then focused by a mirror onto a dispersing element that separates the light into its different wavelengths. The separated light is then focused again and angled toward an exit slit which then filters against all wavelengths except the desired one. The wavelength selected can then easily be changed by rotating the dispersing element to support the transmission of the new desired wavelength. Though monochrometers nearly all have the same practical design, the difference normally is determined by the type of dispersing element.
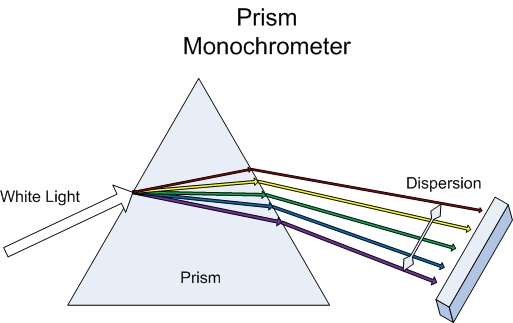
One type of dispersing element is a prism which disperses light by refraction through two angled surfaces. In order to separate the light into different wavelengths, the prism needs to be made of material that has a change in the index of refraction with respect to wavelength so that each wavelength is bent at a different angle. The larger the difference in the index of refraction the better the separation is between wavelengths. For the UV-Vis range, a typical prism is cut from left handed quartz at a thirty degree angle and attached to another piece of quarts cut the same way except from right handed quartz to make a Conru Prism. The pitfall of prism based dispersing elements is the fact that the index of refraction for most materials varies nonlinearly when compared to wavelength which results in a smaller degree of separation at longer wavelengths.
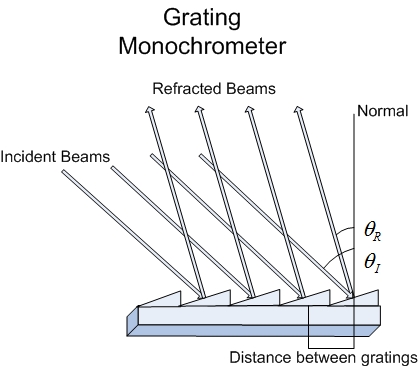
More commonly used due to less expensive fabrication costs and its ability to separate light in a linear fashion are grating dispersing elements. Gratings are designed to diffract light which is a separation based on the angle of the incident light to the grating normal and the spacing between groves. When beams of light impinge upon the grating some beams travel farther than others and this causes an effect akin to a interference filter which allows for constructive and destructive interference and provides the means to reflect a specific wavelength based on the angle of incidence. The most common type of grating is the echellette grating in which the grooves are angled in order to provide maximum reflection of the incident light into a single order of reflected light.
Sample Cell
Care must be taken when considering a sample container to avoid unwanted absorption in the range of interest. While glass might be perfect for the visible range, it absorbs in the UV range. Quartz can be used for both but most likely would cost considerably more. Disposable Plastic cuvets created from polystyrene or polymethyl methacrylate are in common use today as they are cheap to purchase and eliminate the need for cleaning cuvettes in order to analyze multiple samples. The shape of the sample holder is also very important as unwanted scattering of light should be minimized and pathlength through the cell should remain constant . Square (1 cm) cuvettes with frosted sides have been designed to minimize scattering and provide a surface to hold the cuvette, thereby reducing smudges or smears of the optical window all the while keeping a fixed path length. Cuvettes for fluorescent experiments cannot allow the frosted sides due to the 90° angle of most instruments and have to be carefully cleaned as bodily oils have the ability to fluoresce. Placement of the sample within either a absorption or fluorescence device is imperative and is normally fixed by a sample holder to insure reproducible results.
Detectors
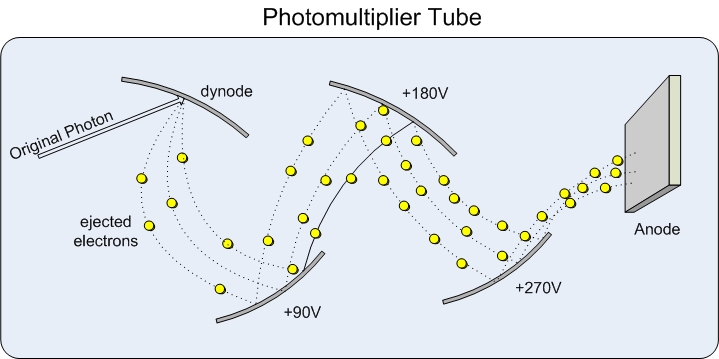
After the light has passed through the sample, we want to be able to detect and measure the resulting light. These types of detectors come in the form of transducers that are able to take energy from light and convert it into an electrical signal that can be recorded, and if necessary, amplified.Photomultiplier tubes are a common example of a transducer that is used in a variety of devices. The idea is that when a photon hits the top of the tube electrons are released, which are pulled toward the other end of the tube by an electric field. The way the electrons are multiplied is due to the fact that along the length of the tube there are several dynodes that have a slightly less negative potential than surface before it which causes the electrons traveling down the tube to hit each surface which then in turn produces more electrons until at the very end there is a large amount of electrons (~1,000,000) representing the one photon that started the cascade.
Another type of transducer is a Charge injection device (CID). This device works by having a p-type and n-type semiconductor next to each other in which the n-type material is separated from the anodes by a silica layer that acts as a capacitor. As a photon interacts with the n-type layer, an electron migrates to the p-type semiconductor and a positive charge is generated that migrates toward the silica capacitor. This process continues to happen until the potential is measured by means of comparing the more negative of the anodes to ground (Vi) . The charge is then transferred to the other anode and measured (Vf). The difference between Vf and Vi is directly proportional to the amount of photons that collided with the n-type layer. The positive charges are then repelled when the anodes switch momentarily to having a positive charge and then the cycle can be repeated. Thousands of these little detectors can be aligned and used to describe the light that interacts with it and can rival the performance of the photomultiplier tube.
Signal Processor
In the end of the experiment all of the data collected needs to be stored or written down. In the past printers have been used to record the transmittance as the experiment progresses. These days, computers are used to record, store, and even manipulate data along with controlling the devices within the spectrometer. This ability allowed by having a computer that can quickly integrate, compare, or annotate spectra dramatically decreases the learning curve needed to operate the instrument as well as reduces the labor associated with simple or even complex experiments. Instead of having to record the transmittance, convert it to absorbance and then subtract the background noise, the computer can accomplish all that for you in the matter of a few seconds .
Instrumental Designs
Now that we've covered the instrument and its components in some detail, there are some different modifications that can be made in order to tailor the device to the experiment it'll be performing. The device introduced in the beginning of this text is the basic single beam spectrometer. This device can measure the transmittance or absorbance of a particular analyte at a given wavelength provided by the source and monochrometer. Background subtraction in these machines needs to be done separately before the analyte is inserted and can be stored and subtracted by the signal processor attached. Although this is the simplest design, the cost of these types of instruments can vary greatly depending on the components that the machine is comprised of.
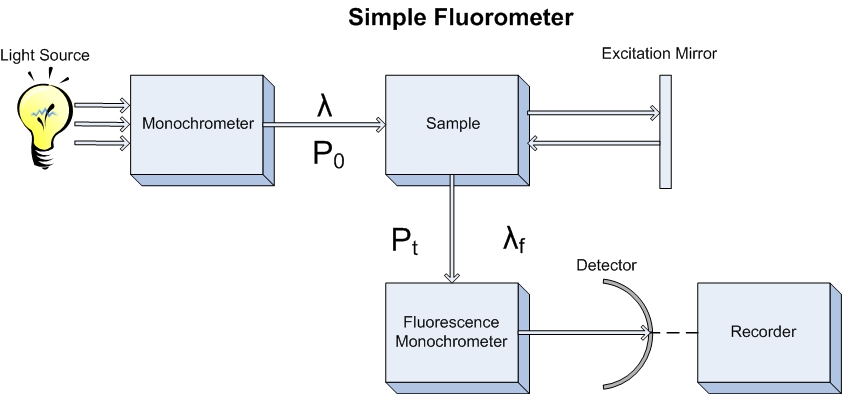
For fluorescence spectroscopy the equivalent to a single beam spectrometer has a few slight modifications in that the detector is perpendicular to the source, and that there is an additional monochrometer that can be used to vary the wavelength detected. In this fashion, the source light is unable to interfere with the fluorescence light being measured, and the fluorescent light produced can be separated and described as the resulting wavelengths of fluorescence as a function of incident light.
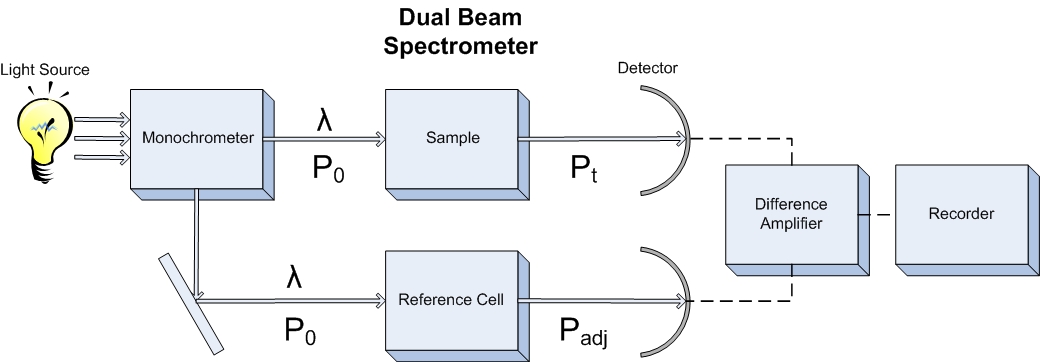
A double beam spectrometer takes a more analytical approach to the design. Because of fluctuations in the source intensity and inconsistencies in the transducer, the source light is split into two beams, one which travels through the sample, and another that is sent through a blank or standard solution. Both beams are then read by separate transducers and the difference between the two is recorded as the corrected transmittance. This allows for quick screening of analytes and negates the need for two separate scans to complete a background subtraction. The same idea can be applied to a fluorometer as well to obtain the same benefit
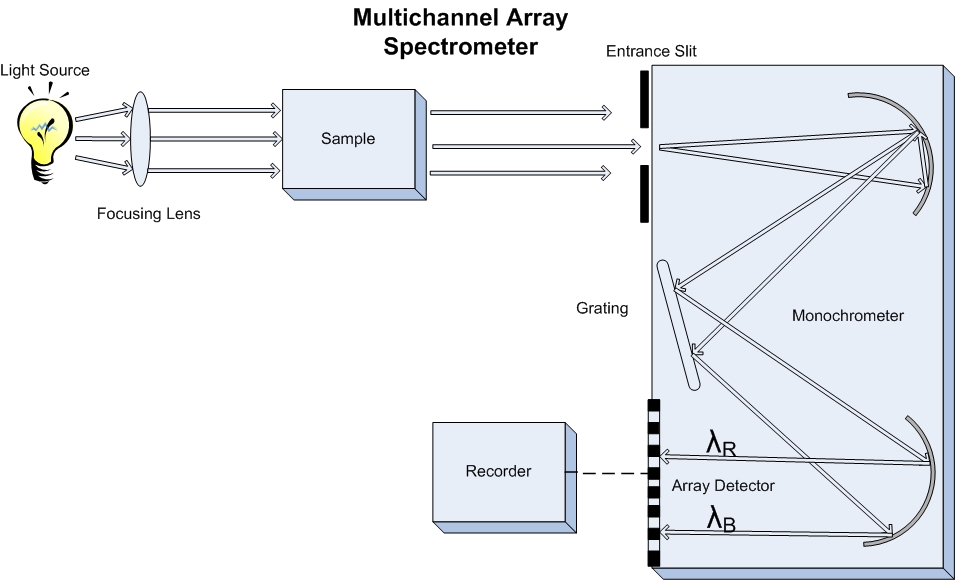
The latest instrument designs use a multichannel detector, such as an array of CID's, that allow for the spectrum of an analyte to be gathered in seconds due to the fact that the light transmitted through the sample can be split and a spectrum of wavelengths can be monitored simultaniously instead of individually. Also fiber optic cables can be used to transfer the light from the source to the sample or from the sample to the dispersion grating and negate the need to consider the slit when thinking about resolution.
Instrumental Noise
As with any instrument, the measurements we make are limited by the tools we use. In spectrophotometers, the only measurement they are designed to monitor is the transmittance of light through the sample. Thus any noise associated with the transmittance will correlate with errors in our analyses. The analysis of the noise in spectrophotometers has been done7 and is outlined by Skoog and others in "Principles of Analytical Chemistry"3. In the outline they summarize that the types of errors commonly experienced fall into three cases and are listed below.
In the first case, the standard deviation of the transmittance is a constant.
\[ S_T=k_1\]
Errors associated with this situation are due to detectors with limited readout resolution and dark currant and amplifier noise. Limited readout resolution keeps the deviation constant because the measurements more precise than the readout can not be expressed or displayed by the machine. Dark Currant and Amplifier noise are only an issue when the lamp intensity and transducer sensitivity are low and random fluctuations in the currant become the dominant source of error.
In the second case, the deviation in transmittance varies with the equation.
\[ S_T=K_2 \sqrt{T^2+T} \]
Errors associated with this equation are those related to shot noise or the transfer of electrons across any sort of junction or barrier like those found in the photomultiplier tube in the detector. Since the currant is dependant on this transfers, which happen randomly, the currant becomes a random distribution that centers around and average. This error becomes considerable when dealing with either really low or really high transmittances.
The last situation deals with errors that relate proportionally to the transmittance. Errors related to this type of noise have to do with source flickering along with cell positioning. Both of these errors can be easily corrected either by attaching a constant voltage source on the lamp or by placing a fixed cuvette holde
\[ S_T=k_3T\]
Other big sources of error can be introduced from the entrance and exit slits not having the appropriate separation or if the experiment being conducted is outside or near the limit of the instrumentation. In older machines, a scan time that was faster than the recording printer could be a source of error as the printer would not be able to record the data as fast it was being given.
References
- G. W Ewing. "Instrumental Methods of Chemical Analysis", 5th Edition, McGraw-Hill 1985
- H. H. Willard, Et Al. "Instrumental Methods of Analysis", 7th Edition, Wadsworth Inc. 1988
- D. A. Skoog, Et Al. "Principles of Instrumental Analysis" 6th Edition, Thomson Brooks/Cole. 2007
- R. A. Serway, J. W. Jewett, "Physics: For Scientists and Engineers with modern physics", Thomson Brooks/Cole, 2004
- G. W. Ewing, J. Cazes, "Ewing's Analytical Instrumentation Handbook", 3rd Edition, Marcel Dekker, 2005
- E. D. Stokes, Et Al. Optics Communications, Vol. 5, Num. 4, 267-270, 1972
- L.D. Rothman, S. R. Crouch, J. D. Ingle. Analytical Chemistry, Vol 47, Num. 8, 1226-1233, 1975


.jpg?revision=1)
.jpg?revision=1&size=bestfit&width=285)
