
5.6: Integration of Proton Spectra
- Page ID
- 432194
\( \newcommand{\vecs}[1]{\overset { \scriptstyle \rightharpoonup} {\mathbf{#1}} } \)
\( \newcommand{\vecd}[1]{\overset{-\!-\!\rightharpoonup}{\vphantom{a}\smash {#1}}} \)
\( \newcommand{\id}{\mathrm{id}}\) \( \newcommand{\Span}{\mathrm{span}}\)
( \newcommand{\kernel}{\mathrm{null}\,}\) \( \newcommand{\range}{\mathrm{range}\,}\)
\( \newcommand{\RealPart}{\mathrm{Re}}\) \( \newcommand{\ImaginaryPart}{\mathrm{Im}}\)
\( \newcommand{\Argument}{\mathrm{Arg}}\) \( \newcommand{\norm}[1]{\| #1 \|}\)
\( \newcommand{\inner}[2]{\langle #1, #2 \rangle}\)
\( \newcommand{\Span}{\mathrm{span}}\)
\( \newcommand{\id}{\mathrm{id}}\)
\( \newcommand{\Span}{\mathrm{span}}\)
\( \newcommand{\kernel}{\mathrm{null}\,}\)
\( \newcommand{\range}{\mathrm{range}\,}\)
\( \newcommand{\RealPart}{\mathrm{Re}}\)
\( \newcommand{\ImaginaryPart}{\mathrm{Im}}\)
\( \newcommand{\Argument}{\mathrm{Arg}}\)
\( \newcommand{\norm}[1]{\| #1 \|}\)
\( \newcommand{\inner}[2]{\langle #1, #2 \rangle}\)
\( \newcommand{\Span}{\mathrm{span}}\) \( \newcommand{\AA}{\unicode[.8,0]{x212B}}\)
\( \newcommand{\vectorA}[1]{\vec{#1}} % arrow\)
\( \newcommand{\vectorAt}[1]{\vec{\text{#1}}} % arrow\)
\( \newcommand{\vectorB}[1]{\overset { \scriptstyle \rightharpoonup} {\mathbf{#1}} } \)
\( \newcommand{\vectorC}[1]{\textbf{#1}} \)
\( \newcommand{\vectorD}[1]{\overrightarrow{#1}} \)
\( \newcommand{\vectorDt}[1]{\overrightarrow{\text{#1}}} \)
\( \newcommand{\vectE}[1]{\overset{-\!-\!\rightharpoonup}{\vphantom{a}\smash{\mathbf {#1}}}} \)
\( \newcommand{\vecs}[1]{\overset { \scriptstyle \rightharpoonup} {\mathbf{#1}} } \)
\( \newcommand{\vecd}[1]{\overset{-\!-\!\rightharpoonup}{\vphantom{a}\smash {#1}}} \)
\(\newcommand{\avec}{\mathbf a}\) \(\newcommand{\bvec}{\mathbf b}\) \(\newcommand{\cvec}{\mathbf c}\) \(\newcommand{\dvec}{\mathbf d}\) \(\newcommand{\dtil}{\widetilde{\mathbf d}}\) \(\newcommand{\evec}{\mathbf e}\) \(\newcommand{\fvec}{\mathbf f}\) \(\newcommand{\nvec}{\mathbf n}\) \(\newcommand{\pvec}{\mathbf p}\) \(\newcommand{\qvec}{\mathbf q}\) \(\newcommand{\svec}{\mathbf s}\) \(\newcommand{\tvec}{\mathbf t}\) \(\newcommand{\uvec}{\mathbf u}\) \(\newcommand{\vvec}{\mathbf v}\) \(\newcommand{\wvec}{\mathbf w}\) \(\newcommand{\xvec}{\mathbf x}\) \(\newcommand{\yvec}{\mathbf y}\) \(\newcommand{\zvec}{\mathbf z}\) \(\newcommand{\rvec}{\mathbf r}\) \(\newcommand{\mvec}{\mathbf m}\) \(\newcommand{\zerovec}{\mathbf 0}\) \(\newcommand{\onevec}{\mathbf 1}\) \(\newcommand{\real}{\mathbb R}\) \(\newcommand{\twovec}[2]{\left[\begin{array}{r}#1 \\ #2 \end{array}\right]}\) \(\newcommand{\ctwovec}[2]{\left[\begin{array}{c}#1 \\ #2 \end{array}\right]}\) \(\newcommand{\threevec}[3]{\left[\begin{array}{r}#1 \\ #2 \\ #3 \end{array}\right]}\) \(\newcommand{\cthreevec}[3]{\left[\begin{array}{c}#1 \\ #2 \\ #3 \end{array}\right]}\) \(\newcommand{\fourvec}[4]{\left[\begin{array}{r}#1 \\ #2 \\ #3 \\ #4 \end{array}\right]}\) \(\newcommand{\cfourvec}[4]{\left[\begin{array}{c}#1 \\ #2 \\ #3 \\ #4 \end{array}\right]}\) \(\newcommand{\fivevec}[5]{\left[\begin{array}{r}#1 \\ #2 \\ #3 \\ #4 \\ #5 \\ \end{array}\right]}\) \(\newcommand{\cfivevec}[5]{\left[\begin{array}{c}#1 \\ #2 \\ #3 \\ #4 \\ #5 \\ \end{array}\right]}\) \(\newcommand{\mattwo}[4]{\left[\begin{array}{rr}#1 \amp #2 \\ #3 \amp #4 \\ \end{array}\right]}\) \(\newcommand{\laspan}[1]{\text{Span}\{#1\}}\) \(\newcommand{\bcal}{\cal B}\) \(\newcommand{\ccal}{\cal C}\) \(\newcommand{\scal}{\cal S}\) \(\newcommand{\wcal}{\cal W}\) \(\newcommand{\ecal}{\cal E}\) \(\newcommand{\coords}[2]{\left\{#1\right\}_{#2}}\) \(\newcommand{\gray}[1]{\color{gray}{#1}}\) \(\newcommand{\lgray}[1]{\color{lightgray}{#1}}\) \(\newcommand{\rank}{\operatorname{rank}}\) \(\newcommand{\row}{\text{Row}}\) \(\newcommand{\col}{\text{Col}}\) \(\renewcommand{\row}{\text{Row}}\) \(\newcommand{\nul}{\text{Nul}}\) \(\newcommand{\var}{\text{Var}}\) \(\newcommand{\corr}{\text{corr}}\) \(\newcommand{\len}[1]{\left|#1\right|}\) \(\newcommand{\bbar}{\overline{\bvec}}\) \(\newcommand{\bhat}{\widehat{\bvec}}\) \(\newcommand{\bperp}{\bvec^\perp}\) \(\newcommand{\xhat}{\widehat{\xvec}}\) \(\newcommand{\vhat}{\widehat{\vvec}}\) \(\newcommand{\uhat}{\widehat{\uvec}}\) \(\newcommand{\what}{\widehat{\wvec}}\) \(\newcommand{\Sighat}{\widehat{\Sigma}}\) \(\newcommand{\lt}{<}\) \(\newcommand{\gt}{>}\) \(\newcommand{\amp}{&}\) \(\definecolor{fillinmathshade}{gray}{0.9}\)Objectives
After completing this section, you should be able to
- explain what information can be obtained from an integrated 1H NMR spectrum, and use this information in the interpretation of such a spectrum.
- use an integrated 1H NMR spectrum to determine the ratio of the different types of protons present in an organic compound.
Integration
In a previous sections 5.4: Types of Protons and 5.5: Chemical Shift, equivalent and nonequivalent hydrogens were discussed as well as unique nonequivalent hydrogens having different chemical shifts. In this section, integration will let the researcher know how many hydrogens there are for each unique NMR absorption. The area of a peak in a 1H NMR is proportional to the number of hydrogens to which the peak corresponds. This is very helpful when determining how many of each unique hydrogen exist and total number of hydrogens present in a molecule. The computer in an NMR instrument can be instructed to automatically integrate the area under a signal or group of signals, so it can be superimposed on the spectrum. The integration curve appears as a series of steps with the height being proportional to the area of the corresponding absorption peak, and the number of protons responsible for the absorption. In practice since it can be difficult to decide exactly where to start and stop, the ratios may not be exact whole numbers. If we look at methyl acetate (below), there are two types of protons that would give two separate peaks in an NMR spectrum. The peaks would integrate to approximately the same area, since both correspond to a set of three equivalent protons.

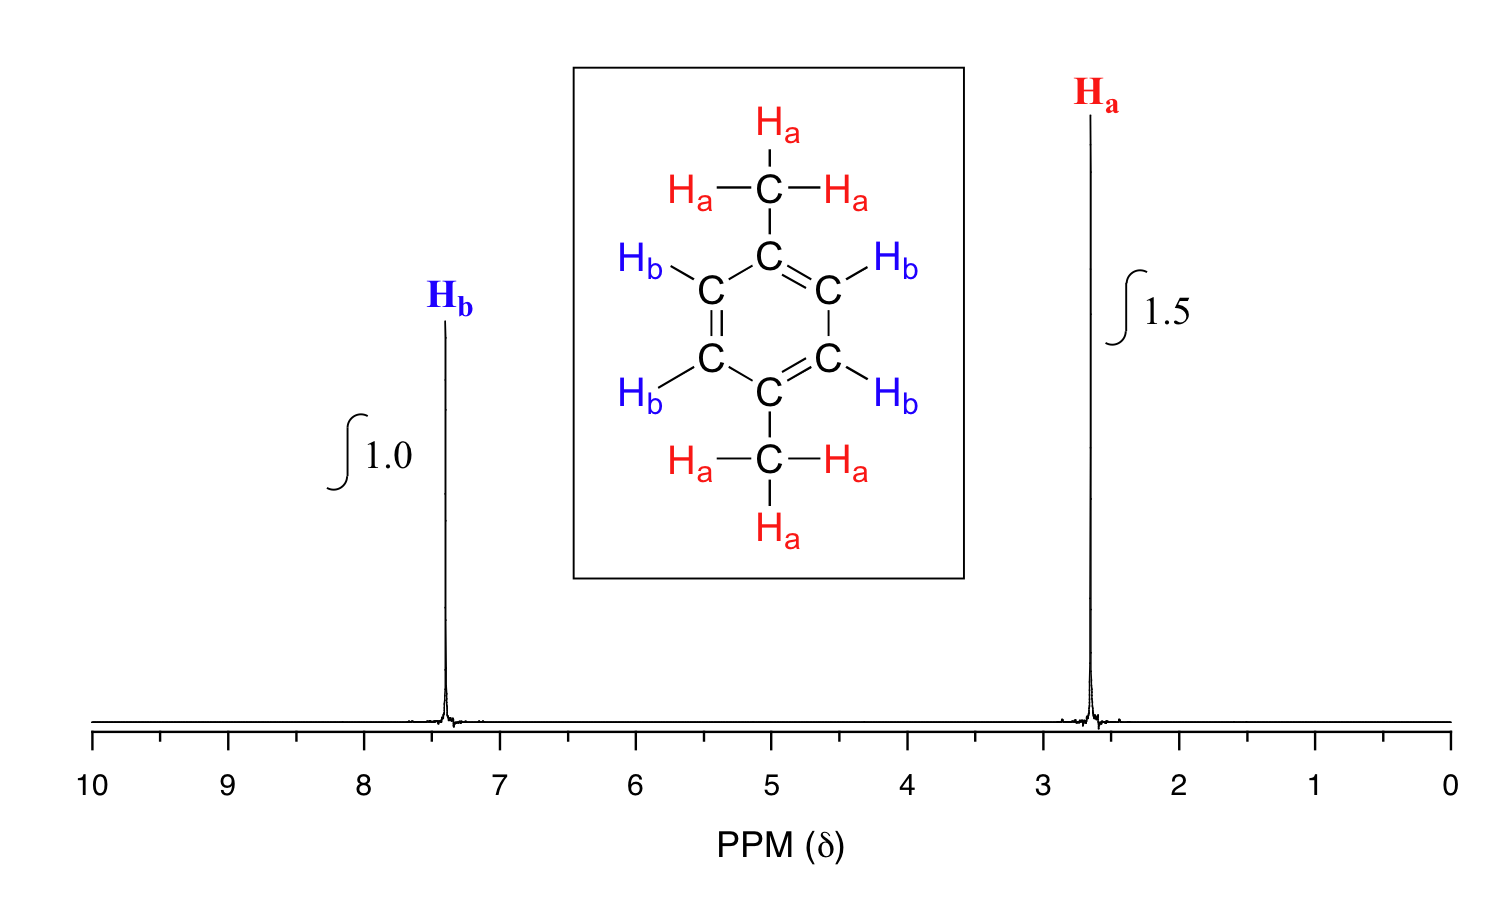
If we look at a spectrum of para-xylene (common name) or 1,4-dimethylbenzene (IUPAC name), how many types of protons are there and what does the ratio mean?
Solution
There are still two signals like in methyl acetate indicating there are two types of hydrogens, but now instead of ratios being about 1 to 1, the ratio is 1 to 1.5. When we instruct the instrument to integrate the areas under the two signals, we find that the area under the peak at 2.6 ppm is 1.5 times greater than the area under the peak at 7.4 ppm. This molecule has two sets of protons: the six methyl (Ha) protons and the four aromatic (Hb) protons, which matches our 1:1.5 ratio since 6 is 1.5 times 4. This (along with the actual chemical shift values, discussed in section 5.5: Chemical Shift) tells us which set of protons corresponds to which NMR signal. The aromatic protons (Hb) are at 7.4 ppm and the methyl protons, Ha, are at 2.6 ppm.
Integration can also be used to determine the relative amounts of two or more compounds in a mixed sample. If we have a sample that is a 50:50 (mole/mole) mixture of benzene and acetone, for example, the acetone signal should integrate to the same value as the benzene sample, because both signals represent six equivalent protons. If we have a 50:50 mixture of acetone and cyclopentane, on the other hand, the ratio of the acetone peak area to the cylopentane peak area will be 3:5 (or 6:10), because the cyclopentane signal represents ten protons.
Exercises
Predict how many signals the following molecule would have and the integrations in 1H NMR? Sketch the spectra and estimate the integration of the peaks.

- Answer
-
There would be two signals. One for Ha that would integrate to 6 and another for Hb that would integrate to 4.

Ideal general spectrum shown with integration (below).
Using integration, how could you determine the difference between these two molecules.
 vs.
vs. 
- Answer
-
The two will have very similar chemical shifts for their protons, but the total number of protons will be different. If you add up all the integrations, then you will get the total number of hydrogens for each molecule. The first molecule has 14 total protons, while the second molecule has 18 total protons.
You take the 1H-NMR spectrum of a mixed sample of 36% para-xylene and 64% acetone in CDCl3 solvent. How many peaks do you expect to see? What is the expected ratio of integration values for these peaks? (set the acetone peak integration equal to 1.0)
- Answer
-
There are three peaks: two from para-xylene and one from acetone. The acetone peak and the para-xylene methyl peak both represent six protons, so the ratio of their integration values is simply 64 to 36 or 1 (64/64) to 0.56 (36/64). The ratio of the para-xylene methyl peak to the para-xylene aromatic peak is 6 to 4 (1.5: 1 ratio), or 0.56 to 0.37 (still 1.5: 1 ratio). So the final integral ratio of acetone:methyl:aromatic signals should be 1 to 0.56 to 0.37.
Contributors and Attributions
Dr. Dietmar Kennepohl FCIC (Professor of Chemistry, Athabasca University)
Prof. Steven Farmer (Sonoma State University)
Organic Chemistry With a Biological Emphasis by Tim Soderberg (University of Minnesota, Morris)