
5.5: Chemical Shift
- Page ID
- 432193
\( \newcommand{\vecs}[1]{\overset { \scriptstyle \rightharpoonup} {\mathbf{#1}} } \)
\( \newcommand{\vecd}[1]{\overset{-\!-\!\rightharpoonup}{\vphantom{a}\smash {#1}}} \)
\( \newcommand{\id}{\mathrm{id}}\) \( \newcommand{\Span}{\mathrm{span}}\)
( \newcommand{\kernel}{\mathrm{null}\,}\) \( \newcommand{\range}{\mathrm{range}\,}\)
\( \newcommand{\RealPart}{\mathrm{Re}}\) \( \newcommand{\ImaginaryPart}{\mathrm{Im}}\)
\( \newcommand{\Argument}{\mathrm{Arg}}\) \( \newcommand{\norm}[1]{\| #1 \|}\)
\( \newcommand{\inner}[2]{\langle #1, #2 \rangle}\)
\( \newcommand{\Span}{\mathrm{span}}\)
\( \newcommand{\id}{\mathrm{id}}\)
\( \newcommand{\Span}{\mathrm{span}}\)
\( \newcommand{\kernel}{\mathrm{null}\,}\)
\( \newcommand{\range}{\mathrm{range}\,}\)
\( \newcommand{\RealPart}{\mathrm{Re}}\)
\( \newcommand{\ImaginaryPart}{\mathrm{Im}}\)
\( \newcommand{\Argument}{\mathrm{Arg}}\)
\( \newcommand{\norm}[1]{\| #1 \|}\)
\( \newcommand{\inner}[2]{\langle #1, #2 \rangle}\)
\( \newcommand{\Span}{\mathrm{span}}\) \( \newcommand{\AA}{\unicode[.8,0]{x212B}}\)
\( \newcommand{\vectorA}[1]{\vec{#1}} % arrow\)
\( \newcommand{\vectorAt}[1]{\vec{\text{#1}}} % arrow\)
\( \newcommand{\vectorB}[1]{\overset { \scriptstyle \rightharpoonup} {\mathbf{#1}} } \)
\( \newcommand{\vectorC}[1]{\textbf{#1}} \)
\( \newcommand{\vectorD}[1]{\overrightarrow{#1}} \)
\( \newcommand{\vectorDt}[1]{\overrightarrow{\text{#1}}} \)
\( \newcommand{\vectE}[1]{\overset{-\!-\!\rightharpoonup}{\vphantom{a}\smash{\mathbf {#1}}}} \)
\( \newcommand{\vecs}[1]{\overset { \scriptstyle \rightharpoonup} {\mathbf{#1}} } \)
\( \newcommand{\vecd}[1]{\overset{-\!-\!\rightharpoonup}{\vphantom{a}\smash {#1}}} \)
\(\newcommand{\avec}{\mathbf a}\) \(\newcommand{\bvec}{\mathbf b}\) \(\newcommand{\cvec}{\mathbf c}\) \(\newcommand{\dvec}{\mathbf d}\) \(\newcommand{\dtil}{\widetilde{\mathbf d}}\) \(\newcommand{\evec}{\mathbf e}\) \(\newcommand{\fvec}{\mathbf f}\) \(\newcommand{\nvec}{\mathbf n}\) \(\newcommand{\pvec}{\mathbf p}\) \(\newcommand{\qvec}{\mathbf q}\) \(\newcommand{\svec}{\mathbf s}\) \(\newcommand{\tvec}{\mathbf t}\) \(\newcommand{\uvec}{\mathbf u}\) \(\newcommand{\vvec}{\mathbf v}\) \(\newcommand{\wvec}{\mathbf w}\) \(\newcommand{\xvec}{\mathbf x}\) \(\newcommand{\yvec}{\mathbf y}\) \(\newcommand{\zvec}{\mathbf z}\) \(\newcommand{\rvec}{\mathbf r}\) \(\newcommand{\mvec}{\mathbf m}\) \(\newcommand{\zerovec}{\mathbf 0}\) \(\newcommand{\onevec}{\mathbf 1}\) \(\newcommand{\real}{\mathbb R}\) \(\newcommand{\twovec}[2]{\left[\begin{array}{r}#1 \\ #2 \end{array}\right]}\) \(\newcommand{\ctwovec}[2]{\left[\begin{array}{c}#1 \\ #2 \end{array}\right]}\) \(\newcommand{\threevec}[3]{\left[\begin{array}{r}#1 \\ #2 \\ #3 \end{array}\right]}\) \(\newcommand{\cthreevec}[3]{\left[\begin{array}{c}#1 \\ #2 \\ #3 \end{array}\right]}\) \(\newcommand{\fourvec}[4]{\left[\begin{array}{r}#1 \\ #2 \\ #3 \\ #4 \end{array}\right]}\) \(\newcommand{\cfourvec}[4]{\left[\begin{array}{c}#1 \\ #2 \\ #3 \\ #4 \end{array}\right]}\) \(\newcommand{\fivevec}[5]{\left[\begin{array}{r}#1 \\ #2 \\ #3 \\ #4 \\ #5 \\ \end{array}\right]}\) \(\newcommand{\cfivevec}[5]{\left[\begin{array}{c}#1 \\ #2 \\ #3 \\ #4 \\ #5 \\ \end{array}\right]}\) \(\newcommand{\mattwo}[4]{\left[\begin{array}{rr}#1 \amp #2 \\ #3 \amp #4 \\ \end{array}\right]}\) \(\newcommand{\laspan}[1]{\text{Span}\{#1\}}\) \(\newcommand{\bcal}{\cal B}\) \(\newcommand{\ccal}{\cal C}\) \(\newcommand{\scal}{\cal S}\) \(\newcommand{\wcal}{\cal W}\) \(\newcommand{\ecal}{\cal E}\) \(\newcommand{\coords}[2]{\left\{#1\right\}_{#2}}\) \(\newcommand{\gray}[1]{\color{gray}{#1}}\) \(\newcommand{\lgray}[1]{\color{lightgray}{#1}}\) \(\newcommand{\rank}{\operatorname{rank}}\) \(\newcommand{\row}{\text{Row}}\) \(\newcommand{\col}{\text{Col}}\) \(\renewcommand{\row}{\text{Row}}\) \(\newcommand{\nul}{\text{Nul}}\) \(\newcommand{\var}{\text{Var}}\) \(\newcommand{\corr}{\text{corr}}\) \(\newcommand{\len}[1]{\left|#1\right|}\) \(\newcommand{\bbar}{\overline{\bvec}}\) \(\newcommand{\bhat}{\widehat{\bvec}}\) \(\newcommand{\bperp}{\bvec^\perp}\) \(\newcommand{\xhat}{\widehat{\xvec}}\) \(\newcommand{\vhat}{\widehat{\vvec}}\) \(\newcommand{\uhat}{\widehat{\uvec}}\) \(\newcommand{\what}{\widehat{\wvec}}\) \(\newcommand{\Sighat}{\widehat{\Sigma}}\) \(\newcommand{\lt}{<}\) \(\newcommand{\gt}{>}\) \(\newcommand{\amp}{&}\) \(\definecolor{fillinmathshade}{gray}{0.9}\)Objectives
After completing this section, you should be able to
- understand why the delta scale is used in NMR spectroscopy.
- explain how chemical environment of the proton is related to the chemical shift.
- understand how to read a table of the approximate chemical shift (δ) for protons
- predict the approximate chemical shifts of each of the protons in an organic compound, given its structure and a table of chemical shift correlations.
Key Terms
Make certain that you can define, and use in context, the key terms below.
- chemical shift
- delta scale
- upfield/downfield
Study Notes
Although the calculations described in this section will help you understand the principles of NMR, it is the actual delta values, not the calculations, which are of greatest importance to the beginning organic chemist. Thus, we shall try to focus on the interpretation of NMR spectra, not the mathematical aspects of the technique.
You should not attempt to memorize the chemical shifts listed in the table of this section, you will refer to it quite frequently throughout your analysis of spectra. However, if you have an approximate idea of the chemical shifts of some of the most common types of protons, you will find the interpretation of 1H NMR spectra less arduous than it might otherwise be.
NMR spectra are displayed on a plot that shows the applied field strength increasing from left to right. The left side of the plot is low-field or downfield and the right side of the plot is high-field or upfield. The different local chemical environments surrounding any particular nuclei causes them to resonate at slightly different frequencies. This is a result of a nucleus being more or less shielded than another. There are structural features of the molecule will have an effect on the exact magnitude of the magnetic field experienced by a particular nucleus causing an upfield or downfield shift. This means that nuclei which have different chemical environments will show up in different regions of the NMR plot or spectrum. This is what makes NMR so useful for structure determination in organic chemistry. There are three main features that will effect the shielding of the nucleus: 1) electronegativity, 2) magnetic anisotropy of π systems (Section 5.2) and 3) hydrogen bonding. The position on the spectrum at which a nucleus absorbs is called its chemical shift (δ).
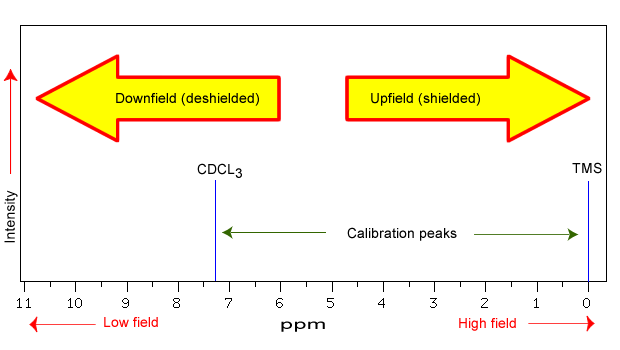
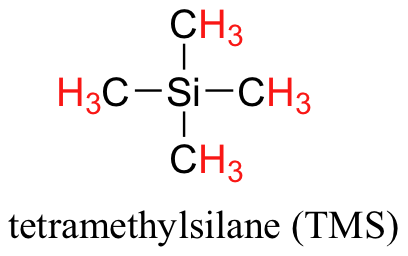
The chemical shift is dependent on the applied field of the spectrometer and as discussed in Section 5.2, there are a variety of spectrometers. Therefore, if you were to run the same sample in a 300 MHz spectrometer and a 600 MHz spectrometer, the same proton would give a different chemical shift in Hertz (Hz). It would be inconvenient and confusing to always have to convert NMR data according to the field strength of the instrument used. Luckily, chemists report resonance frequencies not as absolute values in Hz, but rather as values relative to a common standard, generally the signal generated by the protons in tetramethylsilane (TMS). TMS (structure below) was chosen as a standard because it is chemically inert, symmetrical, volatile (bp = 27 C), and soluble in most organic solvents. Most importantly, it gives a single absorption peak and its protons are more shielded than almost all organic protons. Remember - more shielded means more toward the right of the spectrum and a lower chemical shift. With a standard in place, the units parts per million (ppm) comes in to play. Regardless of the magnetic field strength of the instrument being used, the resonance frequency of the 12 equivalent protons in TMS is defined as a zero point. The resonance frequencies of protons in the sample molecule are then reported in terms of how much higher they are, in ppm, relative to the TMS signal. Now whether a 300 MHz instrument was used or a 600 MHz instrument, the same peak report out at the same chemical shift in ppm. The equation below shows the conversion from Hertz (Hz) to part per million (ppm). Chemical shifts can be used to identify structural properties in a molecule based on our understanding of different chemical environments.

For CHCl3, there is a peak at 1451 Hz in a H1 NMR spectra from a 400 MHz spectrometer. Convert to δ (ppm) units.
Solution
δ = ((1451 Hz - 0 Hz)/400,000,000 Hz) x 106 ppm = 3.627 ppm
Remember: TMS is our standard and is set to 0 Hz (or 0 ppm).
Chemical Shifts in 1H NMR Spectroscopy
The NMR spectra is displayed as a plot of the applied radiofrequency versus the absorption. In 1H NMR spectra, the typical range for protons is 0 to 14 ppm. Let's look at an actual 1H-NMR plot for methyl acetate. Just as in IR and UV-Vis spectroscopy, the vertical axis corresponds to intensity of absorbance (typically not shown in an NMR spectrum) and the horizontal axis to frequency.

We see three absorbance signals: two of these correspond to Ha and Hb, while the peak at the far right of the spectrum corresponds to the 12 chemically equivalent protons in TMS. In the spectrum above, you can see that each methyl group has a different chemical shift, so the 1H nuclei must be in different chemical environments. The two methyl groups are attached to different functionalities, which causes a difference in the shielding for each methyl group, creating the unique 1H environments. The main difference is how close each methyl group is to an electronegative atom in methyl acetate.
Electronegativity
If you remember from Section 5.2, the electrons that surround the nucleus are in motion creating their own electromagnetic field. If this field opposes the the applied magnetic field, it reduces the magnetic field experienced by the nucleus. Thus the electrons are said to shield the nucleus. Since the magnetic field experienced at the nucleus defines the energy difference between spin states it also defines what the chemical shift will be for that nucleus. Electron with-drawing groups can decrease the electron density at the nucleus, deshielding the nucleus, resulting in a larger chemical shift. Let's look at some data in the table below.
| Compound, CH3X | CH3F | CH3OH | CH3Cl | CH3Br | CH3I | CH4 | (CH3)4Si |
| Electronegativity of X | 4.0 | 3.5 | 3.1 | 2.8 | 2.5 | 2.1 | 1.8 |
| Chemical shift, δ (ppm) | 4.26 | 3.4 | 3.05 | 2.68 | 2.16 | 0.23 | 0 |
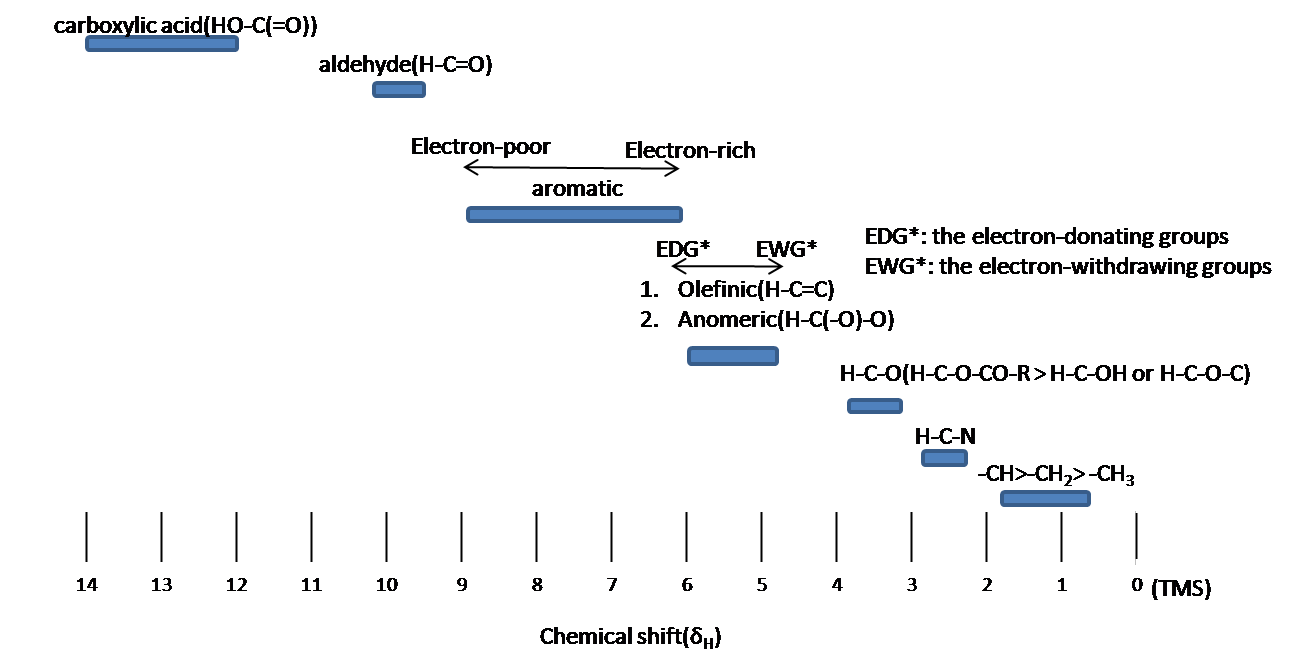
As can be seen from the data, as the electronegativity of X increases the chemical shift, δ. This is an effect of the electronegative atom pulling the electron density away from the nuclei of 1H atoms and exposing them more to the magnetic field, which "deshields" the nuclei and shifting the peak downfield. Looking back at the two methyl groups in methyl acetate, the methyl group directly attached to the oxygen atom brings that signal further downfield to about 3.6 ppm, while the methyl group attached to the carbonyl group, putting an additional carbon atom between the electron-withdrawing oxygen and the 1H nuclei and thus there is less of an electron withdrawing effect on the nuclei, so they are more shielded. This leads the signal to be more upfield around 2 ppm. The diagram below shows where protons that are part of or near different organic functional groups generally show up on an NMR spectrum.
The effects of electron withdrawing groups are cumulative so the presence of more electron withdrawing groups will produce greater deshielding and therefore a larger chemical shift. As you can see in the table below, the more electronegative chlorine atoms present, increases the chemical shift. In general, the more electronegative atoms present in the environment, the more exposed the nuclei becomes and thus more deshielded.
| Compound | CH4 | CH3Cl | CH2Cl2 | CHCl3 |
| δ (ppm) | 0.23 | 3.05 | 5.30 | 7.27 |
These inductive effects are not only felt by the immediately adjacent atoms, but also the deshielding can occur further down the chain. The effect lessens the further away the nuclei is from the electronegative atom and after about three bonds away is not felt much any more. In the piece of a molecule below, you can see this trend. The protons closes to the bromine atom are more downfield at 3.30 ppm and an upfield shift occurs with the protons attached to carbons 2 bonds and 3 bonds away from the bromine.
| NMR signal | -CH2-CH2-CH2Br |
| δ (ppm) | 1.25, 1.69, 3.30 |
Another way to view chemical shift data is in a table. You will notice that there are ranges. The range is where the proton peak may generally occur.
|
Hydrogen type |
Chemical shift (ppm) |
|
RCH3 |
0.9 - 1.0 |
|
RCH2R |
1.2 - 1.7 |
|
R3CH |
1.5 – 2.3 |
|
|
1.5 – 1.8 |
|
RNH2 |
1 - 3 |
|
ArCH3 |
2.2 – 2.4 |
|
|
2.3 – 3.0 |
|
ROCH3 |
3.2 – 3.8 |
|
|
3.7 – 3.9 |
|
ROH |
2 - 5 |
|
|
5.0 – 6.5 |
|
|
5 - 9 |
|
ArH |
6.0 – 8 |
|
|
9 – 10.0 |
|
|
10 - 13 |


Calculate the chemical shift for the protons in ethanol (CH3CH2OH) using the table above.
Solution
-OH proton = between 1-5 ppm
-CH2- protons = 3.2-3.8 ppm
-CH3 protons = > 0.9-1.0 ppm, since the methyl group is not directly attached to the electron-withdrawing group it will not feel the pull away of electron density as much as the methylene group, but it is still close enough to feel it a bit. This means the methyl group will be slightly higher than expected.
Below is an actual image of the NMR spectrum of ethanol. Our predicted values do align with the actual spectral data. The OH actually shows at 3.71 ppm, which is between 1-5ppm as predicted, the methylene occurs at 3.60 ppm also falls within the predicted rage of 3.2-3.8 ppm, and the methyl group does fall just higher than the predicted 0.9-1.0 ppm at 1.16 ppm.

Magnetic Anisotropy: π Electron Effects
The π electrons in a compound, when placed in a magnetic field, will move and generate their own magnetic field. The new magnetic field will have an effect on the shielding of atoms within the field. The best example of this is benzene (see the figure below). Also, see Section 5.2 for more details on generating magnetic fields.

This effect is common for any atoms near a π bond.
| Proton Type | Effect | Chemical shift (ppm) |
| C6H5-H | highly deshielded | 6.5 - 8 |
| C=C-H | deshielded | 5 - 6.5 |
| C≡C-H | shielded* | ~2.5 |
| O=C-H | very highly deshielded | 9 - 10 |
| * the acetylene H is shielded due to its location relative to the π system | ||
The chemical shift for the highlighted proton Ha is 8.8 ppm, whereas the chemical shift for each of the other protons explicitly shown is between 7.3-8.0 ppm. Provide an explanation for this downfield shift of Ha.


Solution
Ha feels the benzene pi system as do all the other hydrogens on naphthalene. The difference is that it also feels the pi system from the carbonyl as well, which brings Ha further downfield than the other hydrogens.
Hydrogen Bonding
Protons that are involved in hydrogen bonding (i.e.-OH or -NH) are usually observed over a wide range of chemical shifts. This is due to the deshielding that occurs in the hydrogen bond. Since hydrogen bonds are dynamic, constantly forming, breaking and forming again, there will be a wide range of hydrogen bonds strengths and consequently a wide range of deshielding. This exchange is faster than the time it takes to acquire a 1H NMR spectrum. This, as well as, solvation effects, acidity, concentration and temperature make it very difficult to predict the chemical shifts for these atoms. The exchange process is facilitated by even traces of acid or base in the sample. The functional groups affected are alcohols, carboxylic acids, amines, and amides.
Experimentally -OH and -NH can be identified by carrying out a simple D2O exchange experiment since these protons are exchangeable.
- run the normal H-NMR experiment on your sample
- add a few drops of D2O
- re-run the H-NMR experiment
- compare the two spectra and look for peaks that have "disappeared"
Exercise
The following peaks were from a 1H NMR spectra from a 300 MHz spectrometer. Convert to δ units (ppm).
a) CH3OH: 693 Hz
b) CH2Cl2: 1060 Hz
- Answer
-
a) δ = ((693 Hz - x 0 Hz)/400,000,000 Hz) x 106 ppm = 1.73 ppm
b) δ = ((1060 Hz - x 0 Hz)/400,000,000 Hz) x 106 ppm = 2.65 ppm
Butan-2-one shows a chemical shift around 2.1 on a 300 MHz spectrometer in the H1 NMR spectrum.
a) How far downfield is this peak from TMS in Hz?
b) If the spectrum was done with a 400 MHz instrument, would a different chemical shift be seen?
c) On this new 400 MHz spectrum, what would be the difference in Hz from the chemical shift and TMS?
- Answer
-
a) (2.1 ppm x 300000000 Hz)/106 ppm = 630 Hz The peak at 2.1 ppm would show at 630 Hz on a 300 MHz spectrometer. TMS is always at 0 Hz, so the peak would be 630 Hz downfield from TMS.
b) No, a different chemical shift would not be seen in ppm. The point of using the ppm scale is to be able to discuss the same peak at the same chemical shift unlike when using Hertz.
c) (2.1 ppm x 400000000 Hz)/106 ppm = 840 Hz The 2.1 ppm peak would show at 840 Hz on a 400 MHz spectrometer.
The following have one H1 NMR peak. In each case predict approximately where this peak would be in a spectra.
a) 
b) 
- Answer
-
a) 1.2-1.7 ppm
b) 6.0-8.0 ppm
Identify the different equivalent protons in the following molecule and predict their expected chemical shift.

- Answer
-

There are 6 different protons in this molecule.
Proton Predicted Chemical Shift (ppm) from Table Actual Chemical Shift (ppm) Data Ha 1.5-1.8 1.72 Hb 5.0-6.5 6.03 Hc 5.0-6.5 6.26 Hd 6.5-8 7.33 He 6.5-8 7.19 Hf 6.5-8 7.22
Which methyl group would you expect to be more downfield on the molecule below.

- Answer
-

The methyl group directly attached to the oxygen will be further downfield (predicted 3.2-3.8 ppm) versus the methyl group directly attached to a double bond (predicted 1.5-1.8 ppm).
Contributors and Attributions
Dr. Dietmar Kennepohl FCIC (Professor of Chemistry, Athabasca University)
Prof. Steven Farmer (Sonoma State University)