6.4: Acid-base equilibrium
- Page ID
- 371801

\( \newcommand{\vecs}[1]{\overset { \scriptstyle \rightharpoonup} {\mathbf{#1}} } \)
\( \newcommand{\vecd}[1]{\overset{-\!-\!\rightharpoonup}{\vphantom{a}\smash {#1}}} \)
\( \newcommand{\id}{\mathrm{id}}\) \( \newcommand{\Span}{\mathrm{span}}\)
( \newcommand{\kernel}{\mathrm{null}\,}\) \( \newcommand{\range}{\mathrm{range}\,}\)
\( \newcommand{\RealPart}{\mathrm{Re}}\) \( \newcommand{\ImaginaryPart}{\mathrm{Im}}\)
\( \newcommand{\Argument}{\mathrm{Arg}}\) \( \newcommand{\norm}[1]{\| #1 \|}\)
\( \newcommand{\inner}[2]{\langle #1, #2 \rangle}\)
\( \newcommand{\Span}{\mathrm{span}}\)
\( \newcommand{\id}{\mathrm{id}}\)
\( \newcommand{\Span}{\mathrm{span}}\)
\( \newcommand{\kernel}{\mathrm{null}\,}\)
\( \newcommand{\range}{\mathrm{range}\,}\)
\( \newcommand{\RealPart}{\mathrm{Re}}\)
\( \newcommand{\ImaginaryPart}{\mathrm{Im}}\)
\( \newcommand{\Argument}{\mathrm{Arg}}\)
\( \newcommand{\norm}[1]{\| #1 \|}\)
\( \newcommand{\inner}[2]{\langle #1, #2 \rangle}\)
\( \newcommand{\Span}{\mathrm{span}}\) \( \newcommand{\AA}{\unicode[.8,0]{x212B}}\)
\( \newcommand{\vectorA}[1]{\vec{#1}} % arrow\)
\( \newcommand{\vectorAt}[1]{\vec{\text{#1}}} % arrow\)
\( \newcommand{\vectorB}[1]{\overset { \scriptstyle \rightharpoonup} {\mathbf{#1}} } \)
\( \newcommand{\vectorC}[1]{\textbf{#1}} \)
\( \newcommand{\vectorD}[1]{\overrightarrow{#1}} \)
\( \newcommand{\vectorDt}[1]{\overrightarrow{\text{#1}}} \)
\( \newcommand{\vectE}[1]{\overset{-\!-\!\rightharpoonup}{\vphantom{a}\smash{\mathbf {#1}}}} \)
\( \newcommand{\vecs}[1]{\overset { \scriptstyle \rightharpoonup} {\mathbf{#1}} } \)
\( \newcommand{\vecd}[1]{\overset{-\!-\!\rightharpoonup}{\vphantom{a}\smash {#1}}} \)
\(\newcommand{\avec}{\mathbf a}\) \(\newcommand{\bvec}{\mathbf b}\) \(\newcommand{\cvec}{\mathbf c}\) \(\newcommand{\dvec}{\mathbf d}\) \(\newcommand{\dtil}{\widetilde{\mathbf d}}\) \(\newcommand{\evec}{\mathbf e}\) \(\newcommand{\fvec}{\mathbf f}\) \(\newcommand{\nvec}{\mathbf n}\) \(\newcommand{\pvec}{\mathbf p}\) \(\newcommand{\qvec}{\mathbf q}\) \(\newcommand{\svec}{\mathbf s}\) \(\newcommand{\tvec}{\mathbf t}\) \(\newcommand{\uvec}{\mathbf u}\) \(\newcommand{\vvec}{\mathbf v}\) \(\newcommand{\wvec}{\mathbf w}\) \(\newcommand{\xvec}{\mathbf x}\) \(\newcommand{\yvec}{\mathbf y}\) \(\newcommand{\zvec}{\mathbf z}\) \(\newcommand{\rvec}{\mathbf r}\) \(\newcommand{\mvec}{\mathbf m}\) \(\newcommand{\zerovec}{\mathbf 0}\) \(\newcommand{\onevec}{\mathbf 1}\) \(\newcommand{\real}{\mathbb R}\) \(\newcommand{\twovec}[2]{\left[\begin{array}{r}#1 \\ #2 \end{array}\right]}\) \(\newcommand{\ctwovec}[2]{\left[\begin{array}{c}#1 \\ #2 \end{array}\right]}\) \(\newcommand{\threevec}[3]{\left[\begin{array}{r}#1 \\ #2 \\ #3 \end{array}\right]}\) \(\newcommand{\cthreevec}[3]{\left[\begin{array}{c}#1 \\ #2 \\ #3 \end{array}\right]}\) \(\newcommand{\fourvec}[4]{\left[\begin{array}{r}#1 \\ #2 \\ #3 \\ #4 \end{array}\right]}\) \(\newcommand{\cfourvec}[4]{\left[\begin{array}{c}#1 \\ #2 \\ #3 \\ #4 \end{array}\right]}\) \(\newcommand{\fivevec}[5]{\left[\begin{array}{r}#1 \\ #2 \\ #3 \\ #4 \\ #5 \\ \end{array}\right]}\) \(\newcommand{\cfivevec}[5]{\left[\begin{array}{c}#1 \\ #2 \\ #3 \\ #4 \\ #5 \\ \end{array}\right]}\) \(\newcommand{\mattwo}[4]{\left[\begin{array}{rr}#1 \amp #2 \\ #3 \amp #4 \\ \end{array}\right]}\) \(\newcommand{\laspan}[1]{\text{Span}\{#1\}}\) \(\newcommand{\bcal}{\cal B}\) \(\newcommand{\ccal}{\cal C}\) \(\newcommand{\scal}{\cal S}\) \(\newcommand{\wcal}{\cal W}\) \(\newcommand{\ecal}{\cal E}\) \(\newcommand{\coords}[2]{\left\{#1\right\}_{#2}}\) \(\newcommand{\gray}[1]{\color{gray}{#1}}\) \(\newcommand{\lgray}[1]{\color{lightgray}{#1}}\) \(\newcommand{\rank}{\operatorname{rank}}\) \(\newcommand{\row}{\text{Row}}\) \(\newcommand{\col}{\text{Col}}\) \(\renewcommand{\row}{\text{Row}}\) \(\newcommand{\nul}{\text{Nul}}\) \(\newcommand{\var}{\text{Var}}\) \(\newcommand{\corr}{\text{corr}}\) \(\newcommand{\len}[1]{\left|#1\right|}\) \(\newcommand{\bbar}{\overline{\bvec}}\) \(\newcommand{\bhat}{\widehat{\bvec}}\) \(\newcommand{\bperp}{\bvec^\perp}\) \(\newcommand{\xhat}{\widehat{\xvec}}\) \(\newcommand{\vhat}{\widehat{\vvec}}\) \(\newcommand{\uhat}{\widehat{\uvec}}\) \(\newcommand{\what}{\widehat{\wvec}}\) \(\newcommand{\Sighat}{\widehat{\Sigma}}\) \(\newcommand{\lt}{<}\) \(\newcommand{\gt}{>}\) \(\newcommand{\amp}{&}\) \(\definecolor{fillinmathshade}{gray}{0.9}\)Most of the acid-base reactions are equilibrium reactions, i.e., the reactants form the products, and the products react to re-form the reactants. The reaction is shown with double arrows to indicate that both the forward and the reverse reactions happen simultaneously.
Pre-equilibrium and equilibrium
Initially, there are only reactants present. The concentration of the reactants decreases over time as they convert to the products. The rate of the reaction is proportional to the concentration of the reactants. So, the rate of the forward reaction decreases over time. The products build up over time. The products react with each other to re-form the reactants, i.e., the reverse reaction. The rate of the reverse reaction increases over time as the concentration of the products increases, until the rate of reverse reaction becomes equal to the rate of the forward reaction, as illustrated in Fig. 6.4.1
- At the beginning of the equilibrium when the rate of the reverse reaction is slower than the rate of forward reaction is the pre-equilibrium phase.
- The equilibrium phaes starts at the point when the rate of reverse reaction becomes equal to the rate of the forward reaction
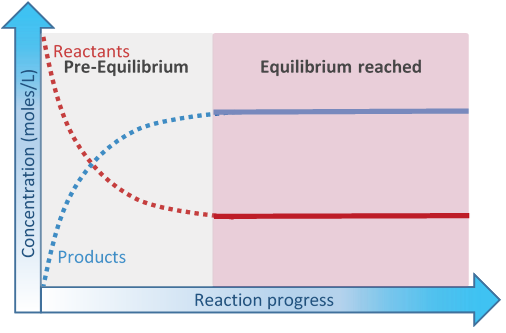
At the point when the rate of reverse reaction becomes equal to the rate of the forward reaction, equilibrium has reached. The concentration of the reactants and products do not change at equilibrium because they are consumed and re-formed at the same rate –it is a dynamic equilibrium.
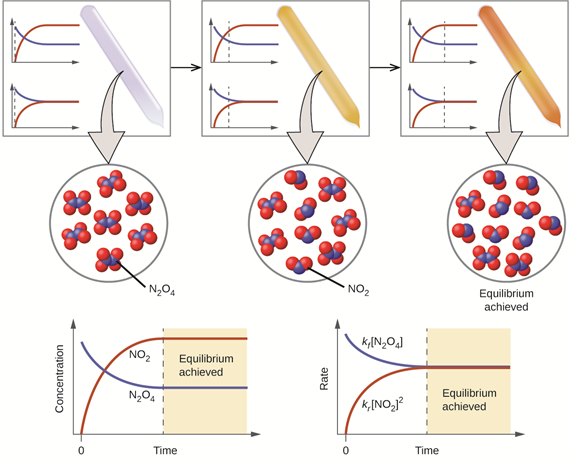
The equilibrium reactions are not limited to acid-base reactions; they are common in all types of chemical reactions. Fig. 6.4.2 illustrates the concentrations and rates of reactions changes in pre-equilibrium and equilibrium phases with the help of an actual chemical equilibrium reaction between a decomposition reaction of a colorless gas N2O4 and its reverse reaction, i.e., a combination reaction of brown color gas NO2.
What happens when a chemical equilibrium is disturbed?
The concentration of the reactants and products does not change in the mixture when the reaction is at equilibrium because the rate of the forward reaction is equal to the rate of the reverse reaction. Any change made at the equilibrium adds stress to the equilibrium. The system moves in a way to relieve the stress. For example, if one of the reactants is added to the mixture, the rate of forward reaction increases removing the added reactant until a new equilibrium establishes, i.e., the system relieves the stress by removing the added reactant.
If a chemical equilibrium is disturbed, the rates of forward and reverse reactions change to relieve the stress and re-establish the equilibrium.
The stresses can be changes in the concentration, pressure, or temperature, as explained in the following section.
Effect of concentration on a chemical equilibrium
The following are the consequences of concentration changes on a chemical reaction at equilibrium.
- If a reactant is added, the forward reaction increases to remove the reactant.
- If a reactant is removed, the forward reaction decreases; consequently, the reverse reaction adds the reactant.
- If a product is added, the reverse reaction increases to remove the product.
- If a product is removed, the reverse reaction decreases; consequently, the forward reaction adds the product.
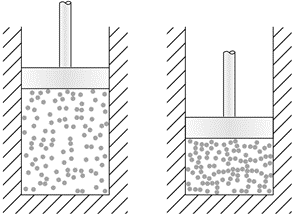
Fig. 6.4.3 illustrates the effects with the help of water level in two tanks connected through a conduit in the left tank representing reactants and in the right tank representing products.
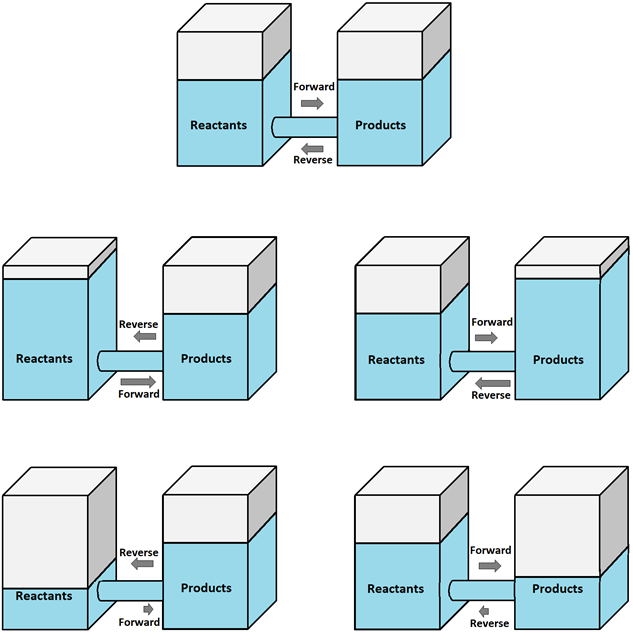
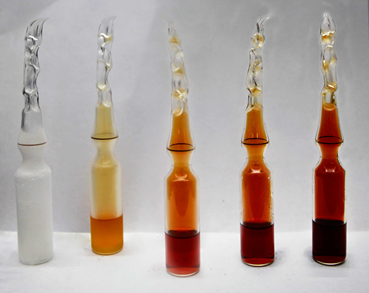
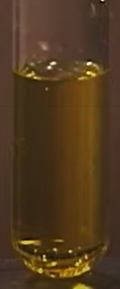
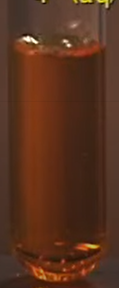
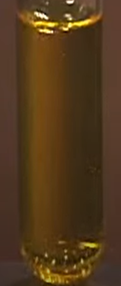
Fig 6.4.4 demonstrates the effect of concentration change on the chemical equilibrium between brown dichromate ions and yellow chromate ions:
\begin{equation}
\mathrm{Cr}_{2} \mathrm{O}_{7}^{2-}(\mathrm{aq}, \text { brown })+\mathrm{H}_{2} \mathrm{O}(\mathrm{I}) \rightleftarrows 2 \mathrm{CrO}_{4}^{2-}(\mathrm{aq} \text {, yellow })+2 \mathrm{H}^{+}(\mathrm{aq})\nonumber
\end{equation}
The addition of acid to the test tube on the left increases H+ in the system, increasing reverse reaction, which can be observed by the increased brown color in the middle test tube. Then, the addition of a base removes H+ from the system by an acid-base reaction: \(\mathrm{H}^{+}+\mathrm{OH}^{-} \rightarrow \mathrm{H}_{2} \mathrm{O}\). The decrease in H+ shifts the equilibrium to the product side, which can be observed by the increased yellow color in the test tube on the right.
A practical example of the effect of concentration on a chemical equilibrium is the binding of oxygen (O2) with hemoglobin (Hb) during the breathing process.
\begin{equation}
\mathrm{Hb}(\mathrm{aq})+\mathrm{O}_{2}(\mathrm{~g}) \rightleftarrows \mathrm{HbO}_{2}(\mathrm{aq})\nonumber
\end{equation}
The concentration of oxygen is higher in the lunges that shift the equilibrium to the product side, binding more oxygen with the hemoglobin. When the blood arrives in tissues, the concentration of oxygen is lower in tissues, causing the equilibrium to shift to the reactant side, releasing the oxygen.
The oxygen concentration decreases as the altitude increases. The mountain climbers may experience hypoxia, i.e., inadequate supply of oxygen to the body because the lower level of oxygen at high altitude may shift the equilibrium to the right, resulting in less binding of oxygen with the hemoglobin in the lungs. The body reacts by producing more hemoglobin, but it takes about 10 days for the body to re-adjust the hemoglobin level in the blood. Peoples living at higher altitudes usually have a higher level of hemoglobin in their blood for the reasons described above.
Effect of pressure on a chemical equilibrium
Changes in pressure do not affect the concentration of solids and liquid. However, an increase in pressure decreases the volume, and, consequently, increases the concentration of gases, as illustrated in Fig. 6.4.5.
If a chemical equilibrium involves gases, an increase in pressure has the same effect as increases in the gaseous reactant or product—the equilibrium shifts in the direction where there are fewer moles of gases.
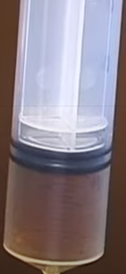
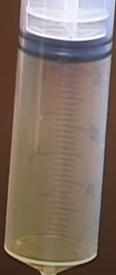
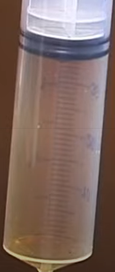
Fig. 6.4.6 demonstrated this effect for the equilibrium between colorless N2O4 gas and brown color NO2 gas:
\begin{equation}
\mathrm{N}_{2} \mathrm{O}_{4}(\mathrm{~g}, \text { colorless }) \rightleftarrows 2 \mathrm{NO}_{2}(\mathrm{~g}, \text { brown })\nonumber
\end{equation}
The color becomes light in going from a syringe on the right to the syringe in the middle. It can be explained based on the fact that the concentration of gases decreased upon an increase in volume as a result of a decrease in pressure. Then the color becomes darker over time, as shown by the syringe on the right. The darker color indicates that the equilibrium has shifted to the product side where there are more moles of gas, to relieve the stress.
Effect of temperature on a chemical equilibrium
Exothermic reaction releases heat, i.e., heat is one of the products. If the forward reaction is exothermic, the reverse reaction must be endothermic by the same amount and vice versa.
When a reversible reaction at equilibrium is disturbed by increasing temperature, the equilibrium shifts in the endothermic direction of the reaction to remove the heat and vice versa.
In the equilibrium between colorless N2O4 and brown color NO2 gases, the reaction is endothermic in the forward direction:
\begin{equation}
\mathrm{N}_{2} \mathrm{O}_{4}(g, \text { colorless })+\text { Heat } \rightleftarrows 2 \mathrm{NO}_{2}(g, \text { brown })\nonumber
\end{equation}
An increase in temperature shifts the equilibrium in the endothermic direction to relieve the stress, as demonstrated in Fig. 6.4.7.